
Segger - Segmenting a density map
- Opening and visualizing a density map
As an example, the density map of GroEL at 10.0Å resolution (EMD:1080), from the EMDB, will be used. This map can be downloaded from this link. It can be opened in Chimera by selecting File->Open.... Once open, the density map will appear in the main Chimera window:
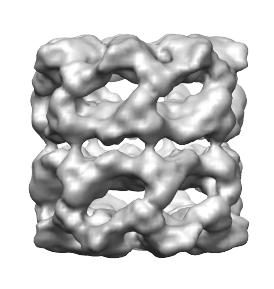
The Volume Viewer dialog will also appear as a result:
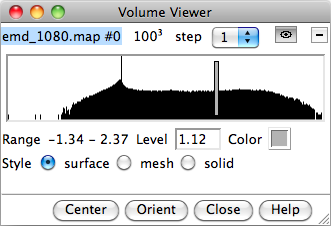
The Volume Viewer dialog can also be opened from Tools->Volume Data->Volume Viewer. It shows, amongst other information, a histrogram of the density values. The gray bar can be dragged left or right to change the threshold, which is the density value used to generate the iso-surface shown in the main window. At higher thresholds, the inner and denser regions are seen, and at lower thresholds, the outer surface of the molecular complex is seen.
- Opening the Segger interface
- Segmenting the map
- The name of the segmentation output file will appear in the field to the right of the Current Segmentation label. In this case, emd_1080.seg.
- To the right of that, it will say 28 regions. This is the number of regions produced.
- At the bottom of the interface, just above the Segment button, it will also say "428 watershed regions, smoothed 3 voxels to get 28 regions". Look at this line when performing other operations for other messages related to segmentation and fitting.
- Segmenting options
- Using Segger with your own map
- Selecting and working with regions
- Editing the segmentation
- Saving segmentation results
The Segger interface can be opened by selecting Tools->Volume Data->Segger.
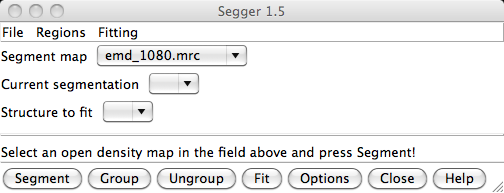
To segment the map, first make sure the map to be segmented is selected in the field to the right of the label Segment map in the Segger interface. This field is a drop-down menu, showing all the density maps currently open. If you open Segger after opening a density map, an open map will be selected by default. To select another map, click on the field, and then select it from the drop-down meny that appears.
The threshold chosen for the density map in the Volume Viewer interface will be used in the segmentation process - only voxels with density values above this value will be considered. Once you've adjusted the threshold, to for example 1.12 click the Segment button. After a few seconds, you will see the segmentation results in the main Chimera window, replacing the map previously shown there:
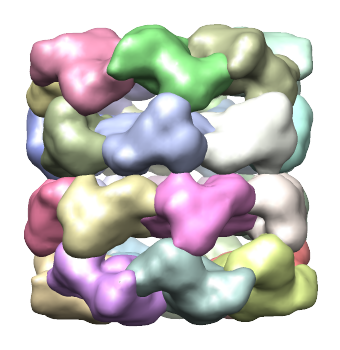
In the above segmentation, each region groups of two regions correspond to each protein. To get get a segmentation in which each region matches a single protein, see below in the discussion of Segmentation options and parameters.
3.1 Results of segmentation
Segmentation produces regions, with each region containing a number of adjacent (26-connected) voxels. Each region is shown as a smooth surface sourrounding the voxels it contains. The regions information is kept in a separate model in Chimera, which for the example above will have the name emd_1080.seg. (You can see this model in the Model Panel dialog).
After segmenting, notice three changes in the Segger interface:
3.2 Segmentation method
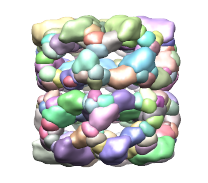
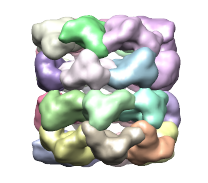
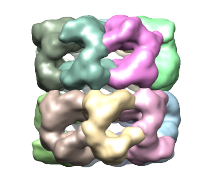
Segger uses the watershed method followed by scale-space filtering to group the resulting regions. The regions produced by watershed are usually small and numerous - an effect known as over-segmentation. These regions are shown below in first image on the left. To produce fewer and larger regions, the density map is smoothed and the regions are grouped based on the smoothed map. This is repeated for a number of steps. The step size specifies how much smoothing takes place. By default, 3 steps of size 1 are used, leading to a segmentation as shown in the image in the middle.
To get a segmentation in which each region corresponds to a protein, click the Options button in the Segger interface, enter 6 for the number of smoothing steps (leaving 1 as step size), and then press the Segment button. If we already knew there were 14 proteins in this density map, we can also enter a larger number of smoothing steps (e.g. 100), and 14 in the field to the right of "Stop grouping if number of regions <=". Try it...
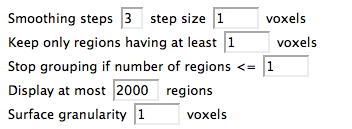
To change parameters for the segmentation process, press the Options button at the bottom of the Segger window to display the Options pane. The segmenting part of these options pane is shown below:
4.1 Number of smoothing steps and step size
You can specify a different number of smoothing steps and step size. If it looks like the regions obtained should be larger and there should be fewer of them, increase the number of smoothing steps. The step size parameter is a bit harder to pick, and it will change the results, but not as significantly. When smaller step sizes are used, less smoothing is performed at each step, and so the number of and the shape of each region will change more gradually. Thus to get to a particular number of regions, more steps will be required. With larger step sizes, changes will be more drastic, but fewer steps will be required to get to a particular number of regions. Experiment with different numbers on your map... When the map contains a lot of noise, larger steps are recommended, since smoothing tends to reduce the bad effects of noise. For ungrouping and regrouping purposes, use smaller step sizes, since this will give you fewer regions at each ungrouping step.
4.2 Region size filter
Regions are filtered by size. This can be used to remove any regions that are very small and would likely be due to noise. Regions that consist of fewer voxels than the number entered in the field to the right of "keep only regions having at least" are ignored completely. By default, this number is 1, meaning that every segmented region will be displayed (a region can only exist if it has at least one voxel in it).
Note that this filter is applied to the initial segmentation process only, and not after smoothing has been performed.
4.3 Target number of regions
In some cases, you might know how many proteins you are looking for in a density map. For example, GroEL contains 14 proteins, so we knew ahead of time were were aiming to get 14 regions. This number can be entered in the field to the right of 'Stop grouping if number of regions <='. Then the process stops when this number of regions is reached. So if more steps were entered in number of smoothing steps, only 5 steps would have been taken, since after this number of steps, the number of regions becomes 14.
4.4 Limiting the number of regions shownThe number of regions in some density maps can be quite larger (tens of thousands). With this many regions, performance may become very slow on some computers. Hence, the number to the right of of the label 'Display at most ... regions' limits how many regions are shown. If you have a faster computer with a great graphics card, and you'd like to see more regions, you can increase this number. Even though not all the regions are shown, they are still used when smoothing and grouping. So if you get more regions than you can view, you can try using more smoothing steps, which will produce fewer regions.
4.5 Surface granularityYou reduce the surface complexity of each region by increasing this number. That may lead in faster display times.
Now that you know how Segger works, and what the parameters do, go ahead and try Segger with your own map. Load the map in Chimera, select it in the field to the right of 'Segment map', choose a threshold in the Volume Viewer dialog, and then press Segment. Adjust the segmenting parameters as described above.
In the main Chimera window, where the segmented regions are shown, a region can be selected using the usual Chimera selection mechanism. For example, while holding Ctrl, clicking on a region selects it (you will see a greenish border around it), or unselects it if it is already selected.
Multiple regions can also be selected; clicking on a region while holding Shift+Ctrl adds it to the current selection if it isn't already in the selection, or removes it from the selection if it is in the selection already.
Selected regions can be hidden, deleted, made transparend, etc., by selecting the one of the entries in the Regions menu which appears at the top of the Segger window.
Other important operations are grouping and ungrouping regions.
To group two or more regions, select them and then press the Group button at the bottom of the Segger dialog. The regions will now be combined, and shown using a single surface. To ungroup a region, select it and then press the Ungroup button at the bottom of the Segger dialog. You can ungroup regions that you previously grouped, or wheich were grouped by smoothing and grouping!
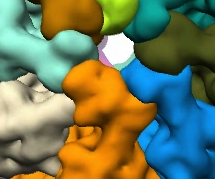
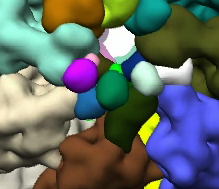
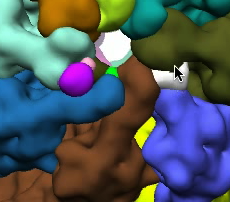
Grouping and ungrouping can be used to modify the resulting segmentation, to adjust for example a region that looks wrong. This process is illustrated below - first the orange region in the image on the left is ungrouped, producing smaller regions
, which are then regrouped with nearby regions.
If you try to ungroup a region you obtained by smoothing and grouping (simply having pressed the Segment button with multiple smoothing steps), and it gets ungrouped into too many small regions, then you can try redoing the process, but using more steps, and steps that are smaller in size. This way, the grouping will be more gradual, and the intermediate regions sizes and numbers will drop more gradually.
 _
_
 _
_
You can save and load a previously saved segmenation through the File menu at the top of the Segger interface.
Please contact Greg Pintilie by email with comments and suggestions.

