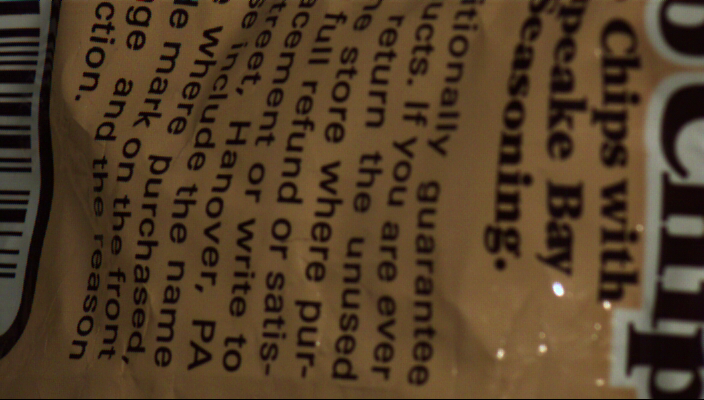
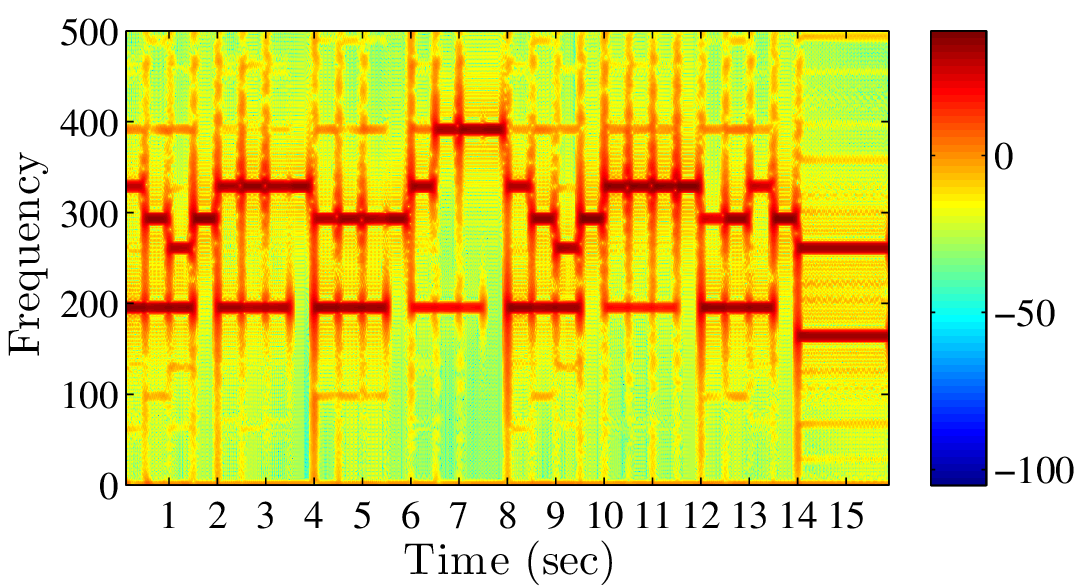
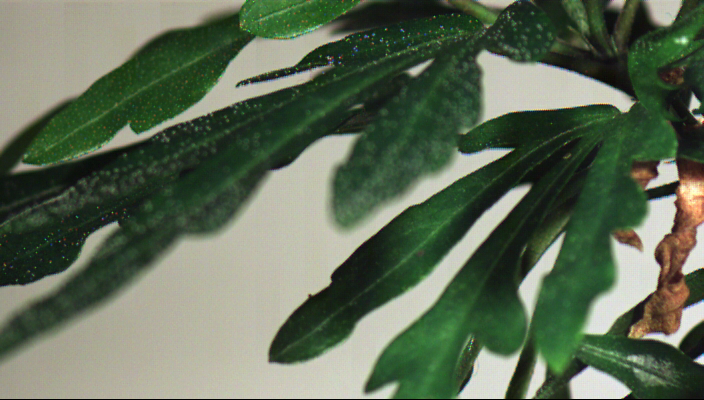
In these experiments, we played the a MIDI recording of "Mary had a little lamb" at a bag of chips and a plant and recover the audio from a video of those objects using our technique. These examples are presented in Figure 1 in the paper. However, in that figure, the color axis of the spectrograms are shown on a linear scale. Here, we show them on a logarithm scale to give a sense of the noise characteristics of our algorithm. Because the input audio changes consists of pure tones that change frequency abruptly, the spectrum is smeared across all frequencies at these changes as shown both in the input and our result.
| Input (Video) | Input (Audio) | Recovered (Audio) |
|---|---|---|
 |
 |
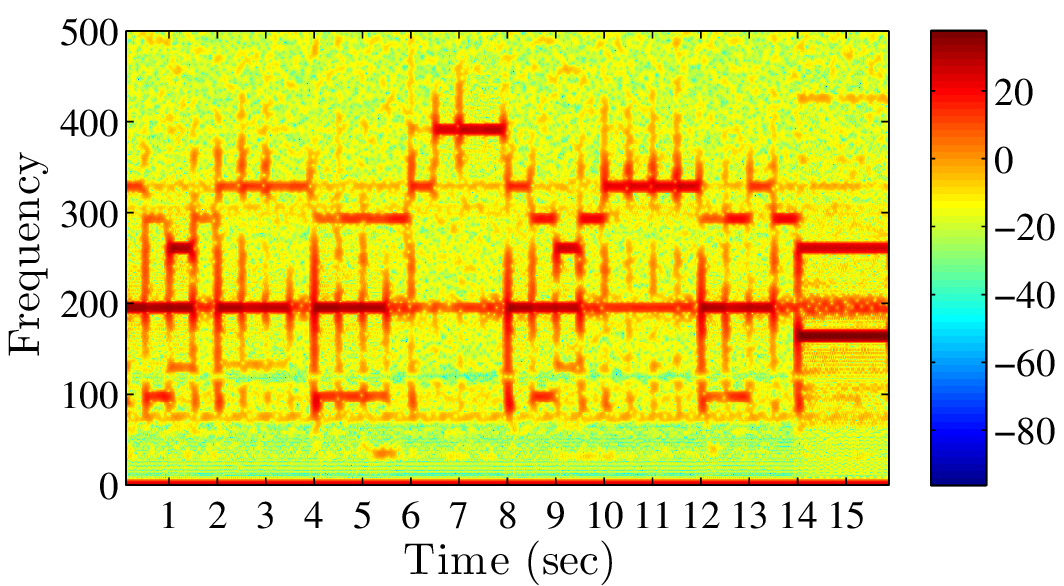 |
| Chips2, 2200Hz | Play | Play |
 |
 |
 |
| Plant, 2200Hz | Play | Play |