Objective Analysis
We compare between objective measures and the collected user data by correlating their rankings. Kendall tau distance (Equation 3 in the paper) is used to measure the degree of correlation between the rankings induced by the two measures. This page shows results of this analysis.
- Analysis images - results on the 37 images selected for the study in the paper
- All user study images - analysis including some extra images
Analysis images
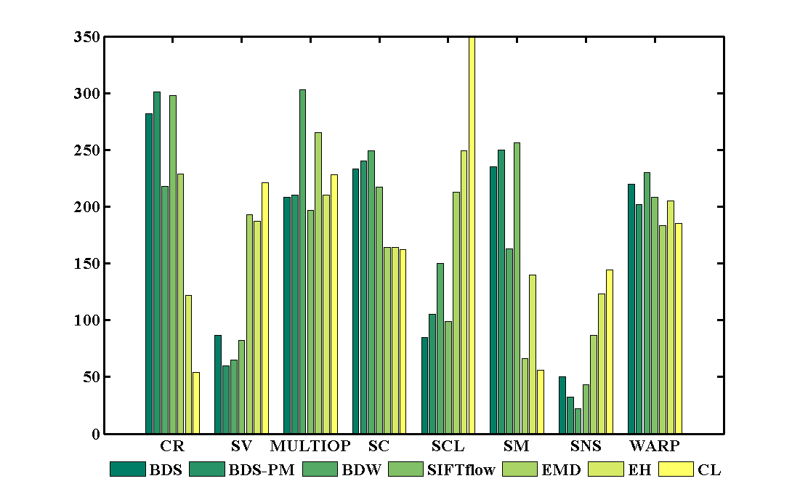
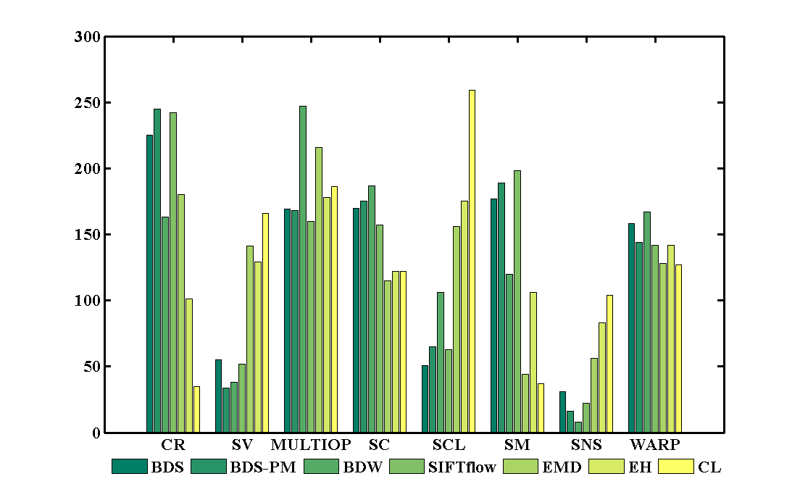
We examine the bias of each metric by simulating a voting process based on the calculated distances. For each operator, we count the number of times its result is smaller than another result, and accumulate over all images and metrics. The following figure shows the distribution of metric “votes” among the operators for the different metrics we tested.
The following tables show the correlation of objective and subjective measures for the full ranking, and with respect to the k top-ranked results, for k=2,3,4. For each k we also show the pairwise metric correlations (measured by correlating the rankings produced by each pair of metrics for each image).
Full ranking (k=inf)
Metric |
Attribute |
Total |
|||||||
Lines/Edges |
Faces/People |
Texture |
Foreground Objects |
Geometric Structures |
Symmetry |
Mean |
Std |
p-value |
|
BDS |
0.040 |
0.190 |
0.060 |
0.167 |
-0.004 |
-0.012 |
0.083 |
0.268 |
0.017 |
BDS-PM |
0.054 |
0.162 |
0.083 |
0.167 |
0.063 |
-0.024 |
0.097 |
0.232 |
0.013 |
BDW |
0.031 |
0.048 |
-0.048 |
0.060 |
0.004 |
0.119 |
0.046 |
0.181 |
0.869 |
SIFTflow |
0.097 |
0.252 |
0.119 |
0.218 |
0.085 |
0.071 |
0.145 |
0.262 |
0.031 |
EMD |
0.220 |
0.262 |
0.107 |
0.226 |
0.237 |
0.500 |
0.251 |
0.272 |
0.000 |
EH |
0.043 |
-0.076 |
-0.060 |
-0.079 |
0.103 |
0.298 |
0.004 |
0.334 |
0.641 |
CL |
-0.023 |
-0.181 |
-0.071 |
-0.183 |
-0.009 |
0.214 |
-0.068 |
0.301 |
0.384 |
Correlation with users
In each column the mean correlation coefficient is shown, calculated over all images in the dataset with the corresponding attribute. The last three columns show the mean score, standard deviation, and respective p-value over all image types.
Metric |
BDS |
BDS-PM |
BDW |
SIFTflow |
EMD |
EH |
CL |
BDS |
1.00 |
0.77 |
0.48 |
0.68 |
0.14 |
-0.01 |
-0.33 |
BDS-PM |
0.77 |
1.00 |
0.53 |
0.77 |
0.15 |
0.01 |
-0.37 |
BDW |
0.48 |
0.53 |
1.00 |
0.45 |
0.29 |
0.15 |
0.04 |
SIFTflow |
0.68 |
0.77 |
0.45 |
1.00 |
0.21 |
-0.03 |
-0.36 |
EMD |
0.14 |
0.15 |
0.29 |
0.21 |
1.00 |
0.24 |
0.31 |
EH |
-0.01 |
0.01 |
0.15 |
-0.03 |
0.24 |
1.00 |
0.31 |
CL |
-0.33 |
-0.37 |
0.04 |
-0.36 |
0.31 |
0.31 |
1.00 |
Correlation between metrics
Each cell indicates the mean rank coefficient between metric i and metric j over all images in the dataset.
k=2
Metric |
Attribute |
Total
|
|||||||
Lines/Edges |
Faces/People |
Texture |
Foreground Objects |
Geometric Structures |
Symmetry |
Mean |
Std |
p-value |
|
BDS |
-0.240 |
0.286 |
-0.208 |
0.155 |
-0.375 |
-0.500 |
-0.134 |
0.827 |
0.000 |
BDS-PM |
-0.120 |
0.279 |
-0.208 |
0.233 |
-0.078 |
-0.208 |
-0.008 |
0.800 |
0.000 |
BDW |
0.184 |
0.073 |
0.042 |
0.047 |
0.053 |
0.750 |
0.147 |
0.735 |
0.000 |
SIFTflow |
-0.126 |
0.386 |
-0.542 |
0.355 |
0.037 |
-0.151 |
0.078 |
0.831 |
0.000 |
EMD |
0.220 |
0.369 |
0.000 |
0.155 |
0.078 |
0.433 |
0.224 |
0.726 |
0.000 |
EH |
-0.150 |
-0.467 |
-0.458 |
-0.514 |
0.016 |
-0.167 |
-0.236 |
0.810 |
0.000 |
CL |
-0.676 |
-0.794 |
-0.792 |
-0.861 |
-0.688 |
-0.234 |
-0.673 |
0.593 |
0.000 |
Correlation with users
Metric |
BDS |
BDS-PM |
BDW |
SIFTflow |
EMD |
EH |
CL |
BDS |
1.00 |
0.83 |
0.11 |
0.64 |
0.20 |
-0.44 |
-0.86 |
BDS-PM |
0.83 |
1.00 |
0.17 |
0.71 |
0.18 |
-0.40 |
-0.86 |
BDW |
0.11 |
0.17 |
1.00 |
-0.09 |
0.51 |
-0.18 |
-0.26 |
SIFTflow |
0.64 |
0.71 |
-0.09 |
1.00 |
0.25 |
-0.36 |
-0.97 |
EMD |
0.20 |
0.18 |
0.51 |
0.25 |
1.00 |
-0.01 |
-0.25 |
EH |
-0.44 |
-0.40 |
-0.18 |
-0.36 |
-0.01 |
1.00 |
0.01 |
CL |
-0.86 |
-0.86 |
-0.26 |
-0.97 |
-0.25 |
0.01 |
1.00 |
Correlation between metrics
k=3
Metric |
Attribute |
Total
|
|||||||
Lines/Edges |
Faces/People |
Texture |
Foreground Objects |
Geometric Structures |
Symmetry |
Mean |
Std |
p-value |
|
BDS |
0.062 |
0.280 |
0.134 |
0.249 |
-0.025 |
-0.247 |
0.108 |
0.532 |
0.005 |
BDS-PM |
0.165 |
0.299 |
0.273 |
0.350 |
0.221 |
-0.052 |
0.210 |
0.464 |
0.000 |
BDW |
0.213 |
0.141 |
0.123 |
0.115 |
0.212 |
0.439 |
0.200 |
0.395 |
0.002 |
SIFTflow |
0.241 |
0.428 |
0.312 |
0.442 |
0.303 |
0.002 |
0.298 |
0.483 |
0.000 |
EMD |
0.301 |
0.416 |
0.216 |
0.295 |
0.226 |
0.534 |
0.326 |
0.496 |
0.000 |
EH |
-0.036 |
-0.207 |
-0.331 |
-0.177 |
0.111 |
0.294 |
-0.071 |
0.593 |
0.013 |
CL |
-0.307 |
-0.336 |
-0.433 |
-0.519 |
-0.366 |
0.088 |
-0.320 |
0.543 |
0.000 |
Correlation with users
Metric |
BDS |
BDS-PM |
BDW |
SIFTflow |
EMD |
EH |
CL |
BDS |
1.00 |
0.80 |
0.38 |
0.69 |
0.27 |
-0.21 |
-0.64 |
BDS-PM |
0.80 |
1.00 |
0.35 |
0.76 |
0.24 |
-0.25 |
-0.76 |
BDW |
0.38 |
0.35 |
1.00 |
0.25 |
0.42 |
0.14 |
-0.03 |
SIFTflow |
0.69 |
0.76 |
0.25 |
1.00 |
0.30 |
-0.24 |
-0.76 |
EMD |
0.27 |
0.24 |
0.42 |
0.30 |
1.00 |
0.12 |
0.09 |
EH |
-0.21 |
-0.25 |
0.14 |
-0.24 |
0.12 |
1.00 |
0.27 |
CL |
-0.64 |
-0.76 |
-0.03 |
-0.76 |
0.09 |
0.27 |
1.00 |
Correlation between metrics
k=4
Metric |
Attribute |
Total
|
|||||||
Lines/Edges |
Faces/People |
Texture |
Foreground Objects |
Geometric Structures |
Symmetry |
Mean |
Std |
p-value |
|
BDS |
0.063 |
0.236 |
0.122 |
0.146 |
-0.010 |
-0.057 |
0.097 |
0.392 |
0.052 |
BDS-PM |
0.156 |
0.278 |
0.215 |
0.262 |
0.148 |
0.018 |
0.187 |
0.338 |
0.003 |
BDW |
0.077 |
0.084 |
0.005 |
0.082 |
0.030 |
0.164 |
0.092 |
0.287 |
0.102 |
SIFTflow |
0.218 |
0.416 |
0.354 |
0.360 |
0.214 |
0.148 |
0.272 |
0.376 |
0.000 |
EMD |
0.299 |
0.429 |
0.154 |
0.297 |
0.243 |
0.676 |
0.338 |
0.436 |
0.000 |
EH |
0.031 |
-0.014 |
-0.049 |
-0.030 |
0.108 |
0.349 |
0.021 |
0.401 |
0.003 |
CL |
-0.112 |
-0.230 |
-0.137 |
-0.277 |
-0.158 |
0.155 |
-0.155 |
0.394 |
0.000 |
Correlation with users
Metric |
BDS |
BDS-PM |
BDW |
SIFTflow |
EMD |
EH |
CL |
BDS |
1.00 |
0.79 |
0.47 |
0.68 |
0.18 |
-0.11 |
-0.47 |
BDS-PM |
0.79 |
1.00 |
0.45 |
0.79 |
0.18 |
-0.11 |
-0.59 |
BDW |
0.47 |
0.45 |
1.00 |
0.37 |
0.30 |
0.13 |
-0.07 |
SIFTflow |
0.68 |
0.79 |
0.37 |
1.00 |
0.24 |
-0.13 |
-0.57 |
EMD |
0.18 |
0.18 |
0.30 |
0.24 |
1.00 |
0.22 |
0.23 |
EH |
-0.11 |
-0.11 |
0.13 |
-0.13 |
0.22 |
1.00 |
0.30 |
CL |
-0.47 |
-0.59 |
-0.07 |
-0.57 |
0.23 |
0.30 |
1.00 |
Correlation between metrics