Subjective Analysis
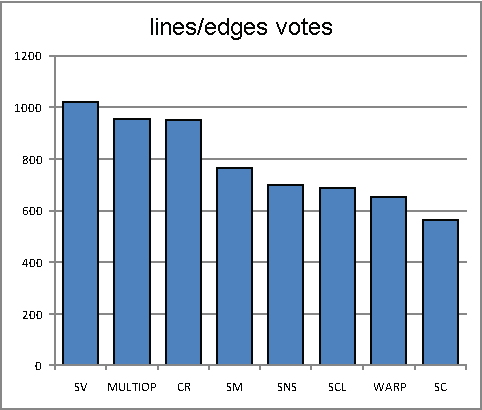
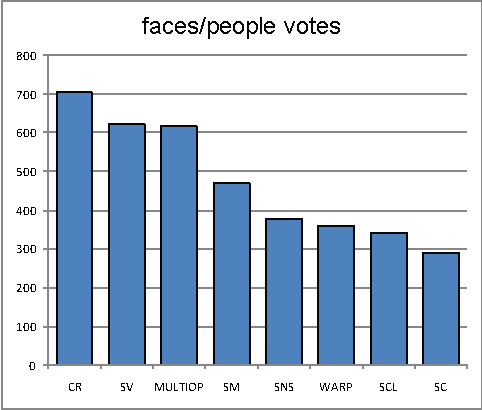
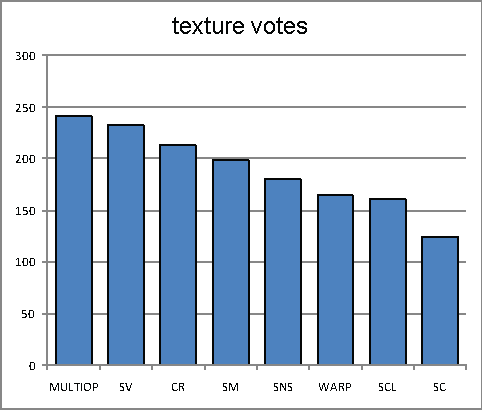
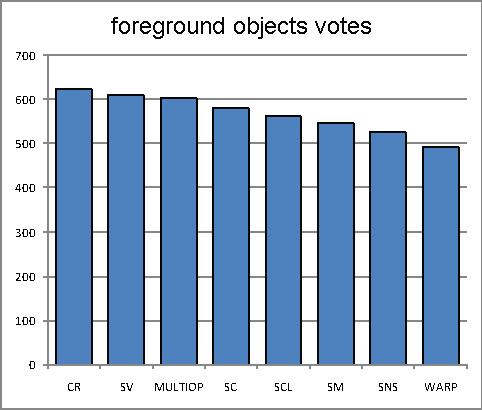
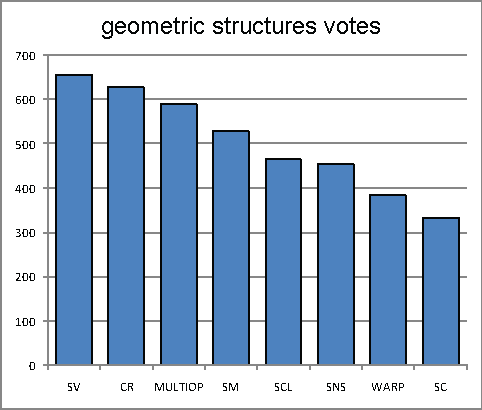
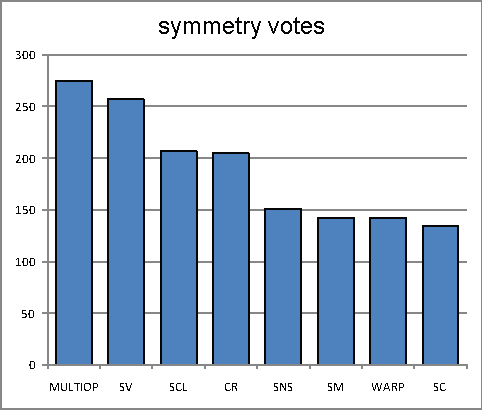
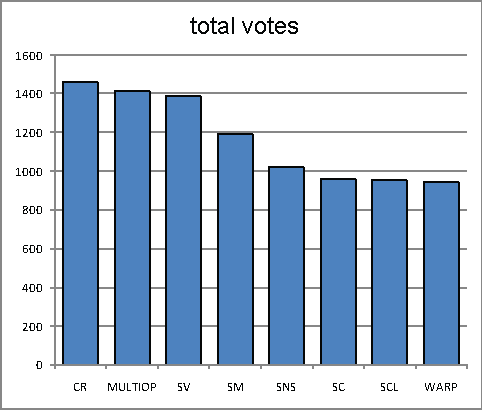
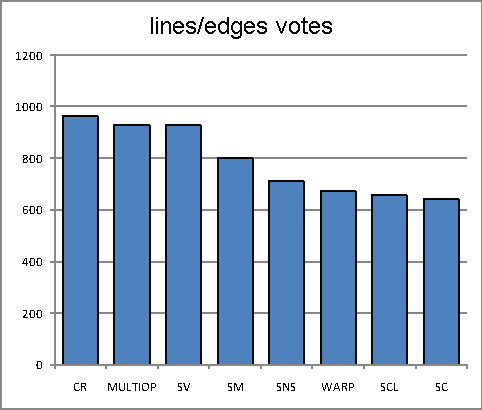
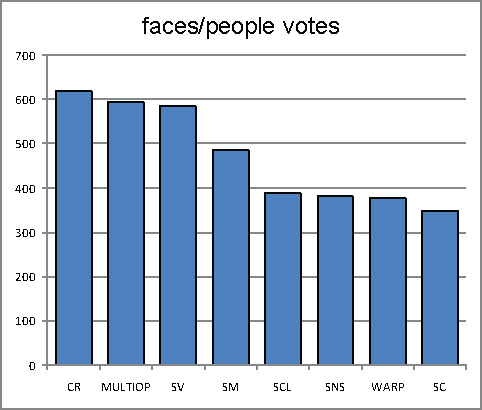
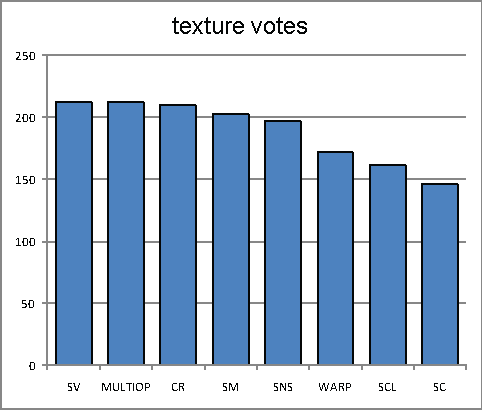
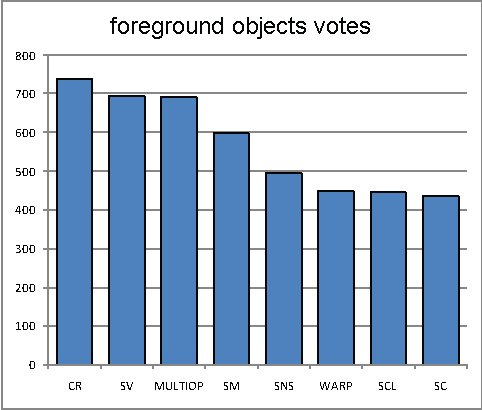
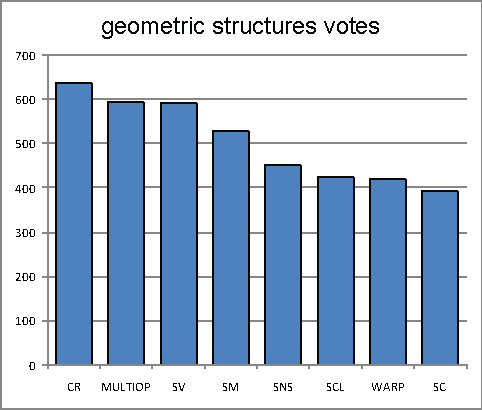
The eight methods are ranked by the number of votes received (number of times each method was preferred over another). We show both the global accumulation, as well as the breakdown of the votes per image attribute. Accumulative user votes are shown for both versions of the survey.
Reference version
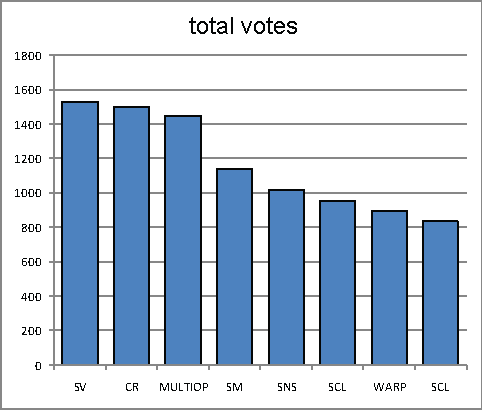 |
Sorted by rank product |
 |
 |
 |
 |
 |
 |
No-reference version
 |
Sorted by rank product |
 |
 |
 |
 |
 |
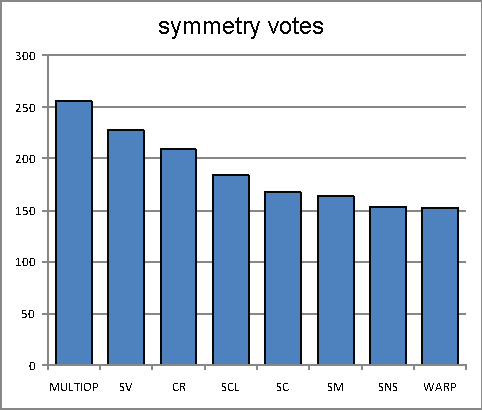 |
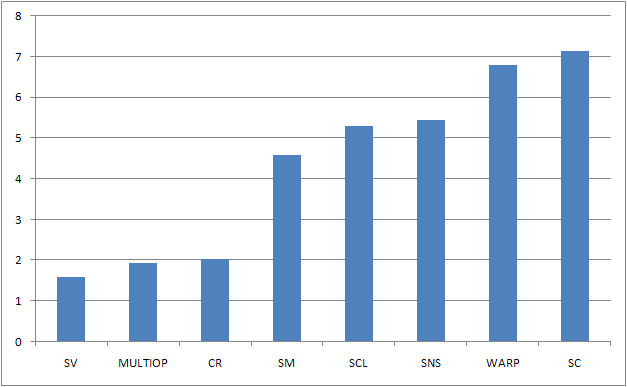
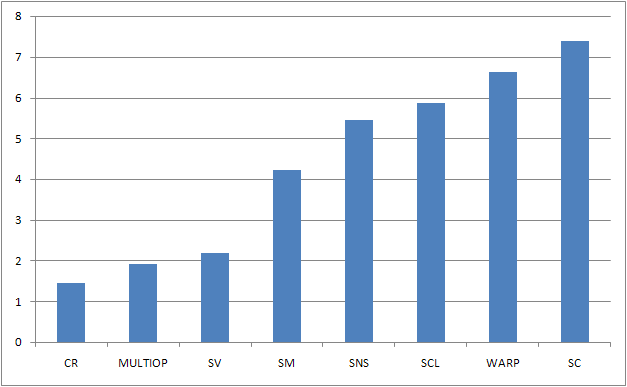
Operator ranking
We perform a significance test of the differences in scores in the above figures in order to reveal whether any two retargeting algorithms produced results that were statistically indistinguishable, or clearly different (Equation 2 in the paper). The grouping of operators that is the result of this test is shown in the following figures, for each attribute and for the combined analysis. Operators are ordered according to received votes from left (more votes) to right (less votes). Operators within a group are statistically indistinguishable in terms of user preference.
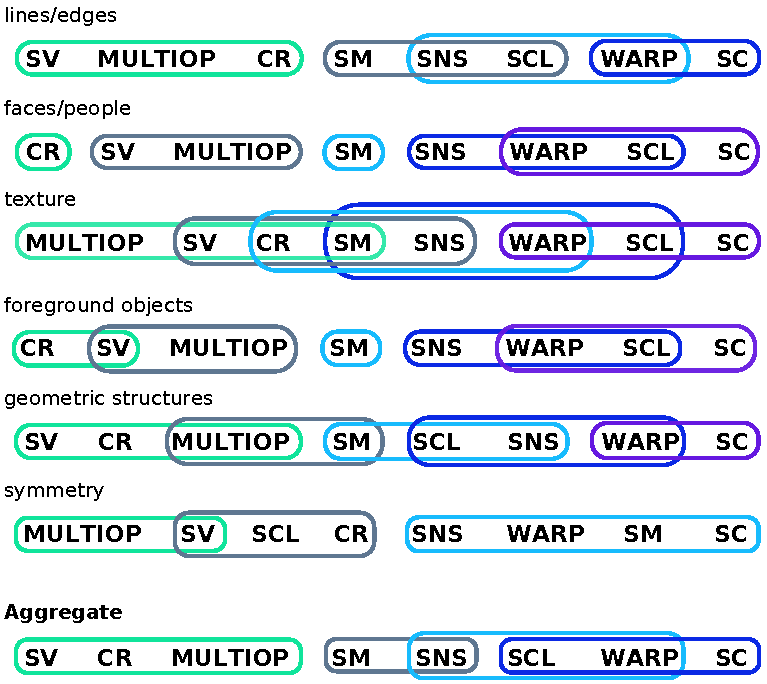 |
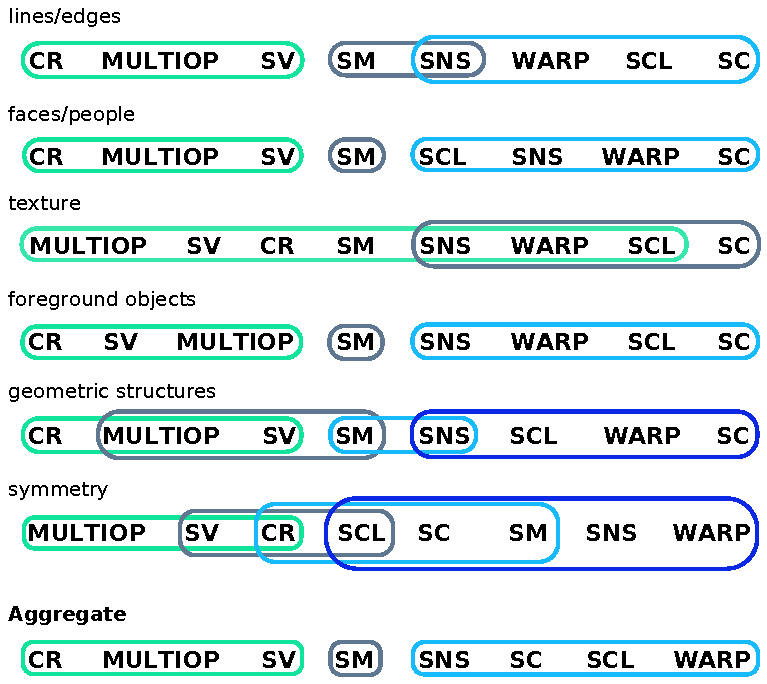 |
Reference version |
No-reference version |