Performance Statistics
This page details some statistics on the time it took users to complete their questionnaire, and perform comparisons.
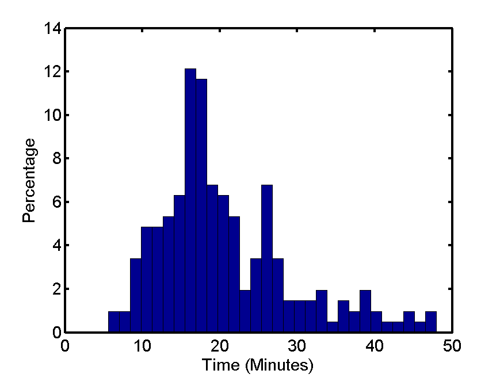
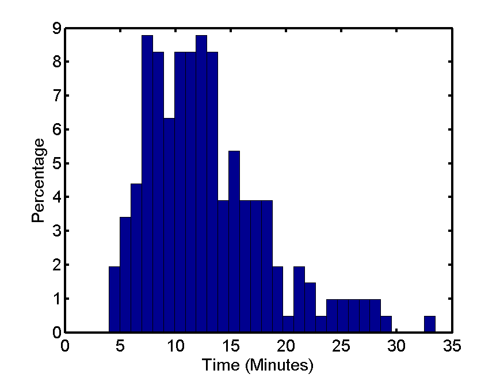
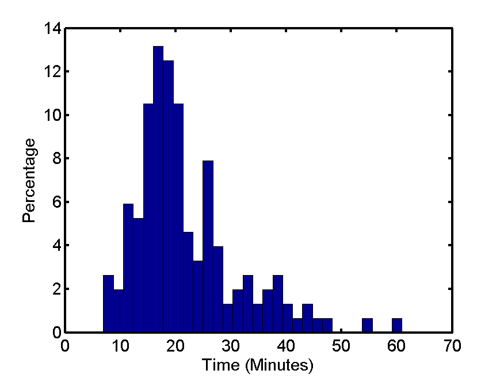
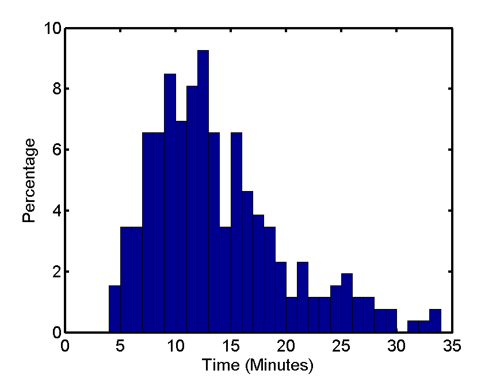
Total session time
The start and end time for each session is calculated from the the moment the user starts to enter his/her details, until he/she reaches the last page.
Upper 5 percent of the timings were filtered in the following figures (users might have paused during the survey).
 |
 |
Reference |
No-reference |
 |
 |
Volunteers |
MT Workers |
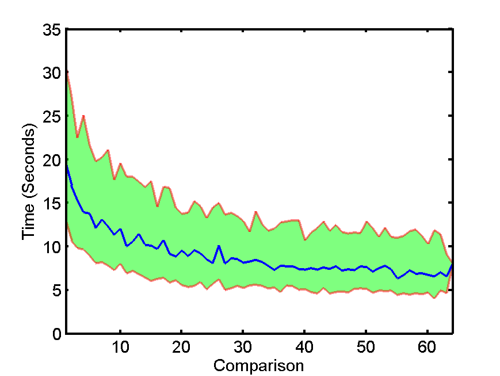
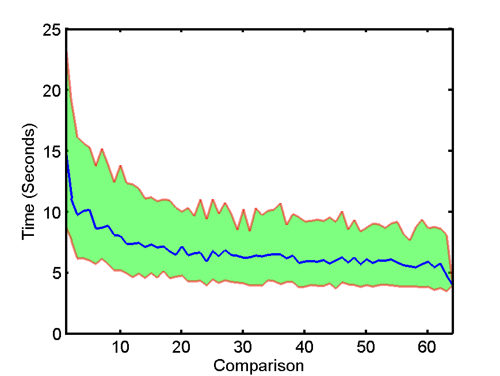
Comparison time
Another interesting question is whether users spent more time on specific comparisons, as well as how efficient our interface is. For this, we also measured the time it took the user to perform each comparison. To be as accurate as possible, we measured the time on the client machine, thus eliminating any performance issues on the range between the server and the user. A timer was started once the page was fully rendered, and stopped once the user submitted the selection. The following figures show the mean (blue) and 25th percentile (lower red curve) to 75th percentile (upper red curve) range for the two survey versions over all users. Notice the fast convergence, which indicates a moderate learning curve for using our interface.
 |
 |
Reference |
No-reference |
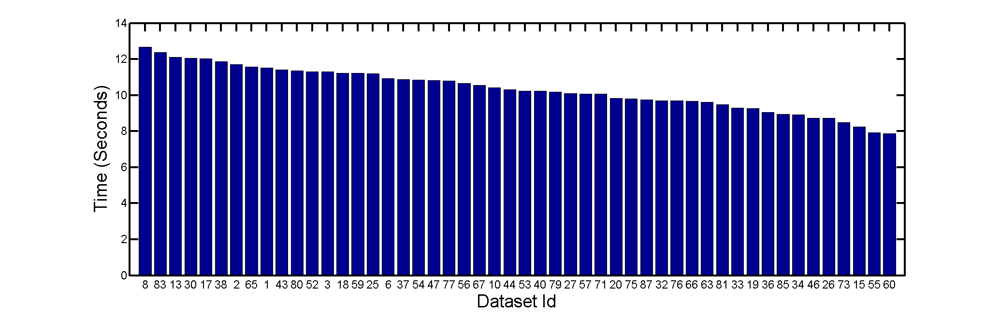
Comparison time by image
Mean comparison time is taken over all comparisons of each image. The plot is generated for percentiles 5-95 of the data. No special trend it apparent. Images and identifiers can be found here
Question time
Distribution of the time (in seconds) it took the users to answer the extra question (when given).
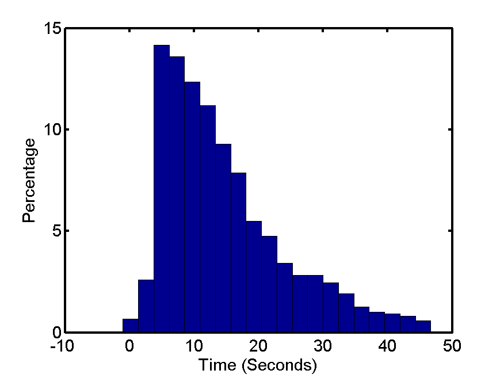
mean = 14.6998, std = 9.4523