| Empirically trained orientation detector |
An orientation map assigns a direction to every region in an image at a certain scale, summarizing the dominant orientation of edges within that region. Many mathematically sound methods have been developed to produce such maps. The work described here is almost just a thought experiment, to see how well it would be possible to perform this task without a model, and at as fine a scale as possible. (relevant chapter, pdf)
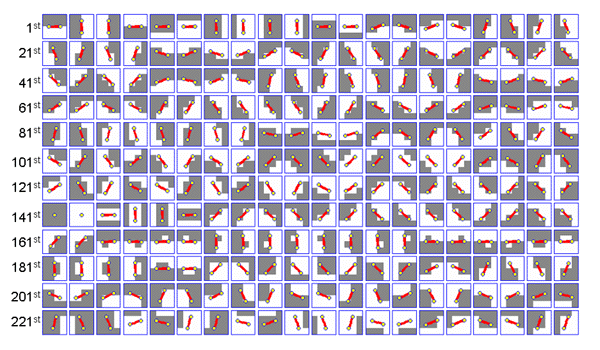
First, a robot experiments with tapping objects placed in front of it, and segments them based on motion. By sampling the appearance of these objects around their boundaries, the robot collects data about how appearance maps to edge direction. This information is accumulated over time. Figure 1 shows the angles assigned to the most common patches seen by the robot. Patches are small (4 by 4 pixels) and quantized to be binary for simplicity.
Once the relationship between appearance and direction is quantified, it is converted into a look-up table and applied to the images the robot sees. This assumes that appearance information learned from the boundaries of specific objects can usefully be applied to other situations. Experimentally, this proved to be true. An example look-up table for 4 by 4 binary patches (a very practical size) is available as a table (orient.txt) or distilled into an image for ease of use:
(download as png, ppm, bmp, or plain text)
To understand the table, begin with a patch you wish to assign a
direction to -- for example, the following:
| 0 | 0 | 0 | 0 |
| 0 | 0 | 1 | 1 |
| 0 | 1 | 1 | 1 |
| 1 | 1 | 1 | 1 |
To find the orientation of this patch, first convert it into a binary index by adding all the pixels weighted by the following coefficients:
| 215 | 214 | 213 | 212 |
| 211 | 210 | 29 | 28 |
| 27 | 26 | 25 | 24 |
| 23 | 22 | 21 | 20 |
The above patch corresponds to an index of 895 (29+28+26+25+24+23+22+21+20). So we look at line 895 of orient.txt. The second number on this line is the direction in radians (actually, it needs to be multiplied by two to get the direction, and then flipped in sign for positive angles to be counter-clockwise, the usual convention). The third number says whether the direction is meaningful (anything over a tiny threshold, e.g. 0.001, is fine). So in this case the angle is -0.57 radians or about 33 degrees.
The table can be conveniently compressed into an image (png, ppm, bmp) if we are willing to be selective about the
information we keep. The above image can be converted back to the
important columns of the table with code like the following (fill in
your own pixel access stuff):
for (int i=0; i<65536; i++)
{
  int column = i%256;
  int row = i/256;

  PIXEL& pix = GETPIXEL(column,row);

  float angle = pix.RED/100.0-1;
  float mag =  pix.GREEN/255.0;
  float freq = pix.BLUE;
  printf("%d %g %g %g\n", i, angle, mag, freq);
}
This isn't the best way to do this, and the quantization does have an
impact (particularly in the less than optimal way it is currently
done) but it is fun to have a picture to look at.