Due 4/24/2012 (Tuesday).
This homework assignment is to use a particle filter to localize the robot.
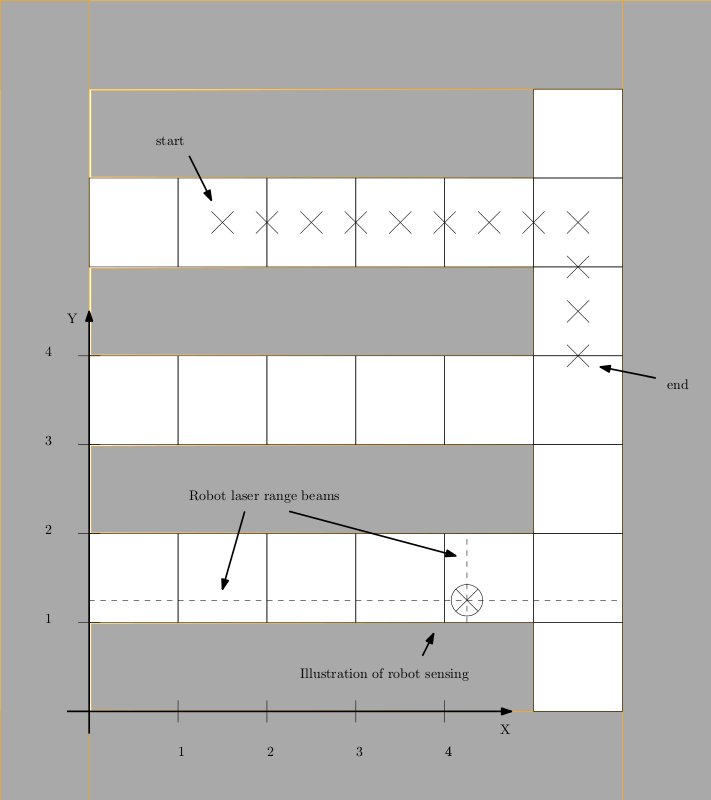
The environment is similar to that from the last assignment. However, in this assignment, the environment is two-dimensional and real-valued. The origin of the two-dimensional state space is shown in the lower left corner of the figure. The objective is to use a particle filter with 200 particles to estimate the real-valued location of the robot.
The position of the robot is not observed. However, on each time step, the robot observes range measurements from four laser range finders pointed in each of the four cardinal directions: left, right, up, and down, as illustrated at the bottom of the figure. Each of these range measurements is independently corrupted by Gaussian noise with a variance of 0.5.
The actions of the robot are as follows. On each time step, the robot chooses one of the four cardinal directions. The resulting displacement is a distance of 0.5 in that direction with Gaussian process noise with variance 0.4. If the robot displacement would have taken it inside of a wall, the resulting motion is for the robot to reach the edge of the wall and then stop.
As in the last assignment, the actual path taken by the robot is a predefined path beginning at the point labeled "start" and ending in the position labeled "end" along a series of twelve via points as illustrated in the figure. These via points are 0.5 distance apart. Estimation ends after twelve time steps.
Prior to the observation at time 1, the belief state is uniform over the free space.
The histogram filter should execute for twelve time steps.
The programming should be done in MATLAB or Octave. Students may get access to MATLAB here. Alternatively, students may code in Python (using Numpy). If the student would rather code in a different language, please see Dr Platt.
Students should submit their homework via email to the TA (zihechen@buffalo.edu) in the form of a ZIP file that includes the following:
1. a PDF file containing 13 plots of the particle distribution. The plots should show locations for all particles. The first plot should show the prior distribution (roughly uniform). The last plot should show the particle distribution after the update made on at the last via point.
2. A directory containing all source code for your project.
You should use 200 particles in this assignment.