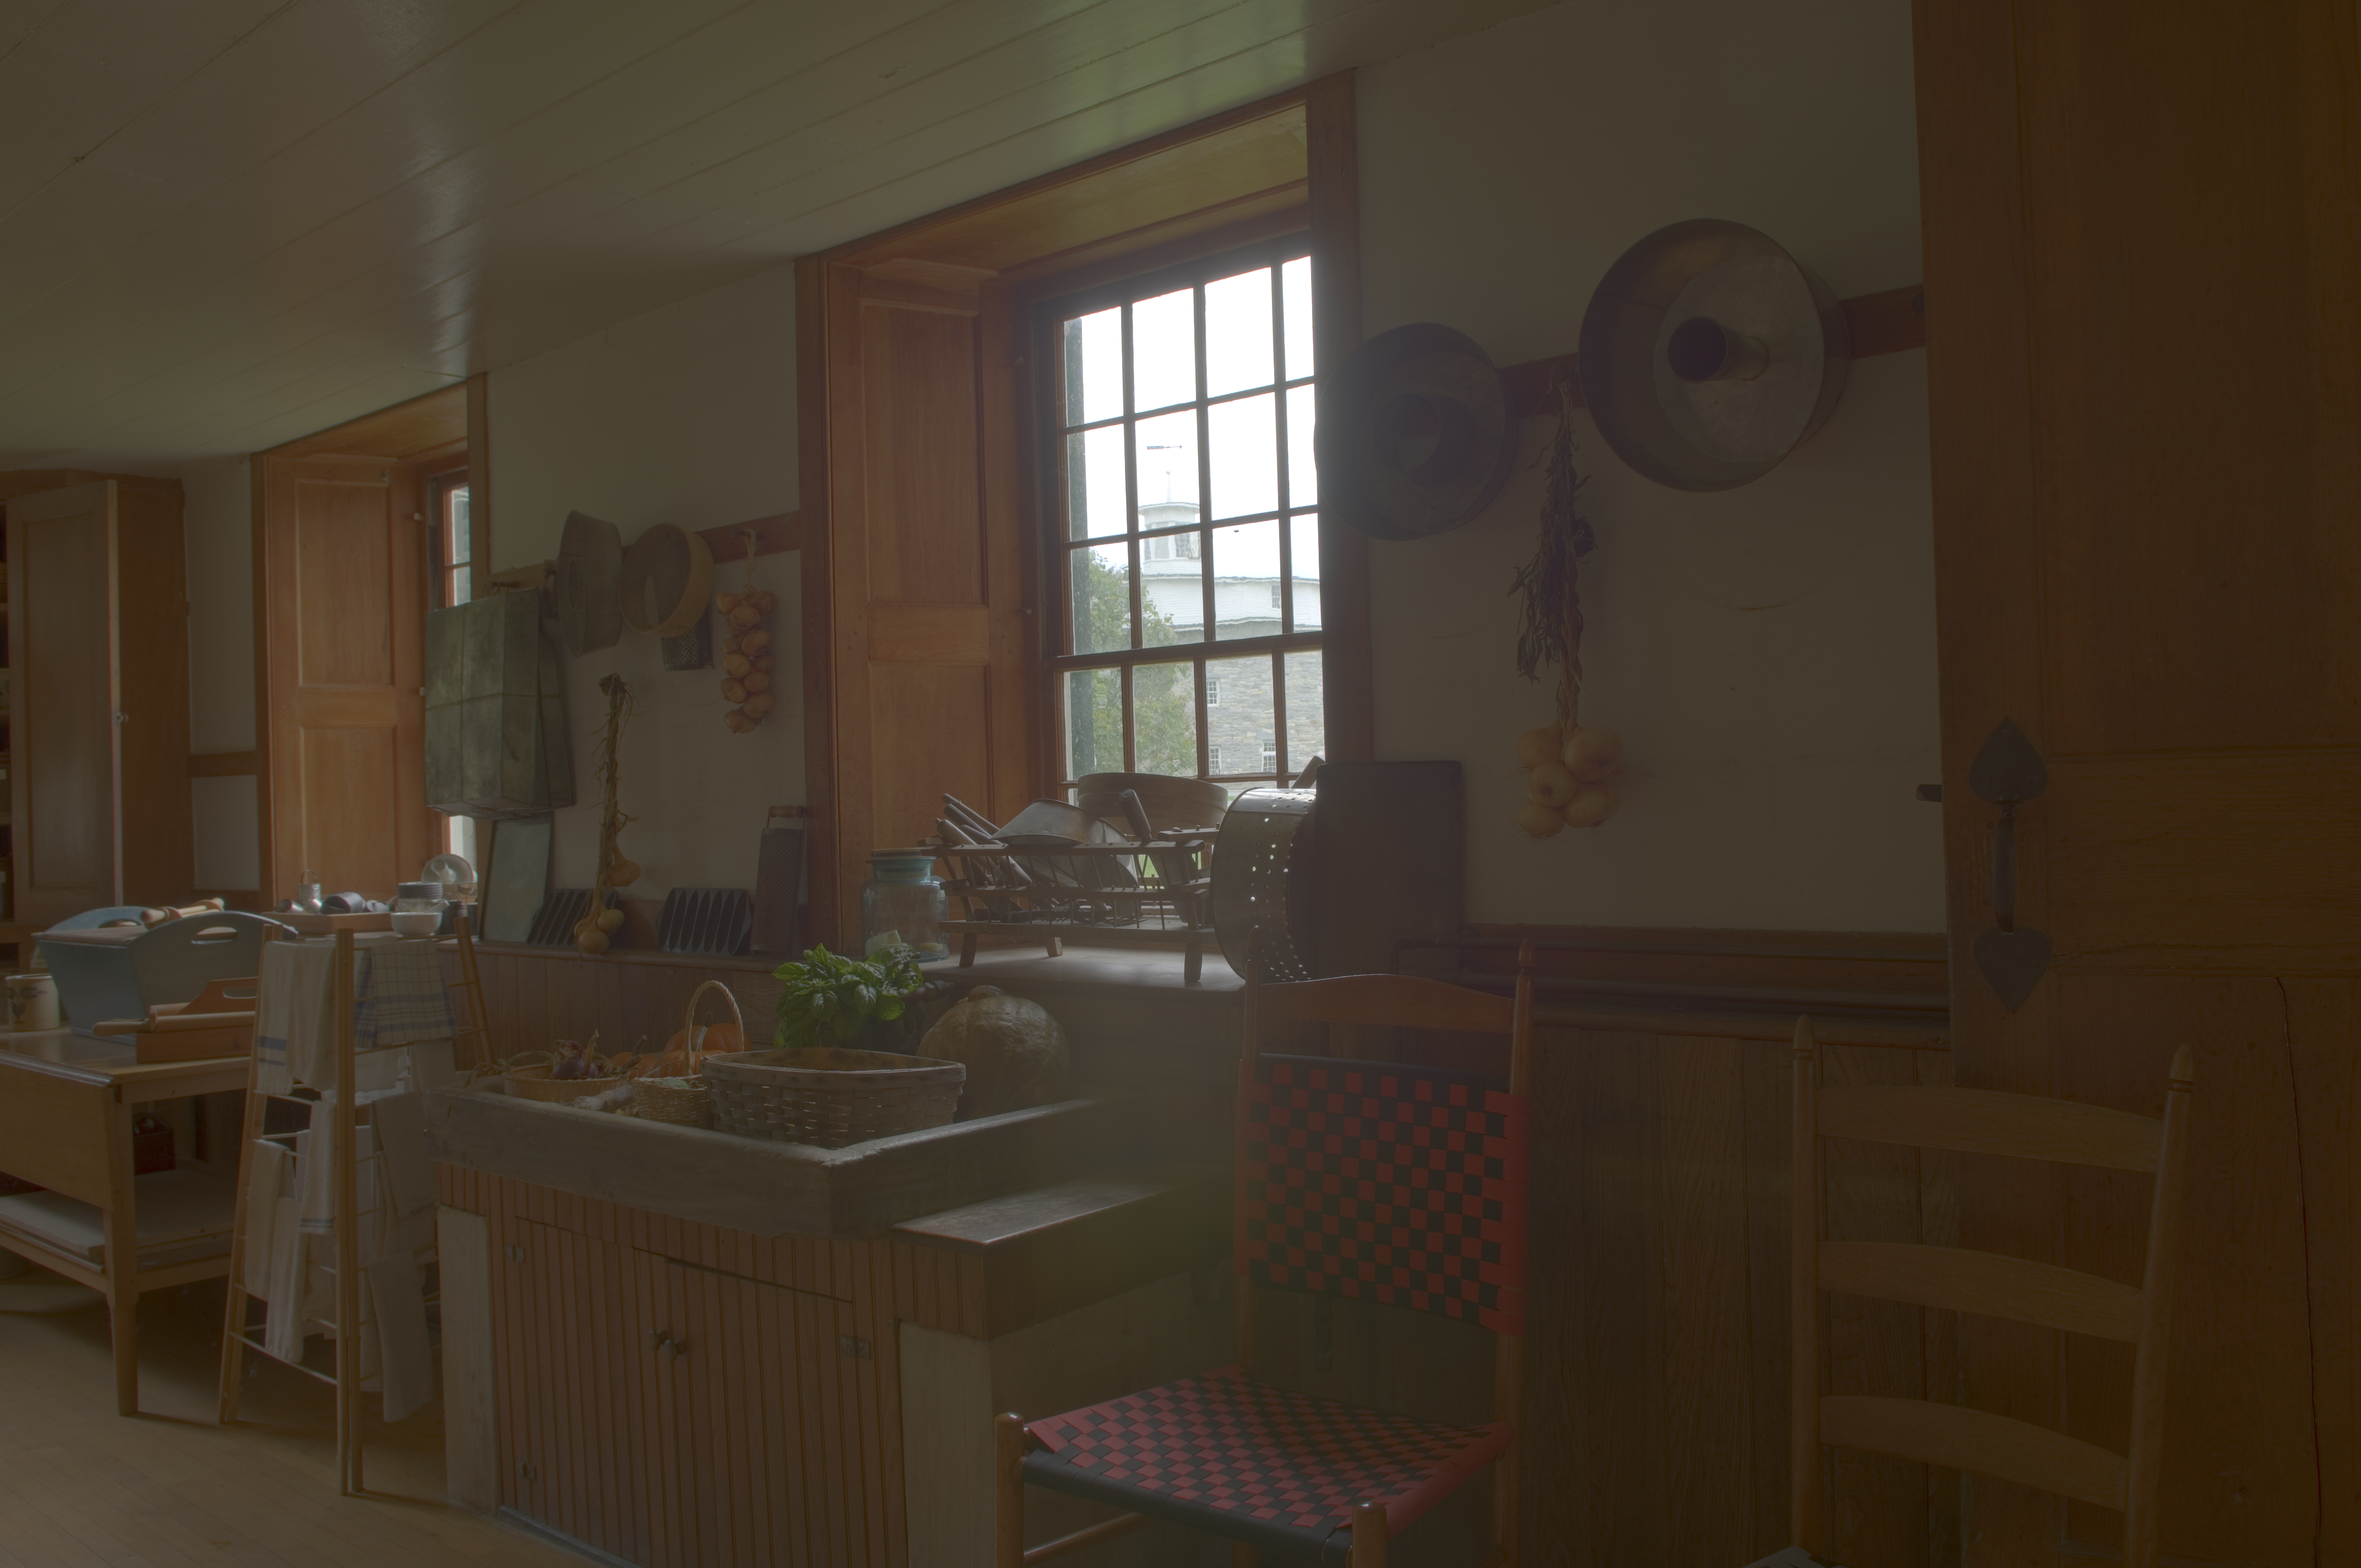
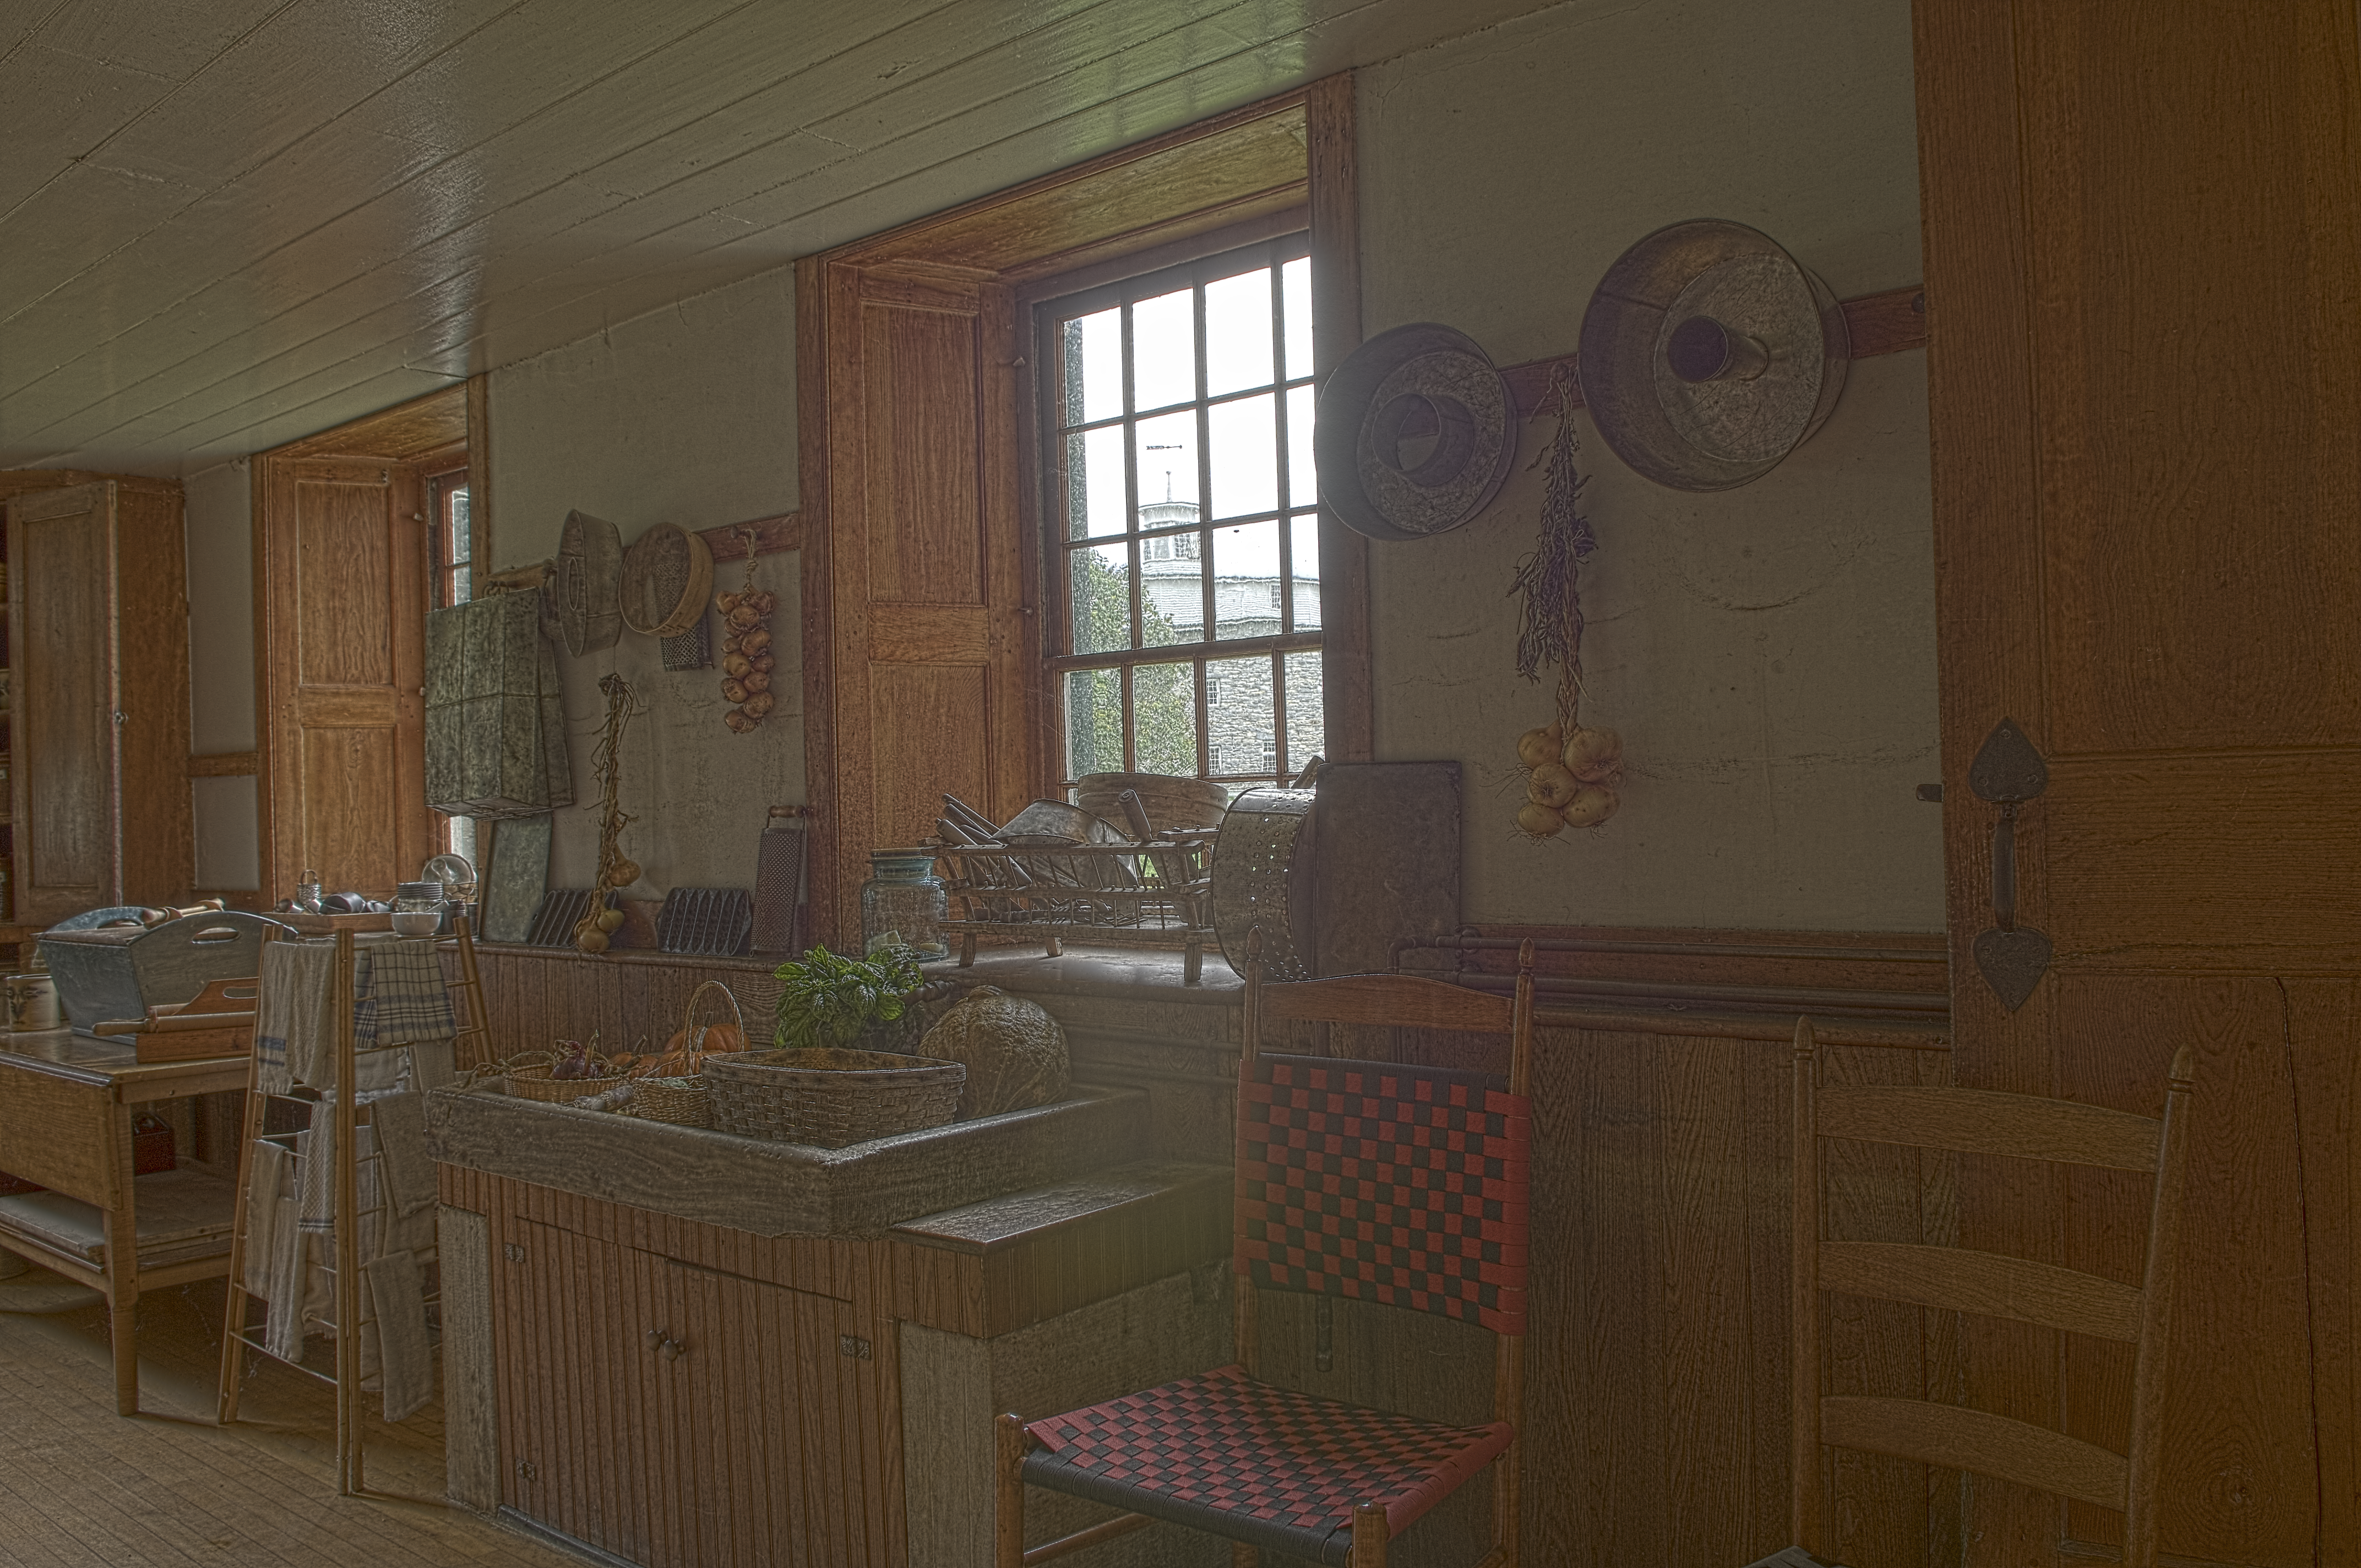
The original HDR image is available here. Below we show it tone mapped with a simple gamma curve for display purposes.
|
2. Results
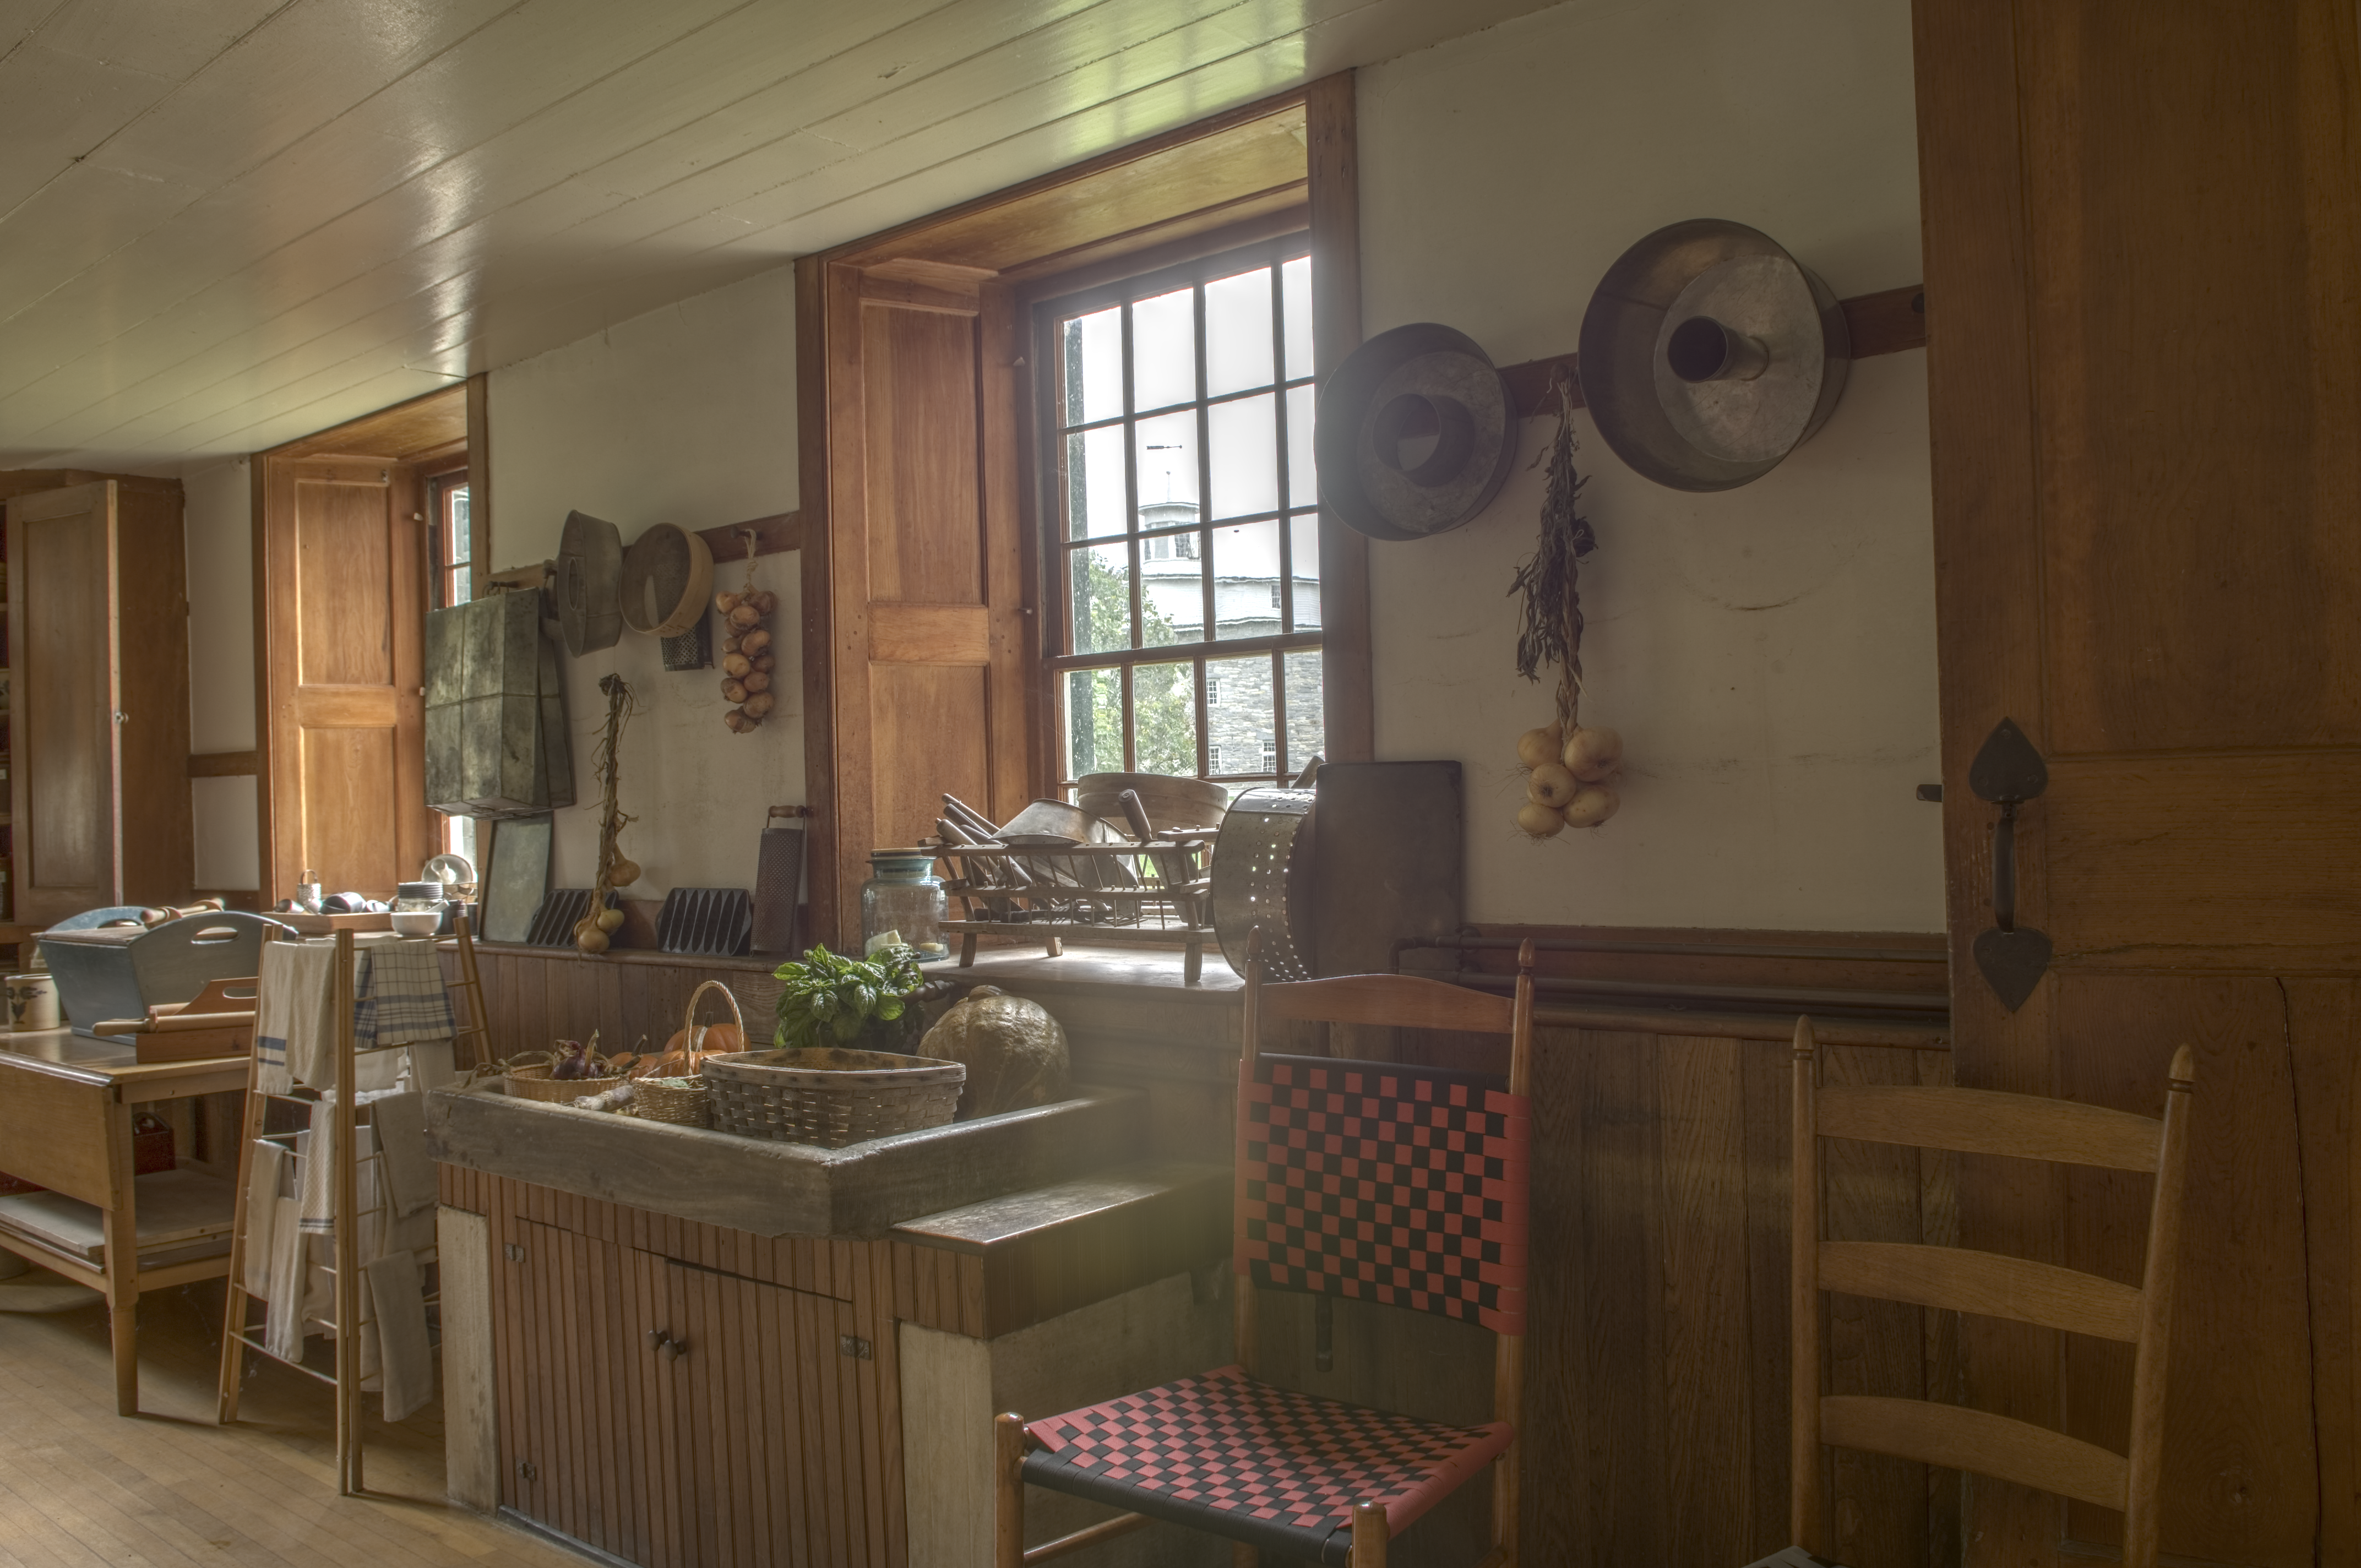
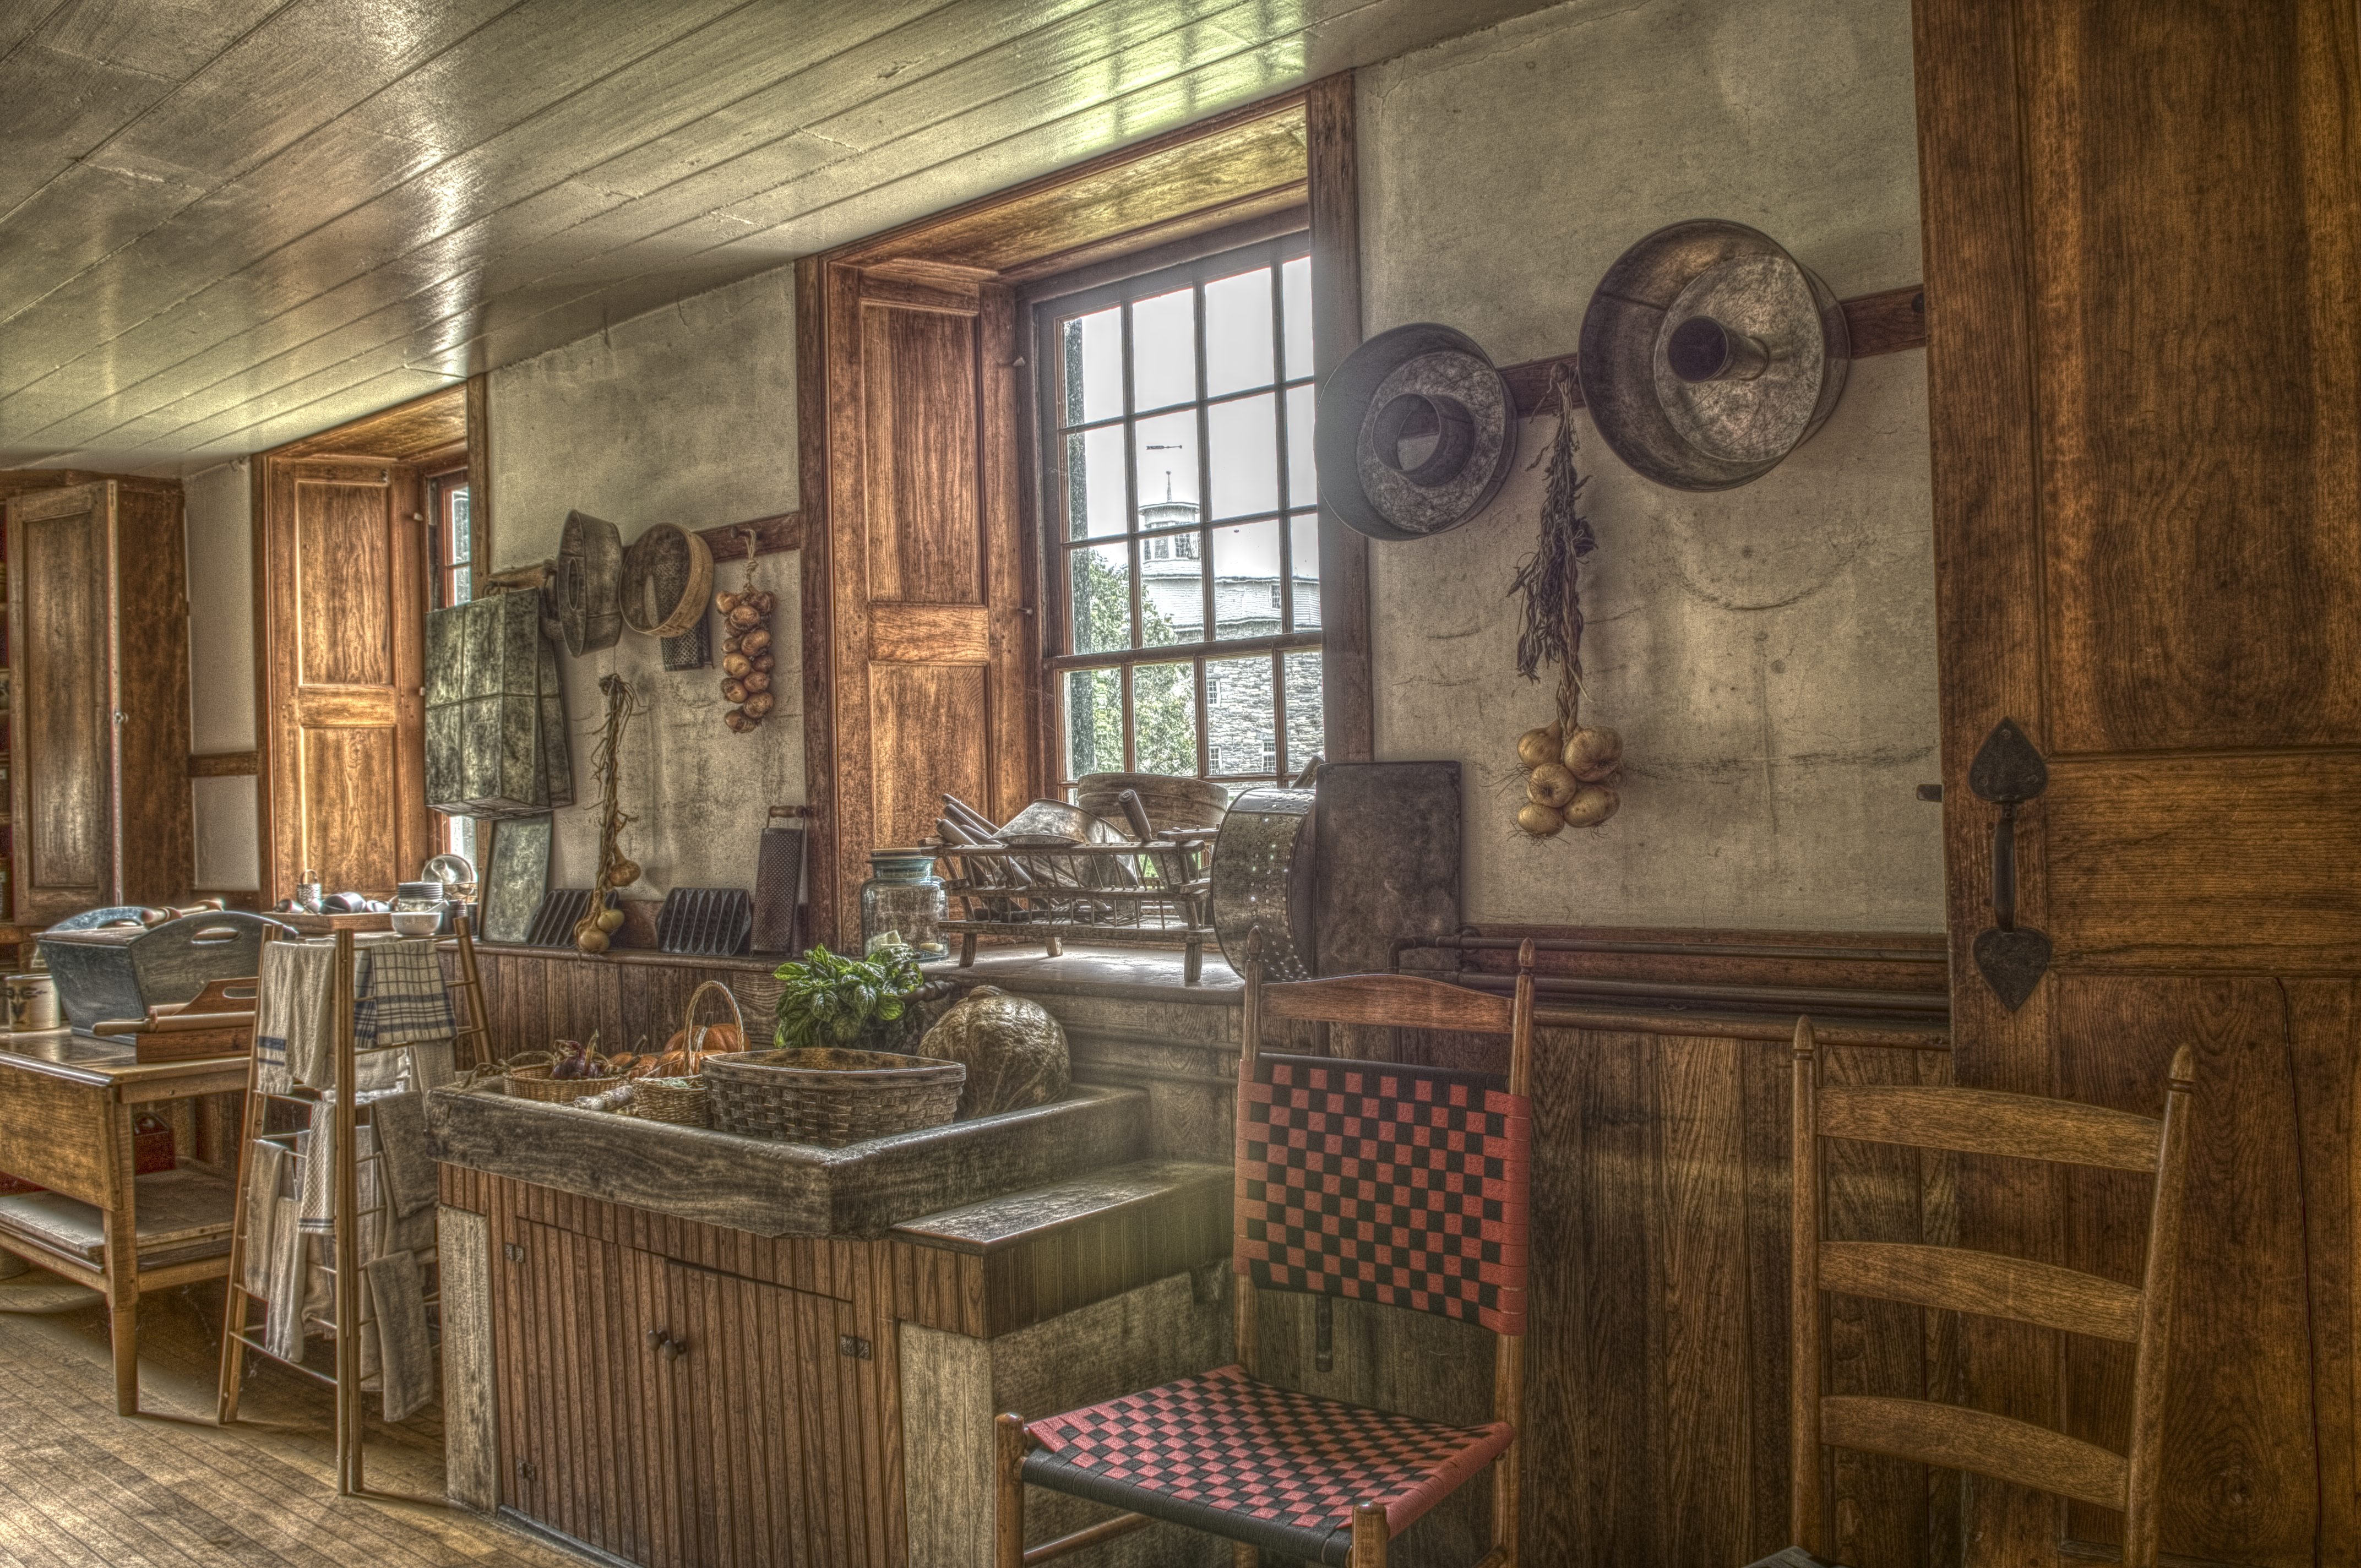
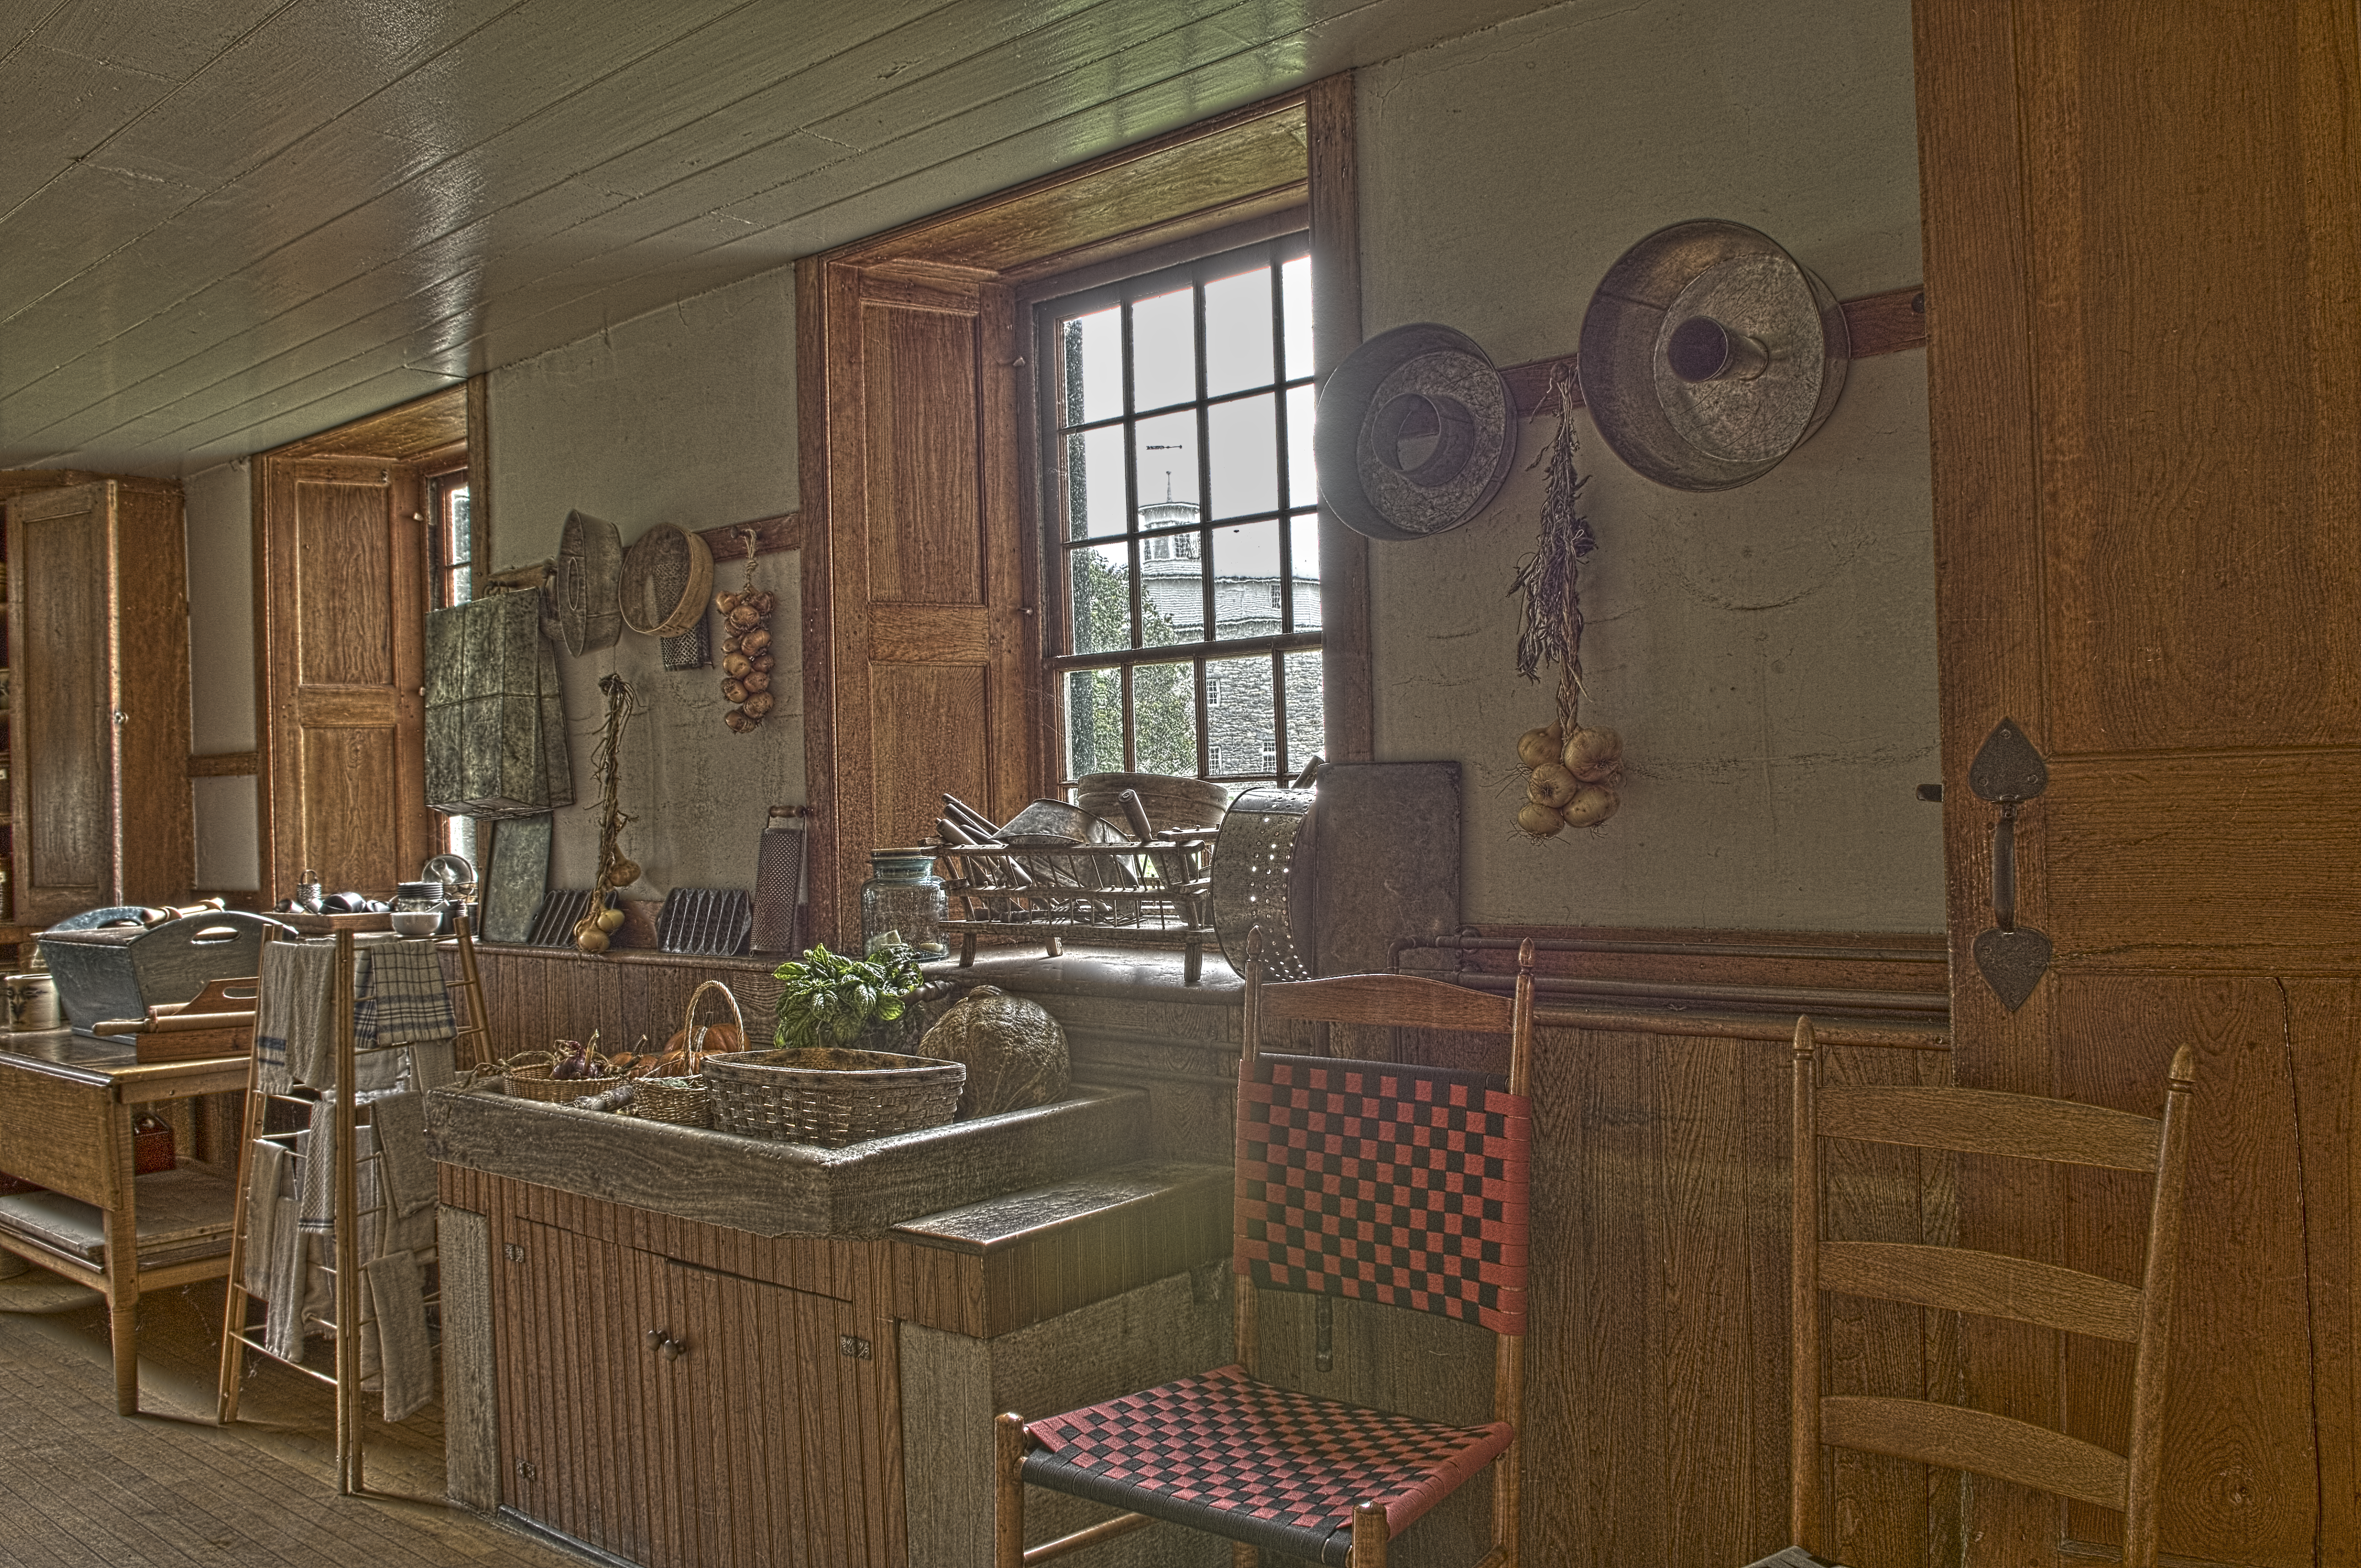
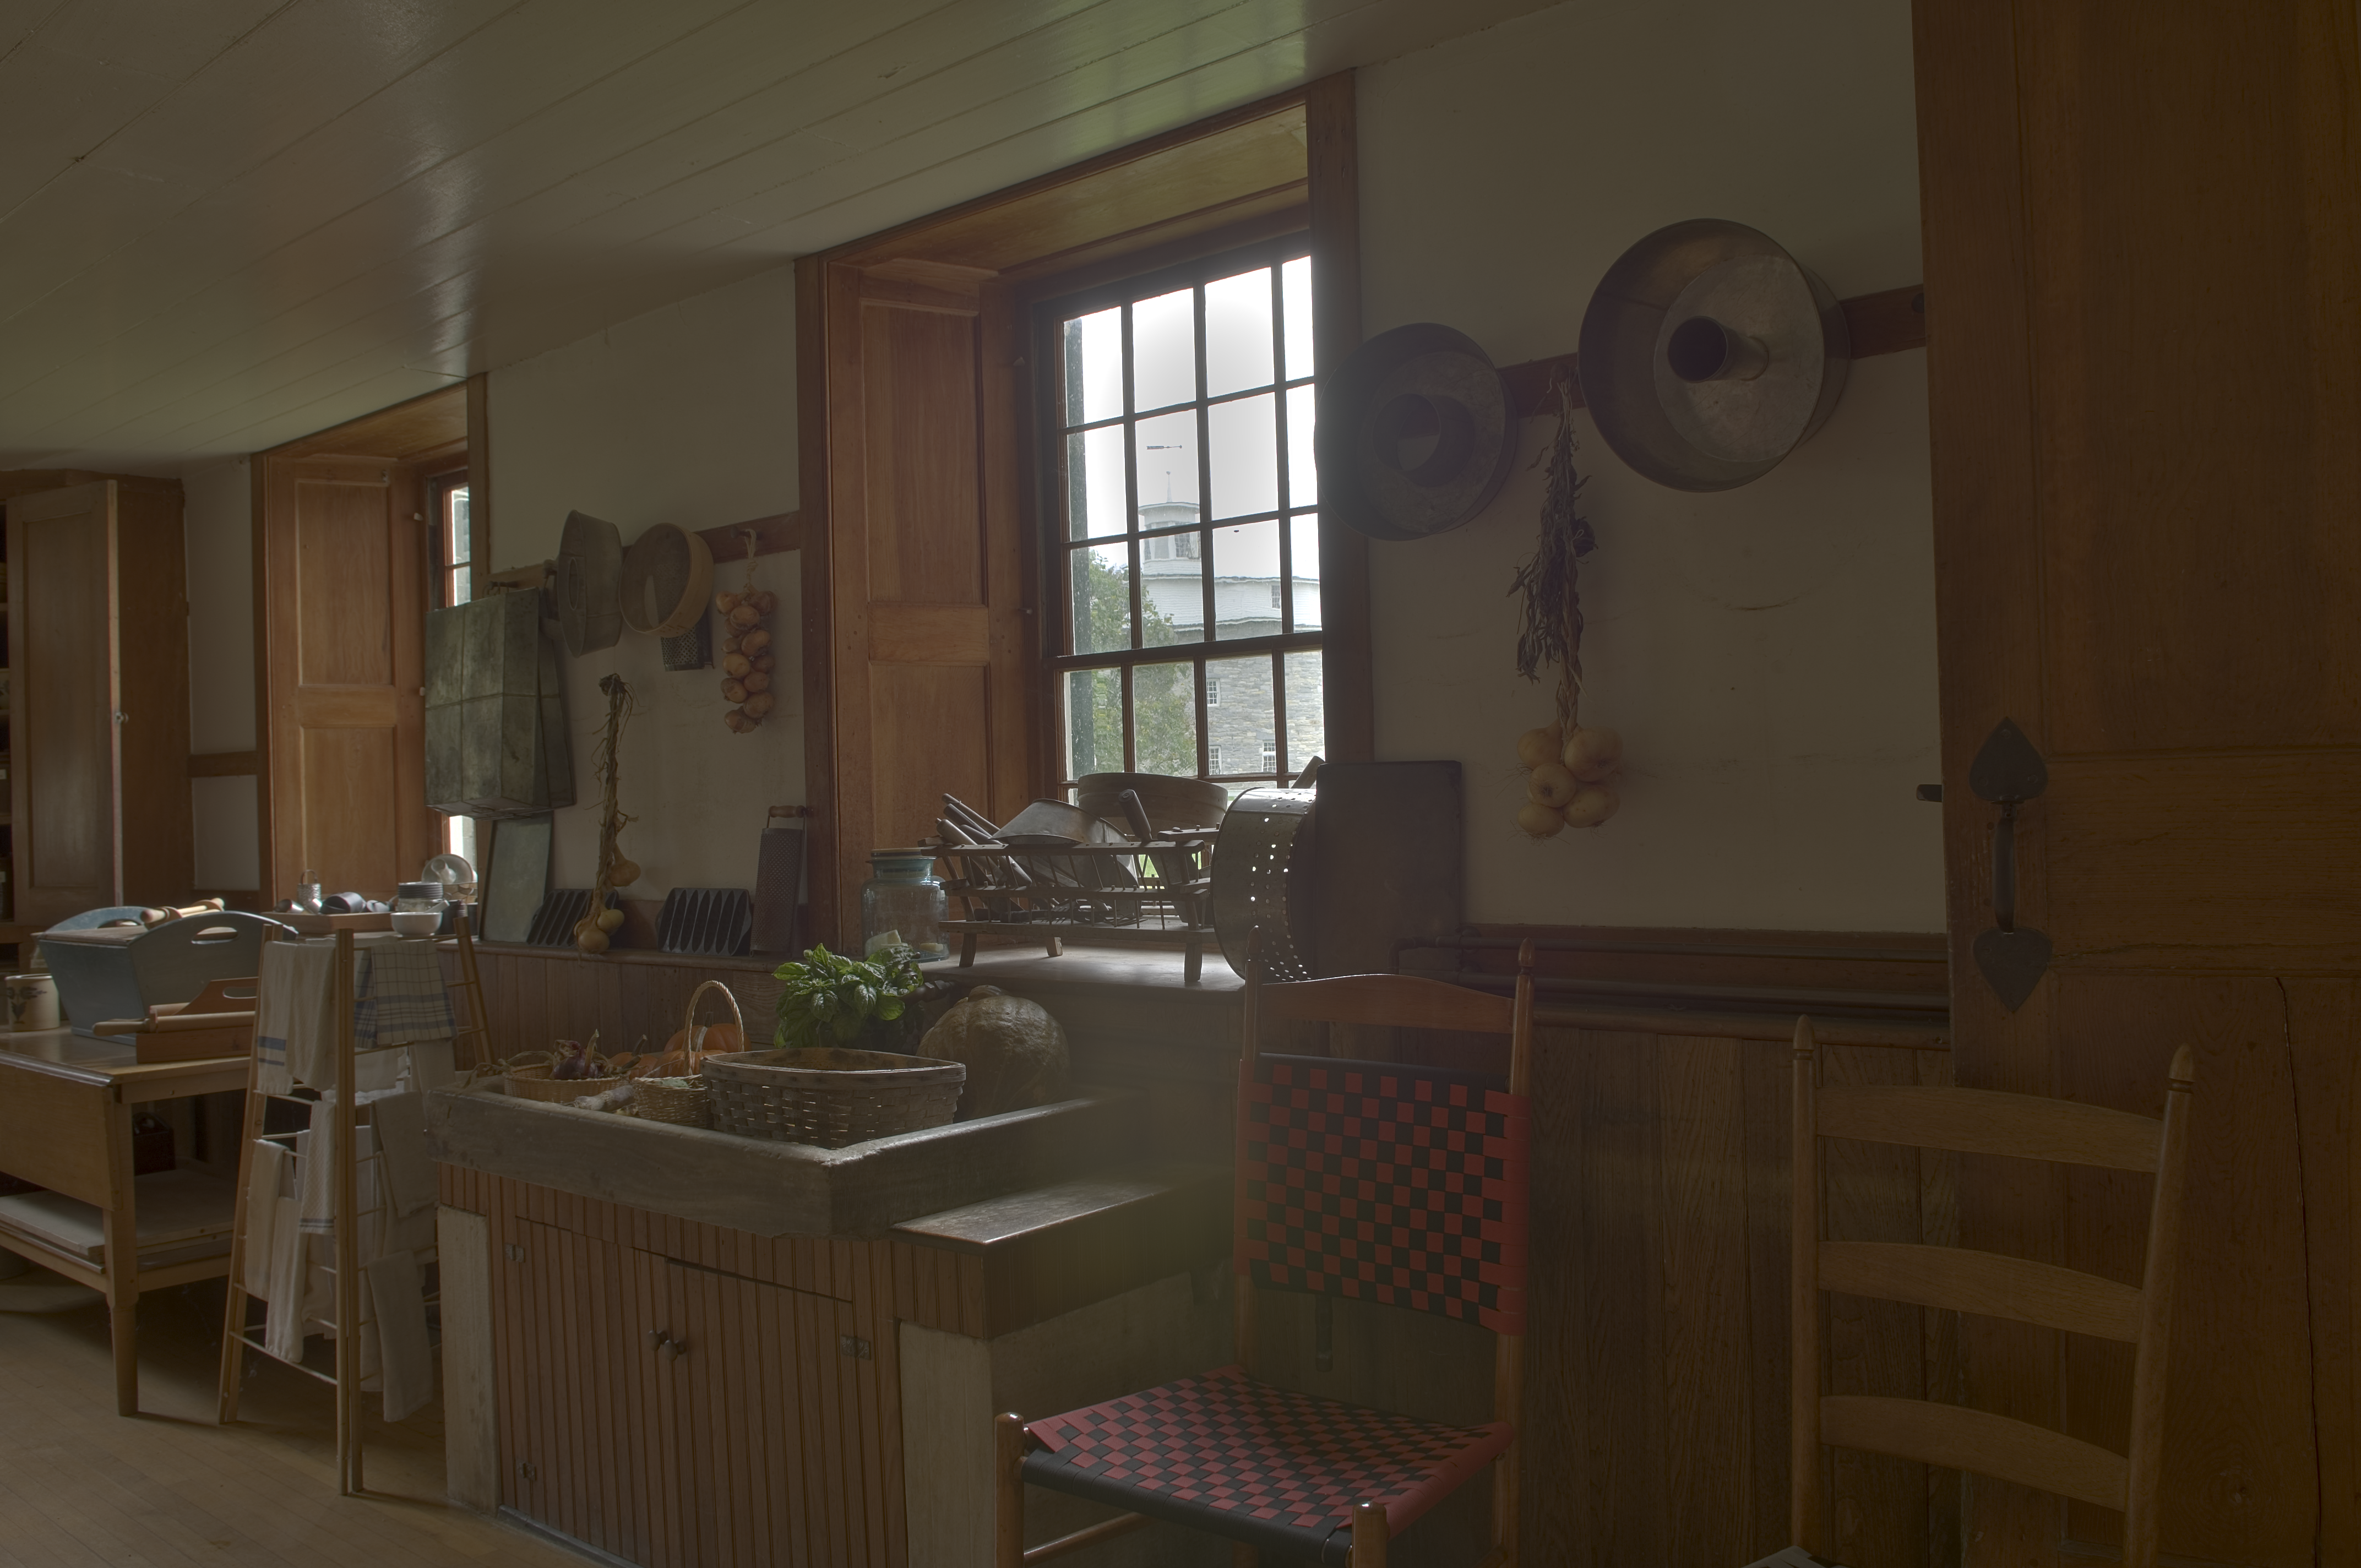
- We present two renditions: a "photorealistic" one without detail enhancement (α=1, β=0, σr=log(2.5)), and an "exaggerated" one with details strongly enhanced (α=0.25, β=0, σr=log(2.5)).
- Depending on your browser, you may need to use the zoom tool to see the images at their actual full resolution.
| photorealistic | exaggerated | |
 |
 |
3. Comparisons to previous work
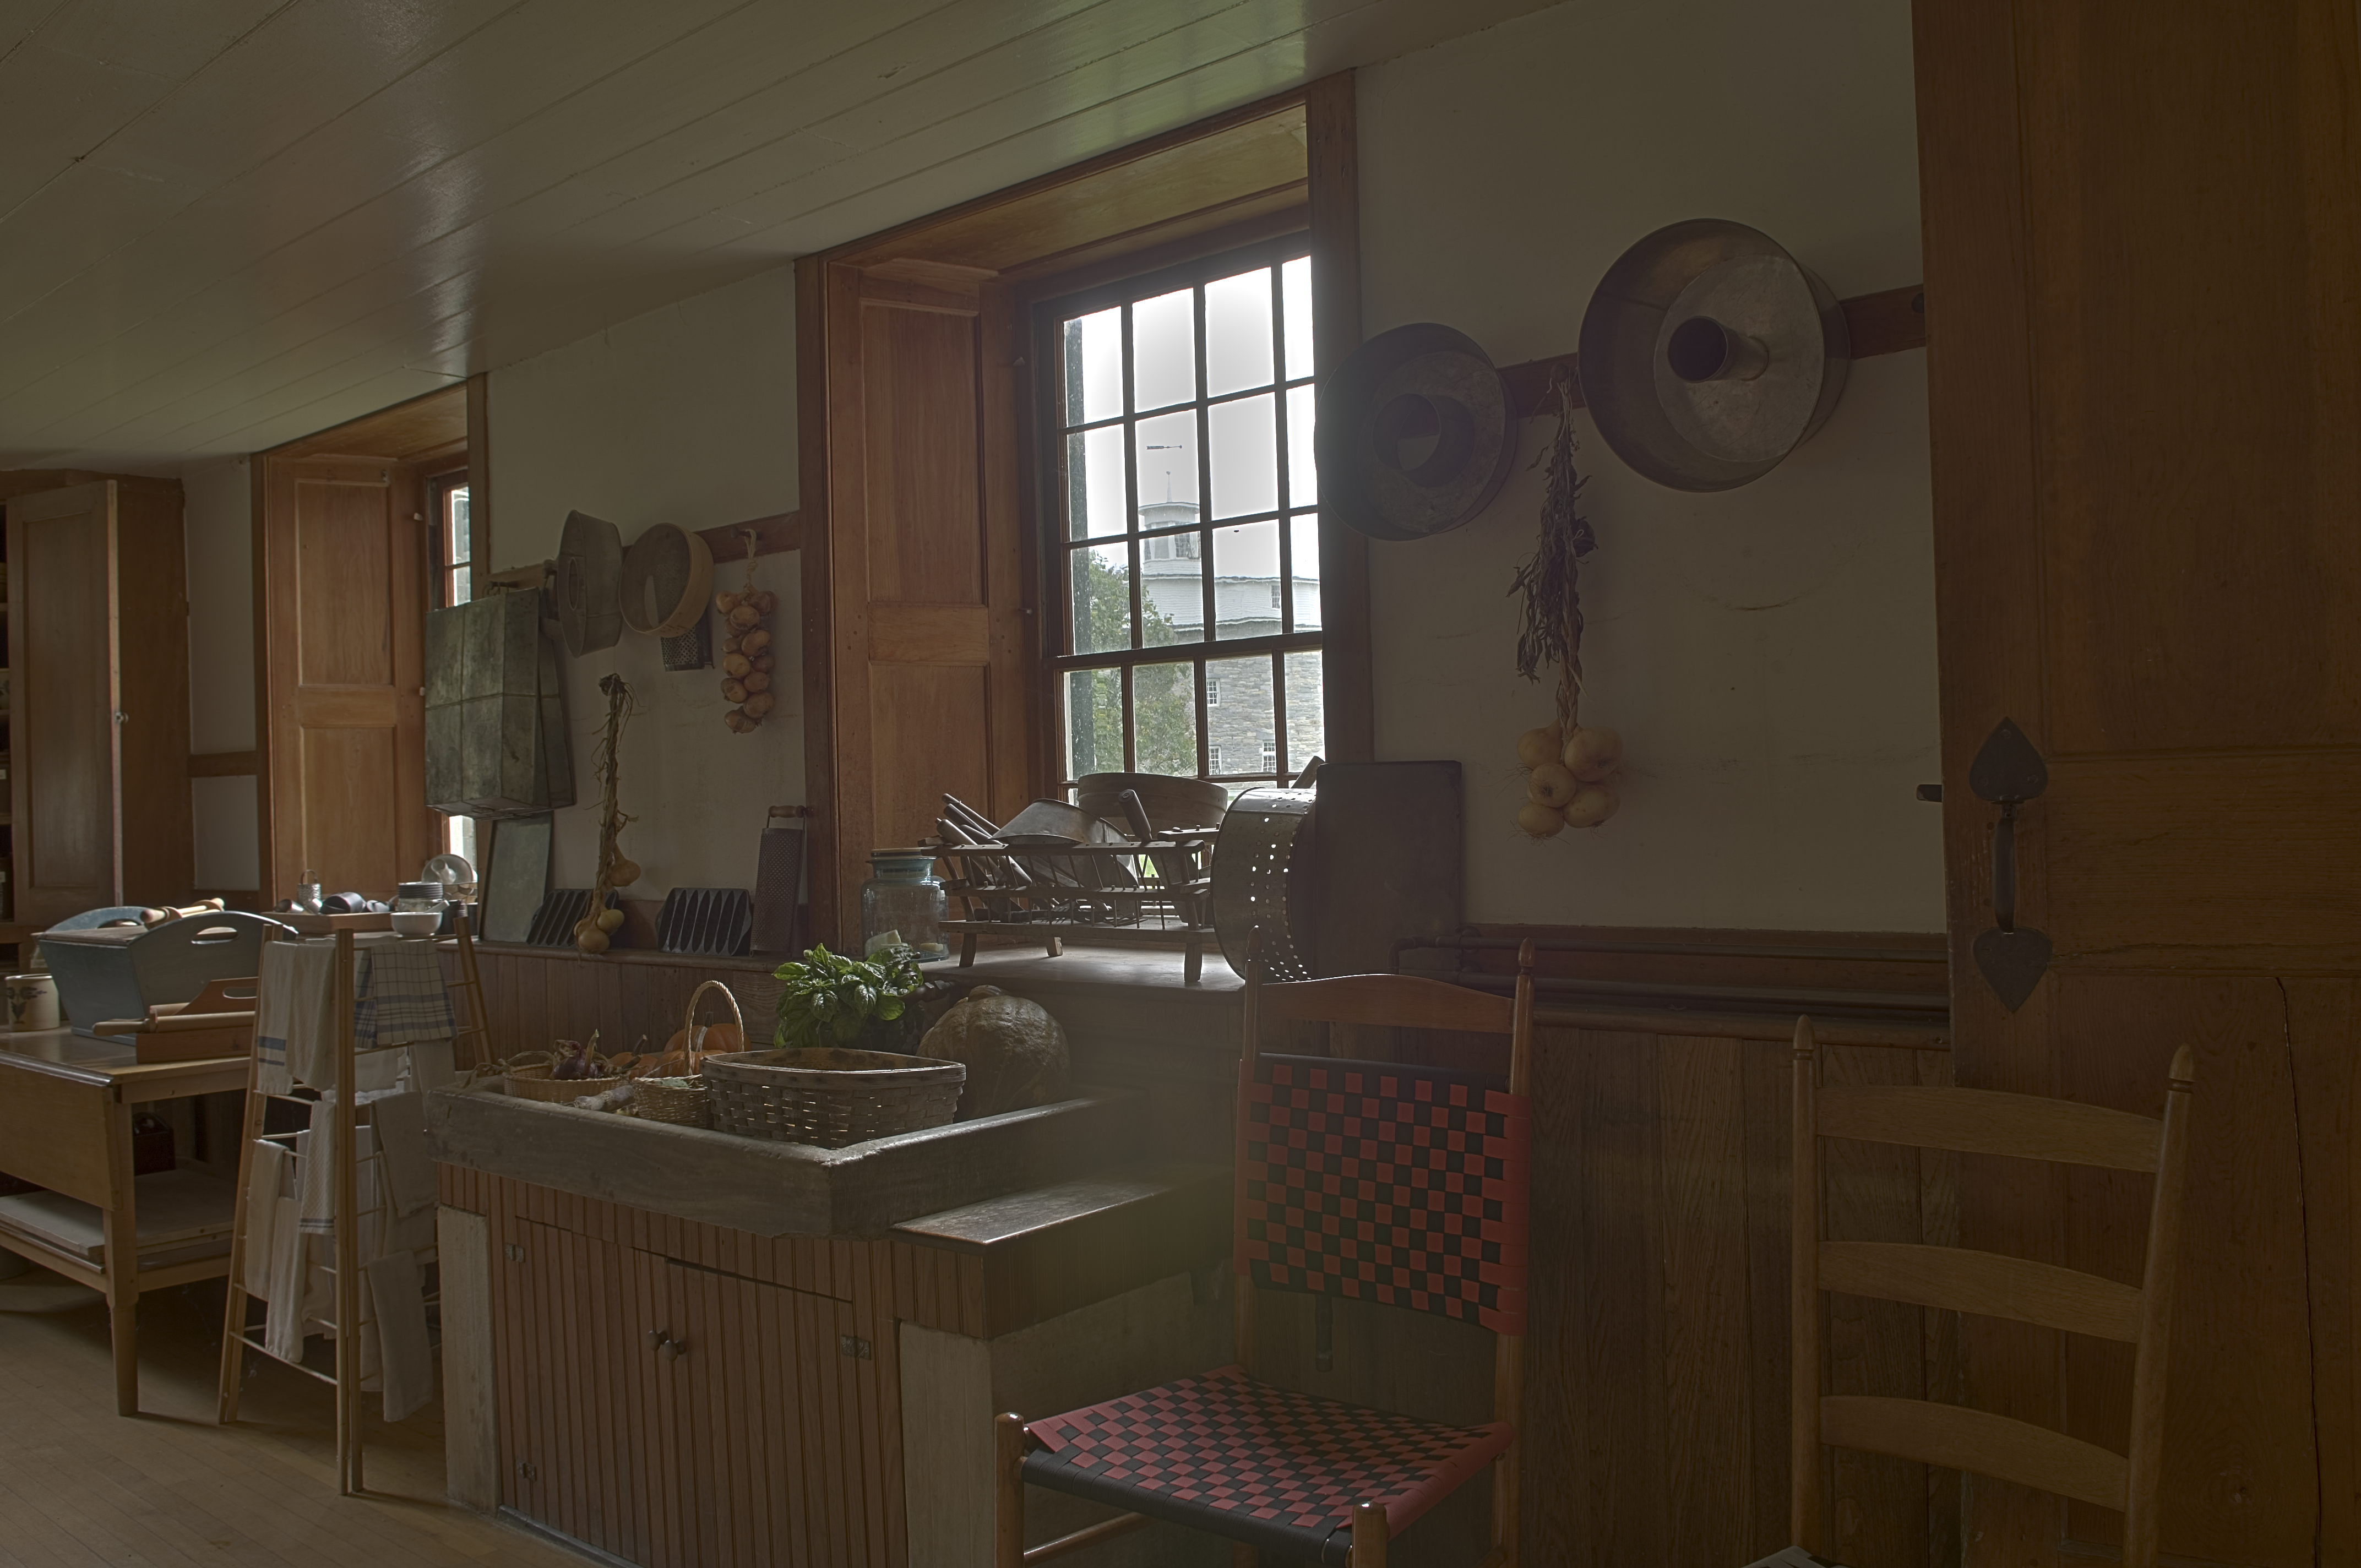
Below we show results produced by two other tone mapping methods using code provided on the authors' webpages. For clearer comparison, we adjusted parameters for post-processing to match the same output dynamic range (100:1 contrast between the 99.5th and 0.5th percentiles) and color saturation (gamma corrected with an exponent of 1/2.2) as implemented by our own method. The treatment of the mid-tones may differ between the methods, which explains why the average brightness may differ.
3.1. Weighted least squares [Farbman et al. 2008]
The following results were produced using the method described in Edge-Preserving Decompositions for Multi-Scale Tone and Detail Manipulation, Farbman et al., ACM SIGGRAPH 2008 (webpage). We contacted the authors and used the fixed parameters that they suggested. We tested both their two-scale and their multi-scale method:
| neutral rendition λ=5, w = [1 0.45] |
exaggerated rendition λ=0.1, w = [6 0.35] |
|
| two-scale method |
 |
 |
| neutral rendition λ=[0.05 2 16] w = [1.2 1.2 1 0.45] |
detailed rendition λ=[0.05 2 16] w = [2 1 0.4 0.25] |
exaggerated rendition λ=[0.05 2 16] w = [6 0.6 0.6 0.12] |
|
| multi-scale method |
 |
 |
 |
This approach performs best for neutral renditions and detail enhancement up to an intermediate level. Exaggerated renditions similar to ours (α=0.25 and β=0) are more challenging. In many cases, especially in its multi-scale version, this method produces satisfying images with a high level of detail. For some images, however, rim halos and edge defects still appear. The code provided by Farbman and colleagues with scripts to generate these comparisons can be downloaded here.
3.2. Smooth gain maps [Li et al. 2005]
The following results were produced using the method described in Compressing and Companding High Dynamic Range Images with Subband Architectures, Li et al., ACM SIGGRAPH 2005 (webpage). The code available on-line includes a post-processing step not described in the original paper to "open up" the shadows. We did not apply this step here, to focus on the basic image processing. We compare to the parameter settings proposed by the authors, using an oversampled Haar wavelet decomposition:
| neutral rendition β = 0.6, αA = 0.2 endrate = 0.6 |
detailed rendition β = 0.6, αA = 0.2 endrate = 0.4 |
|
 |
 |
This approach is best suited for neutral renditions, where it performs well, but the detailed rendition often exhibits halo artifacts. We tried to adjust the parameters to increase the details even further, but could not achieve results similar to our exaggerated rendition without introducing unacceptable halos.