Test image 5

Noise level - 10%


Mouse over the following links to flip between images
By default, our result is shown
MAP estimate - fixed sparse gradient prior, PSNR : 27.974954, SSIM : 0.882245
MAP estimate - adjusted sparse gradient prior, PSNR : 28.450106, SSIM : 0.890692
Degraded image
Original image
Gradient distribution
User study result
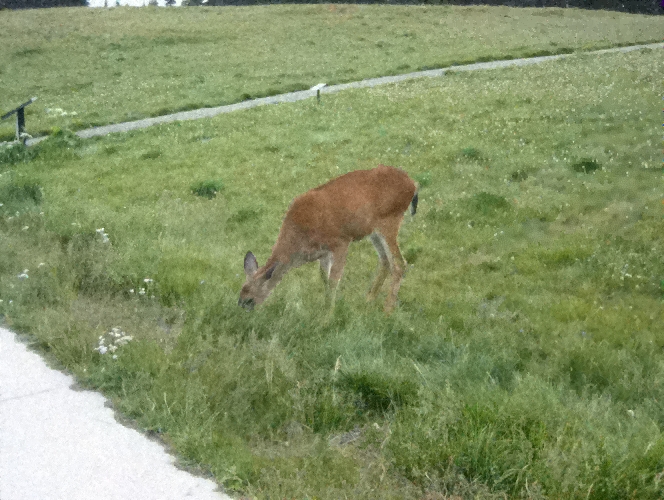
Ours PSNR : 28.209604, SSIM : 0.887000

Mouse over the following links to flip between images
By default, our result is shown
MAP estimate - sparse gradient prior, PSNR : 27.974954, SSIM : 0.882245
MAP estimate - adjusted sparse gradient prior, PSNR : 28.450106, SSIM : 0.890692
Degraded image
Original image
Gradient distribution
User study result
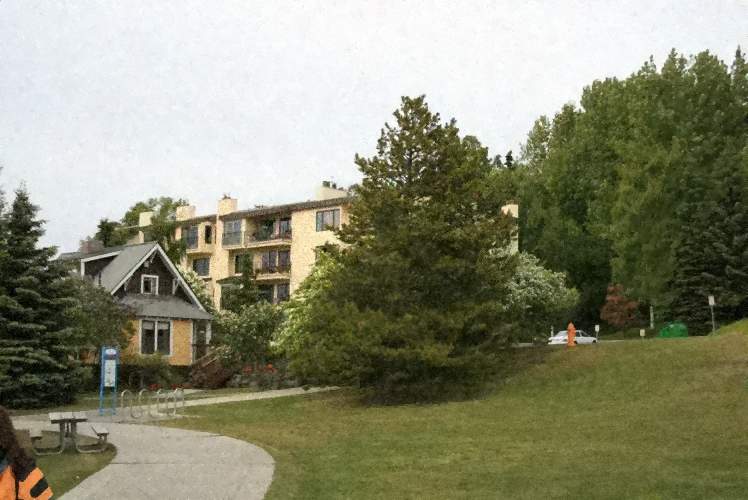


Test image 4

Noise level - 10%


Mouse over the following links to flip between images
By default, our result is shown
MAP estimate - fixed sparse gradient prior, PSNR : 28.981838, SSIM : 0.921257
MAP estimate - adjusted sparse gradient prior, PSNR : 29.827215, SSIM : 0.927511
Degraded image
Original image
Gradient distribution
User study result

Ours PSNR : 29.467678, SSIM : 0.918086

Mouse over the following links to flip between images
By default, our result is shown
MAP estimate - sparse gradient prior, PSNR : 28.981838, SSIM : 0.921257
MAP estimate - adjusted sparse gradient prior, PSNR : 29.827215, SSIM : 0.927511
Degraded image
Original image
Gradient distribution
User study result