Test image 1

Noise level - 15%


Mouse over the following links to flip between images
By default, our result is shown
MAP estimate - fixed sparse gradient prior, PSNR : 24.718750, SSIM : 0.800390
MAP estimate - adjusted sparse gradient prior, PSNR : 25.512837, SSIM : 0.846087
Degraded image
Original image
Gradient distribution
User study result
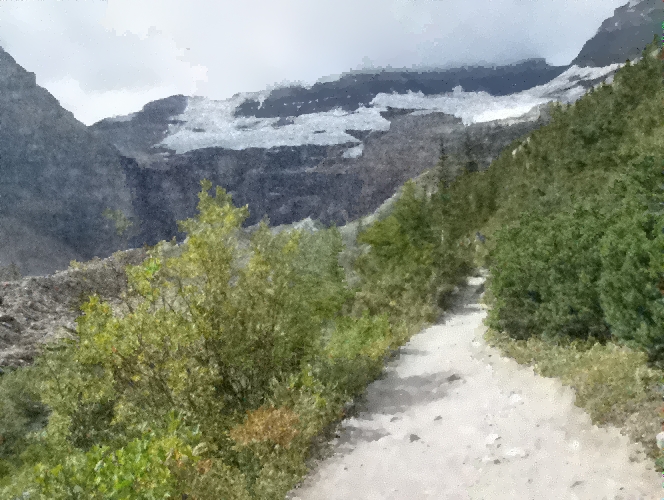
Ours PSNR : 25.365802, SSIM : 0.849680

Mouse over the following links to flip between images
By default, our result is shown
MAP estimate - sparse gradient prior, PSNR : 24.718750, SSIM : 0.800390
MAP estimate - adjusted sparse gradient prior, PSNR : 25.512837, SSIM : 0.846087
Degraded image
Original image
Gradient distribution
User study result
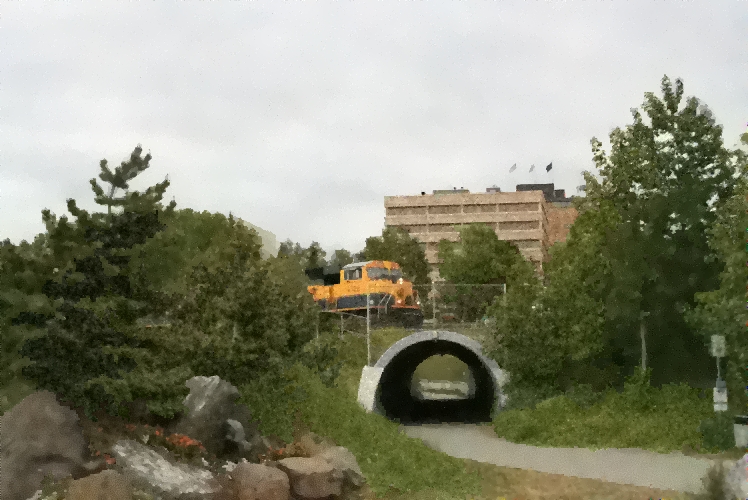


Test image 10

Noise level - 15%


Mouse over the following links to flip between images
By default, our result is shown
MAP estimate - fixed sparse gradient prior, PSNR : 27.089492, SSIM : 0.855720
MAP estimate - adjusted sparse gradient prior, PSNR : 28.068311, SSIM : 0.880989
Degraded image
Original image
Gradient distribution
User study result

Ours PSNR : 27.797247, SSIM : 0.886175

Mouse over the following links to flip between images
By default, our result is shown
MAP estimate - sparse gradient prior, PSNR : 27.089492, SSIM : 0.855720
MAP estimate - adjusted sparse gradient prior, PSNR : 28.068311, SSIM : 0.880989
Degraded image
Original image
Gradient distribution
User study result