Test image 2

Noise level - 5%


Mouse over the following links to flip between images
By default, our result is shown
MAP estimate - fixed sparse gradient prior, PSNR : 30.217562, SSIM : 0.967221
MAP estimate - adjusted sparse gradient prior, PSNR : 31.255957, SSIM : 0.972021
Degraded image
Original image
Gradient distribution
User study result
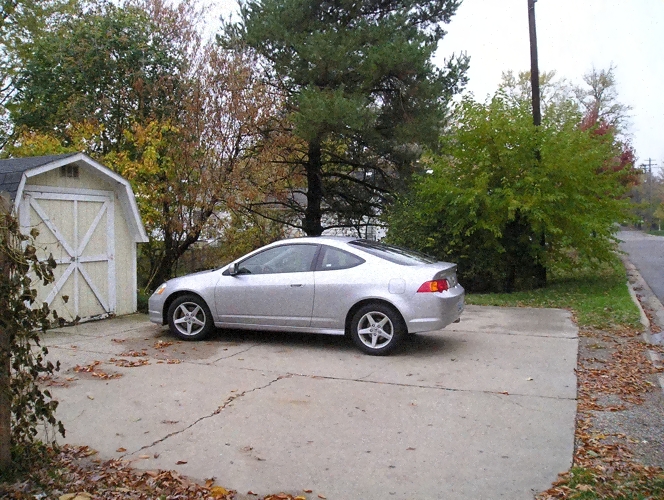
Ours PSNR : 31.097357, SSIM : 0.970591

Mouse over the following links to flip between images
By default, our result is shown
MAP estimate - sparse gradient prior, PSNR : 30.217562, SSIM : 0.967221
MAP estimate - adjusted sparse gradient prior, PSNR : 31.255957, SSIM : 0.972021
Degraded image
Original image
Gradient distribution
User study result
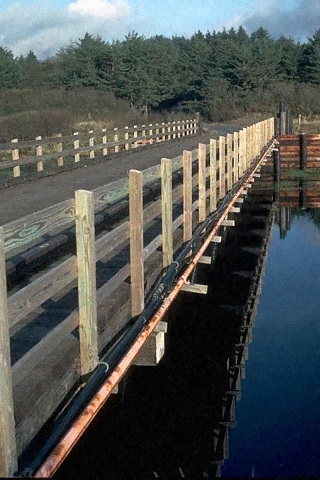


Test image 11

Noise level - 5%


Mouse over the following links to flip between images
By default, our result is shown
MAP estimate - fixed sparse gradient prior, PSNR : 31.296197, SSIM : 0.892223
MAP estimate - adjusted sparse gradient prior, PSNR : 33.035814, SSIM : 0.934537
Degraded image
Original image
Gradient distribution
User study result

Ours PSNR : 32.257431, SSIM : 0.900854

Mouse over the following links to flip between images
By default, our result is shown
MAP estimate - sparse gradient prior, PSNR : 31.296197, SSIM : 0.892223
MAP estimate - adjusted sparse gradient prior, PSNR : 33.035814, SSIM : 0.934537
Degraded image
Original image
Gradient distribution
User study result