Next: Emulab Experiment Up: Results Previous: Workload Shift
Some workloads are heavily skewed and several of the algorithms were
able to support up to ![]() . We wanted to examine how much
skew they might support. To test this, we used the synthetic 60
minute average lifetime trace and the capacity distribution from the
trace as we varied
. We wanted to examine how much
skew they might support. To test this, we used the synthetic 60
minute average lifetime trace and the capacity distribution from the
trace as we varied ![]() . As before, we ran each algorithm with each
node initiating 10 queries per second on average.
. As before, we ran each algorithm with each
node initiating 10 queries per second on average.
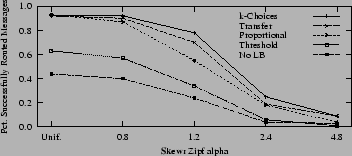
We plot the results in Figure 16.
They show that none of the algorithms can support an extremely skewed
workload, e.g., one where the top destination is almost ![]() that
of the next rank. Not only do the algorithms decline in their average
success rates, but they also all become less stable. For example, the
standard deviation of success rates sampled over time for k-Choices at uniform is
that
of the next rank. Not only do the algorithms decline in their average
success rates, but they also all become less stable. For example, the
standard deviation of success rates sampled over time for k-Choices at uniform is ![]() and at
and at
![]() it is
it is ![]() . To see if increasing
. To see if increasing ![]() had an impact
at high skew, we ran k-Choices with
had an impact
at high skew, we ran k-Choices with ![]() . We found that it
performed better (at
. We found that it
performed better (at ![]() ) than
) than ![]() , but also exhibited high variance.
, but also exhibited high variance.
Jonathan Ledlie 2006-01-06