Ranking Potential Customers based on GroupEnsemble
method
The ExceedTech Team
1. Background understanding
Both of the products have been on the
market for many years, however overlap between these two customer bases is
currently very small. And the reason of such a phenomenon
remained unknown. Besides, the provided dataset just gave
us the information about whether customers have opened a home loan with the
company within 12 months after opening the credit card. It would just happen
that the distribution of potential customers being different from distribution
of customers who open a home loan account in the first year. No assertion of
0-label samples being beyond the group of potential customers could be made.
Hence it would be appropriate to treat these samples as unlabeled ones.
However, 1-label samples represent customers who have already open a home loan
account. So they are treated as strong positive samples and should be ranked in top positions.
The task is to produce a score of the propensity to
take up a home loan with the company. Since no restrictions on the metric of
such propensity, it may be appropriate to treat the problem as a ranking problem,
since a ranking may be more intuitive than a unknown-metric-score. For example,
the company may just choose the top-100 samples as the most probable clients to
advertise home loan according to their resources. Besides, due to the dataset
being imbalanced, using the area under ROC curve, namely AUC, to measure the
efficiency of the model would be better than widely used error calculations.
And ranking method suits it well as AUC could be determined once the ranking is
known.
From the statistic of dataset, nearly 90% samples
suffer missing values on some attributions. Such a situation may cause some
numerical learners such as Neutral Networks, SVM being incapable of handling
this situation. We choose tree model instead, due to the capacity of such models handling missing values.
2. Preprocessing
We found some
problems in the original dataset:
ˇ¤
Attribution
B_DEF_PAID_L
ˇ¤
Though
in statement of Update 9, all attributes with bureau variables, which were
begun with ˇ®BˇŻ, special value 98 and 99 could be treated as missing values,
they are still different, since 99 indicated the customer didnˇŻt go to bureau,
98 indicated positive however. Thus they may be treated separately.
ˇ¤
For
attributes of CHQ_ACCT_IND, SAVE_ACCT_IND, AMEX_CARD, DINERS_CARD, VISA_CARD,
MASTER_CARD, RETAIL_CARDS, namely account attributes, invalid values existed
and should be corrected into valid ones.
ˇ¤
All
missing values are simply blank, which is incompatible with WEKAˇŻs data format.
The supplied dataset went through following
series of operations:
ˇ¤
Kick
B_DEF_PAID_L
ˇ¤
Add an
attribute FlagNotBureau in each sample. For all samples with value
ˇ¤
Transfer
all values of account attributes into valid values: for missing values,
transfer them to ˇ®XˇŻ; for all values besides ˇ®NˇŻ, ˇ®YˇŻ, ˇ®XˇŻ, such as ˇ®
ˇ¤
Place
a missing value flag ˇ®?ˇŻ to all blanks in the dataset in order to make the
format compatible to WEKA.
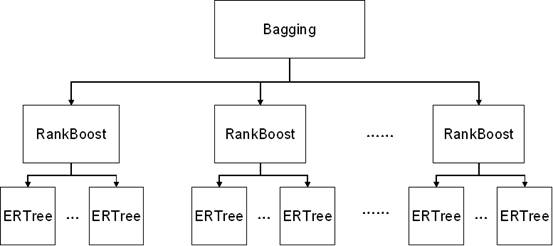
3. Model Description
To handle the difficulties above, we introduce the 3-level
Regression model. In level 1, ERTree(Expending Regression Tree) is applied to
expand the probability distribution from one year to overall. Then in level 2,
a meta-learning method, RankBoost([2]), is used for optimize the AUC value of
the model in order to achieve the best ranking result. It is also helpful in
the imbalance case. Finally, in the third level, simple grouping and bagging
method are used in dealing with the imbalance problem and reduce the time
complexity of the model.
Figure 1
Framework of the model
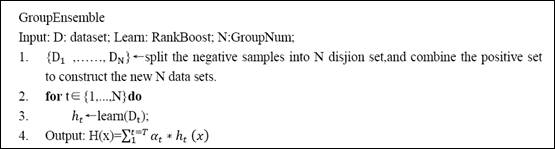
4. GroupEnsemble Model
GroupEnsemble is a
meta-learning method (pseudo-code shown in Table 1), which is respectively the basis of sub model Rankboost in the level2 and
ERTree in the level1.
The original
purpose of GroupEnsemble is to tackle seriously imbalanced problems and reduce the time consuming in training process. Many learning
algorithm is designed for optimizing the accuracy, which would have a poor performance in the imbalanced situations. Take this problem into
account, if we classify all samples as negative class, it can achieve about 98%
correctness, which is meaningless to the problem. One approach to imbalanced problems is resampling. Here we use grouping method to divide negative samples
into several equal-size sets, and then combine the positive sample set with
each of them. For instance, if 40 groups is applied in 40700 samples, every new
dataset will contain 700 positives and 1000 negatives, so that each dataset
seems much more balanced than before. In respect of time consuming,
split datasets can be used to train model parallel. Even if in single-CPU computers, time of training could
also be reduced on the ground
that
![]()
Where k is group number, n is scale of
dataset.
Table 1 GroupEnsemble Algorithm
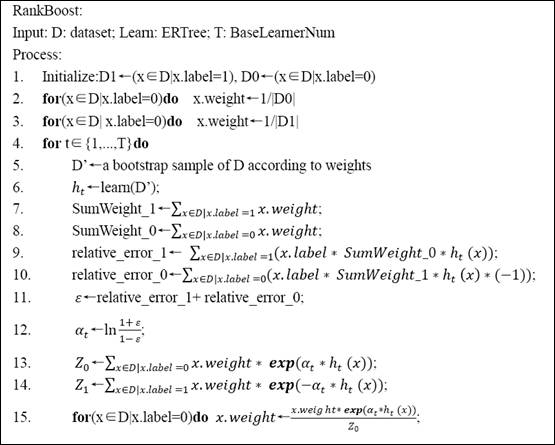
5. RankBoost Algorithm
As what was mentioned in
section 1, the task of finding the potential customers can be regarded as
a ranking problem, which is more helpful for the company decision makers to
decide the amount of resources to spend on
boosting them to be the real
customers according to the rank.
The original idea of RankBoost algorithm is to
ensemble the weak learners to achieve the best ranking result. Implementation
of the idea is carried out by resampling methods. Thus it would be pretty
suitable for the weak learners which ERTree, the next-level learner, is
incapable to handle. Besides, it uses a resample method to improve ranking of
the weak positive sample, which may also be effective to imbalanced problems.
The pseudo code of RankBoost is shown in Table 2. It shows that
Rankboost reweight every sample differently from AdaBoost which is proved to be
more effective and have better generalized performance in [2]
Table 2.
RankBoost Algorithm
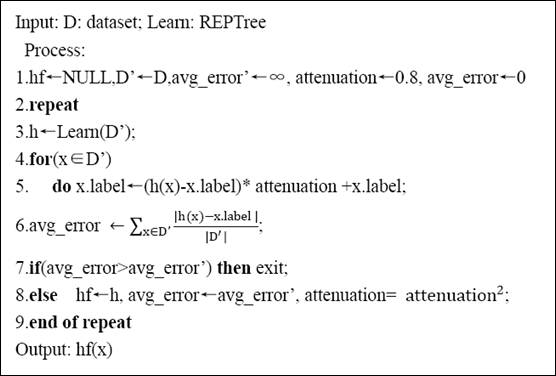
6. Expanding Regression Tree
As analyzed above, the concerned task is with
time-variant target distribution, which can hardly be addressed by a pure
decision tree algorithm such as C4.5. Therefore, we propose the ERTree
(Expanding Regression Tree) algorithm here, as shown in Table 3. ERTree is based
on REPTree in weka. It gradually enhances the score of the 0-label samples,
meanwhile, update the score of 1-labels. As a result, the rank of positive
samples and negative samples will both be updated: the weak positives will go
down and the weak negatives will go up. These behaviors of ERTree is due to
REPTree taking the average value of incidents in a leaf as the prediction value
of that leaf. To make the relabel
process more reasonable, we introduce a parameter, attenuation, in step 5, as
follows:
x.labelˇű (h(x)-x.label)* attenuation +x.label
For instance, supposing that attenuation equals 0.2,
and the labels of a leave are 1,0,0,0,0, then we know the average value of that
leaf is 0.2, so h(x)=0.2 for each x in that leaf. According to step 5, origin
1-label samples will be relabeled to (0.2-1)*0.2+1=0.84, similarly, other
origin-0-label samples will be relabeled to 0.04. And refer to step8, the
attenuation will be updated to its square value, which make the effect in each iterations smaller gradually. Therefore,
if a leaf contains many high-score samples, the low-score samples will be
enhanced quickly during the iteraitons.
Another great advantage of using REPTree as a base
model lies in its convenience of handling missing value samples in the tree
model. Besides, attribution selection procedure would be no longer important
since the best attributes for partition have been selected during the process
of tree building and pruning.
However, ERTree can only expand the samples around the
strong positive clusters, which is useless in the situation that positive
sample scattering in the strong negative samples cluster. This disadvantage
would be solved in the RankBoost meta-algorithm of the upper level
Table 3 Expand
Regression Tree Algorithm
7. Parameter Selection
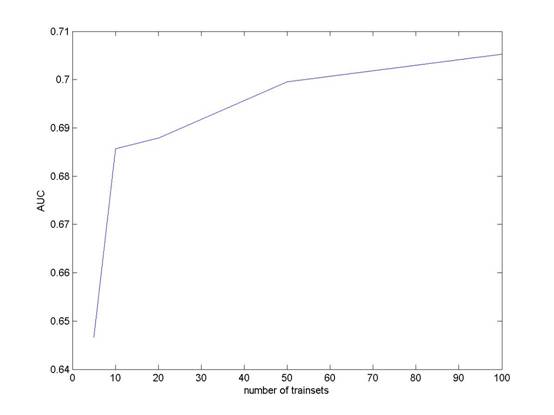
7.1. Group Number
We try several
different values of Group Number in level3,
corresponding to different proportion of positive instances, and
record the AUC value of 7 folds cross-validation.
Table 4
Comparisons with different Group Numbers
|
Group Number(positive
percentage) |
Test Set |
attenuation |
Base Learner Num |
AUC |
|
600+3440Ł¬ 10groupŁ¬(14.8%) |
100+5600 |
0.8 |
10 |
0.685659 |
|
600+1720 , 50 groupŁ¬(25.8%) |
0.699514 |
|||
|
600+344 , 100 groupŁ¬(63.7%) |
0.705255 |
The
result (in the table) shows that the AUC value increases with the portion of
positive growing up. This indicates that the patterns of potential customers
are so weak that more positive instances are needed to extract the patterns.
Figure 2. AUC values with different Group Numbers
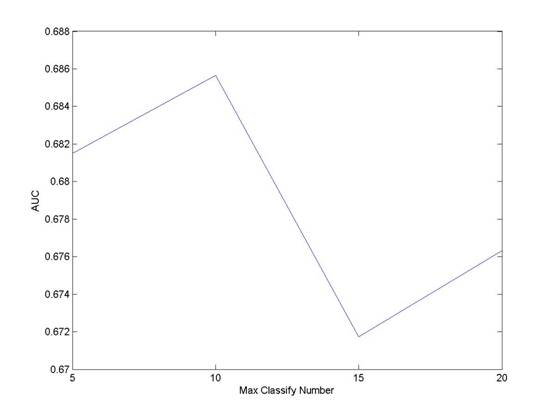
7.2. Base Learner Num
Base
Learner Number is the parameter in level2, which indicate that the number of
ERTree in the schema of RankBoost. As a common sense, the more weak learners
are in the boosting schema, the better performance the learner would be. But
the point wasnˇŻt confirmed in the experiment. :
Table 5
Comparisons with different numbers of Base Learners
|
Group Number |
Testing Set |
Attenuation |
Base
Learner Num |
AUC |
|
600+3440, 10 groups, (14.8%) |
100+5600 |
0.8 |
5 |
0.681509 |
|
10 |
0.685659 |
|||
|
15 |
0.671741 |
|||
|
20 |
0.676313 |
The
AUC value varies from different BaseLearnerNum. However itˇŻs not true that more
Base Learners leads to better results. Thus we select BaseLearnerNum = 10 to be
the parameter in our final, which balances time-consuming and accuracy.
Figure 3 AUC values with different numbers
of
Base Learners
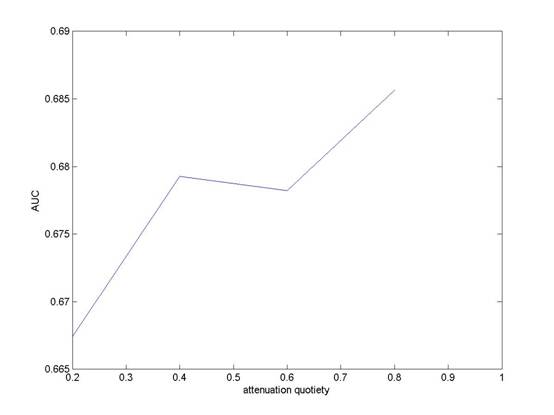
7.3. Attenuation
Attenuation
is the parameter in ERTree learning. As mentioned in section 3, the functionality
of attenuation is to reduce the affect of the former iterations and meanwhile,
maintain the rank in the suitable scale. It can be predicted that the
attenuation approach to 1, the dataset will become more unstable during the
iterations; on the other side, if attenuation approach to 0, the dataset will
little change and the ERTree is just building as the REPTree.
Table 6
Comparisons with different Attenuations
|
Group Number |
Testing Set |
Attenuation |
Base Learner Num |
AUC |
|
600+3440, 10 groups, divided by sequence |
100+5600 |
0.2 |
10 |
0.667402 |
|
0.4 |
0.679264 |
|||
|
0.6 |
0.678211 |
|||
|
0.8 |
0.685659 |
|||
|
1.0 |
0.667402 |
Figure 4 AUC values with different Attenuations
7.4. Model Evaluation:
In the
final model, the group number is 100, BaseLearnerNum is 10, Attenuation is 0.8.
The experiments for the comparison with RankBoost-J48, RankBoost-ERTree,
Adaboost-J48 were done by using 7-folds cross-validation, the results are
following:
Table 7
Comparisons with different Models
|
Model |
AUC |
|
GroupEnsemble |
0.72656 |
|
RankBoost-ERTree |
0.69814 |
|
RankBoost -J48 |
0.60356 |
|
Adaboost-J48 |
0.53667 |
It
shows that the AUC values of the four Learners are not high,, but the
GroupEnsemble performs respectively better than others.
7.5. Model Insight
Though
AUC value doesnˇŻt have a very good performance, some samples with lowest ranks
could be treated with strong negative samples. Choose the last 700 as strong
negative samples and form up a dataset by combining them with 700 label-1
samples as strong positive. Some rules could be obtained by JRip Rules Learner:
Figure 5 Results of JRip Rules on the newly
combined dataset
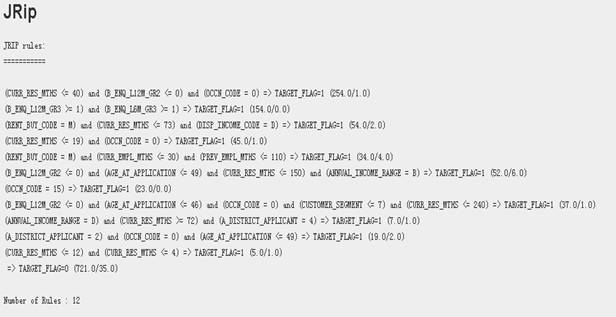
Take
first and second rule for example.
First
rule states that when total number of months at Current Residence <= 40,
Number of Bureau Enquiries in Loans for last 12 months for loans no more than 0
and CCN Occupation code = 0, then the sampleˇŻs target flag is probably 1. Such
a rule makes sense: those who havenˇŻt lived in the area for long may not have a
home yet. And the reason they didnˇŻt inquiry about loans may be that they have
accumulated some amount of cashes for buying a house. Both of the conditions
makes the customer a potential home loan buyer.
Second
states that if the Number of Bureau Enquiries in the last 12 months for
Mortgages have been more than 1, target flag of the sample would probably be 1
as well. This rule makes sense as well as the above one: a customer have
inquired about policy for mortgages right for a home loan.
7. Discussion
We
have proposed a 3-level ranking model, GroupEnsemble model. Although only 0.7 AUC
value could be acquired in the 7-folds cross-validation, it is still worth to point out that the
potential customer may have various feature which is hard to locate exactly only with 700
samples. Our experiments also shows that ERTree have better performance than
traditional tree methods such as J
A much more efficient approach would be carrying
out more detailed and pertinent surveys to the pool of users who were offered
no home loan services at first however bought it later on. More features about
this group of people could be observed in it.
8.
Download
9. References
[1]
[2] Zhou, Z.-H. , Liu, X.-Y. :Training cost-sensitive neural networks
with methods addressing the class imbalance problem. IEEE Transactions on
Knowledge and Data, Engineering 18 (1) (2006) 63¨C77.
[3] [LeCun et al. 2006]: A Tutorial on Energy-Based Learning (in Bakir
et al. (eds) "Predicting Strutured Data", MIT Press 2006):
[4] Yoav Freund, Raj Iyer, Robert E. Schapire, Yoram Singer: An
Efficient Boosting Algorithm for Combining Preferences
[5] Corinna Cortes and Mehryar Mohri, 2006: AUC Optimization vs. Error
Rate Minimization
[6] Kaan Ataman, W. Nick Street Member, IEEE and YiZhang, 2006: Learning
to Rank by Maximizing AUC with Linear Programming