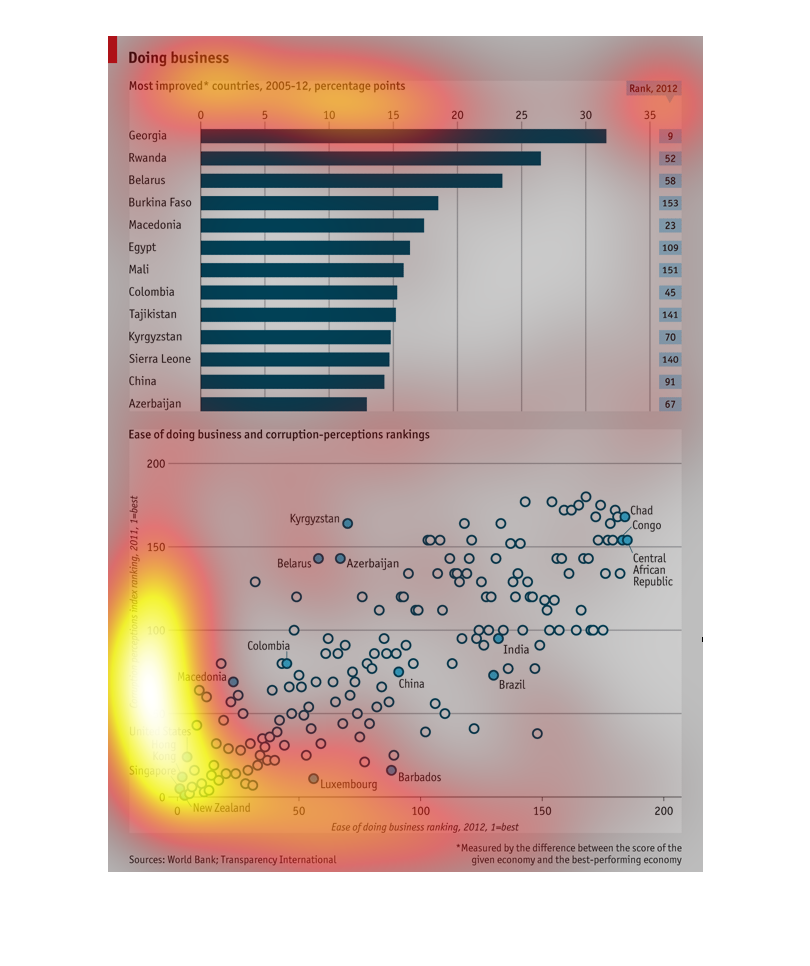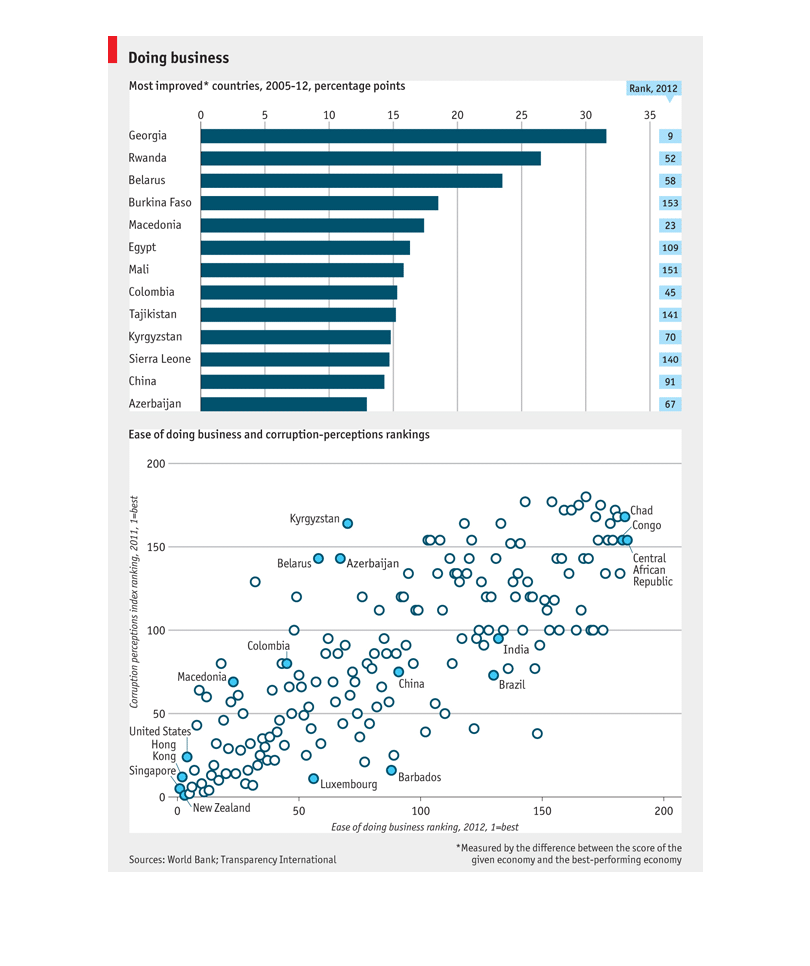
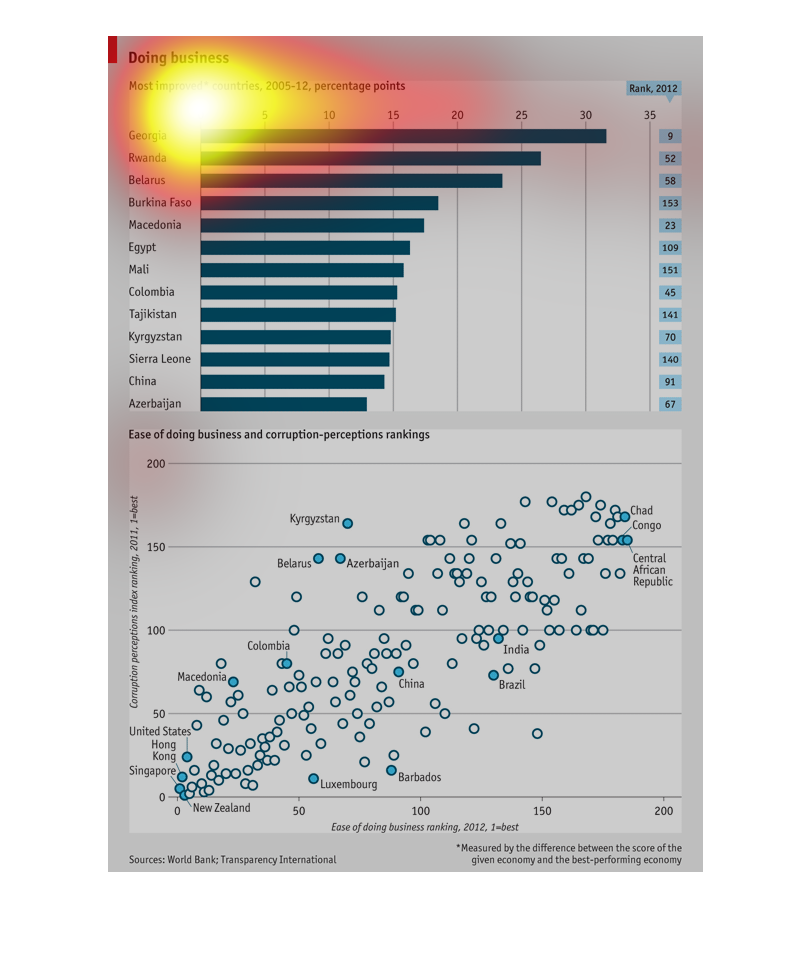
This chart shows the most improved countries in doing business from 2005 to 2012. It shows
that Georgia improved the most while Azerbaijan improved the least.
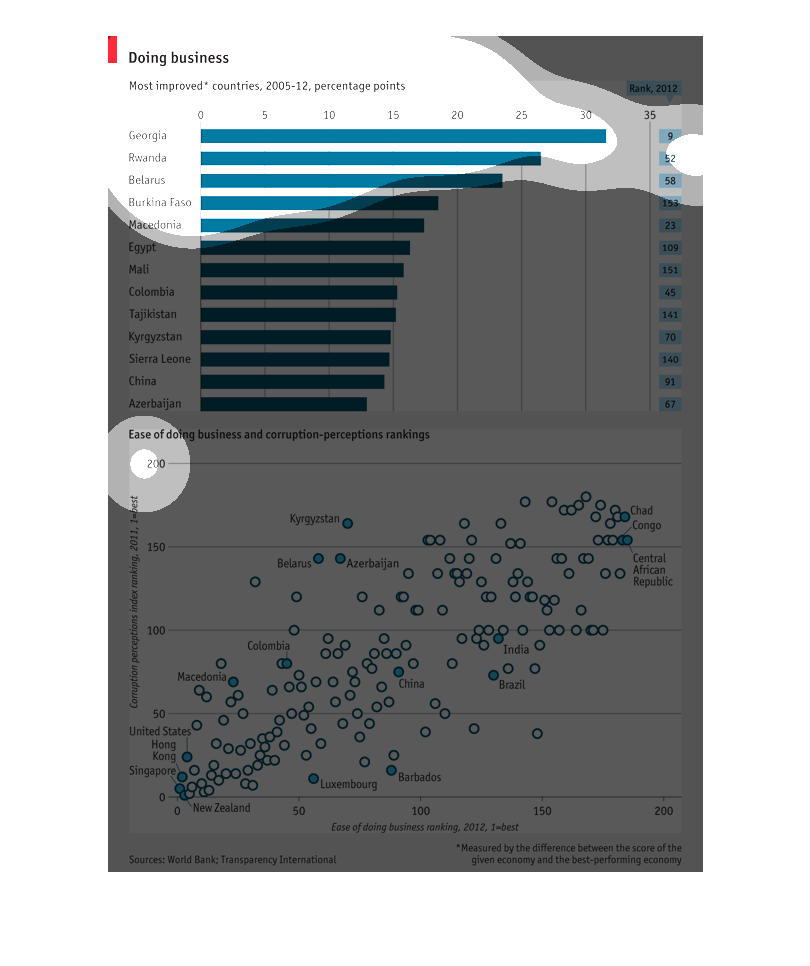
This chart shows the most improved countries of doing business from 2012. Some of the countries
are China and Egypt.  Another bubble chart below shows the ease of doing business with certain
countries and corruption perception rankings. Some of these countries include Brasil, India
and New Zealand.
This graphs show companies that have the most improved business through the years of 2005-2012
in percentages. The country Georgia seems to have the most improved business throughout that
time period.
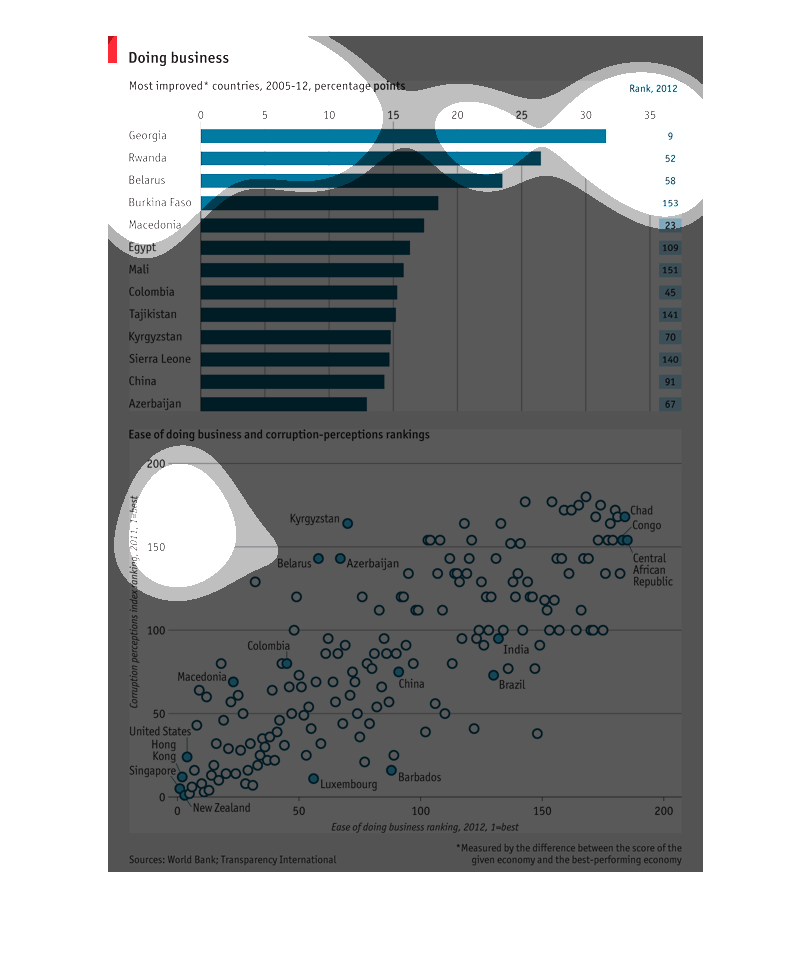
The top of this image contains a horizontal bar graph entitled "Doing Business" that lists
in order the most improved countries from years 2005-2012 in percentage points. Georgia and
Rwanda top the list and China and Azerbaijan are at the bottom. The bottom part of the image
is a scatter plot that ranks the ease of doing business and perception of corruption in different
countries.
The image shows a graph and a bubble chart and illustrates improvement in the area of doing
business for various countries over a seven year period. Georgia shows the greatest improvement
in this area, having improved by over 30%. Azerbaijan showed the least improvement at about
13%.
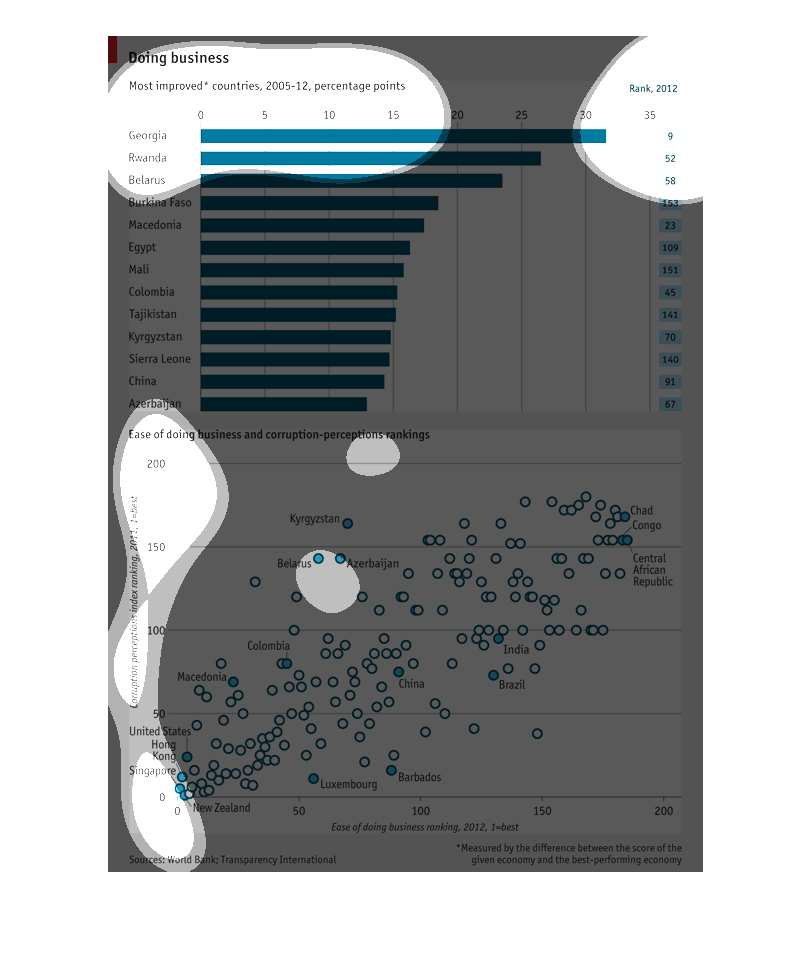
This graph depicts what countries have most improved on business and gives a percentage value
of the increase. It also shows the ease of ability to do business in a corrupt manner and
ranks each country accordingly. Covering the yeas of 2005-2012
This chart show the most improved countries for "Doing business from 2005-12 percentages.
Some of countries listed are: Georgia, Rwanda, Belarus, Macedonia, and Egypt.
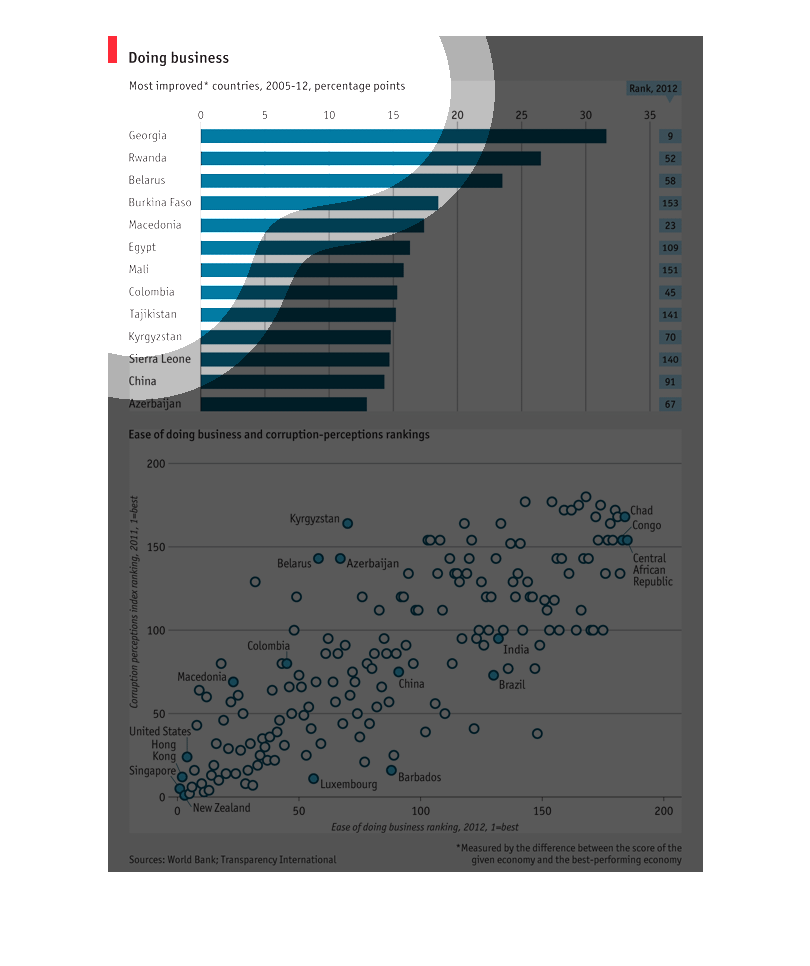
This graph shows different countries and their business developmet. Different countries are
also displayed on a dot graph showing which countries have been doing better in citizens obtaining
a job.
The graph shows countries that have improved in their business skills from 2005 to 2012, with
Georgia being in the lead for improving the most, and having the least amount of corruption
compared to the other countries listed below it.
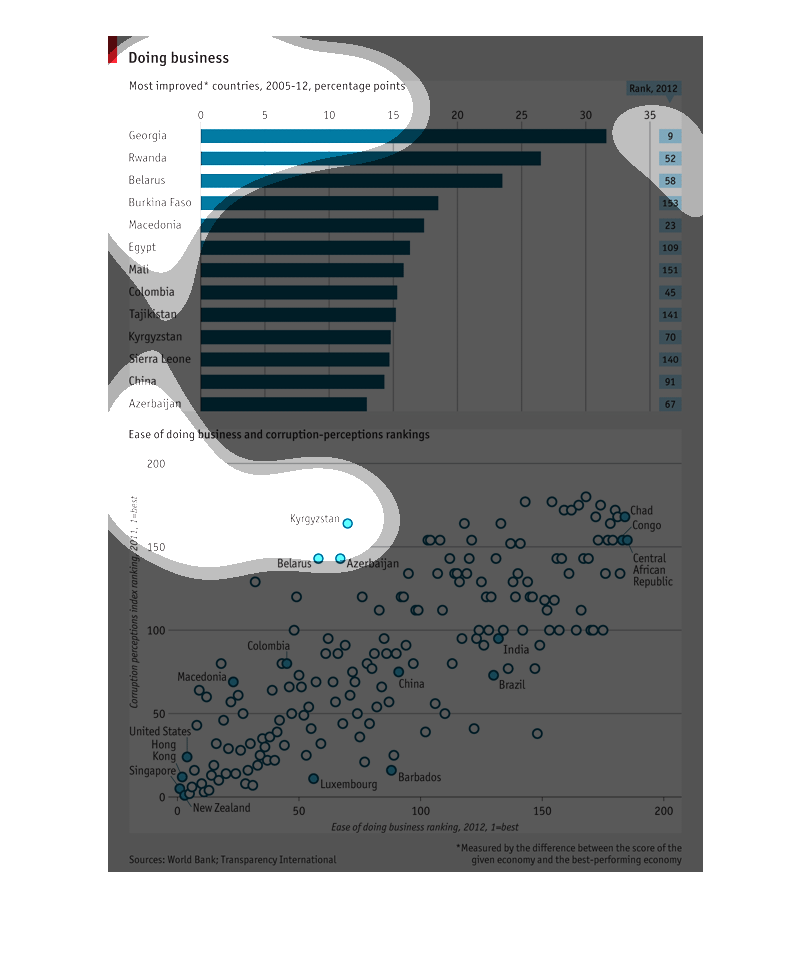
This graph is about "ease of business" for different countries. ease of doing business as
well as perception of corruption. Georgia wins, and Azerbaijan loses.
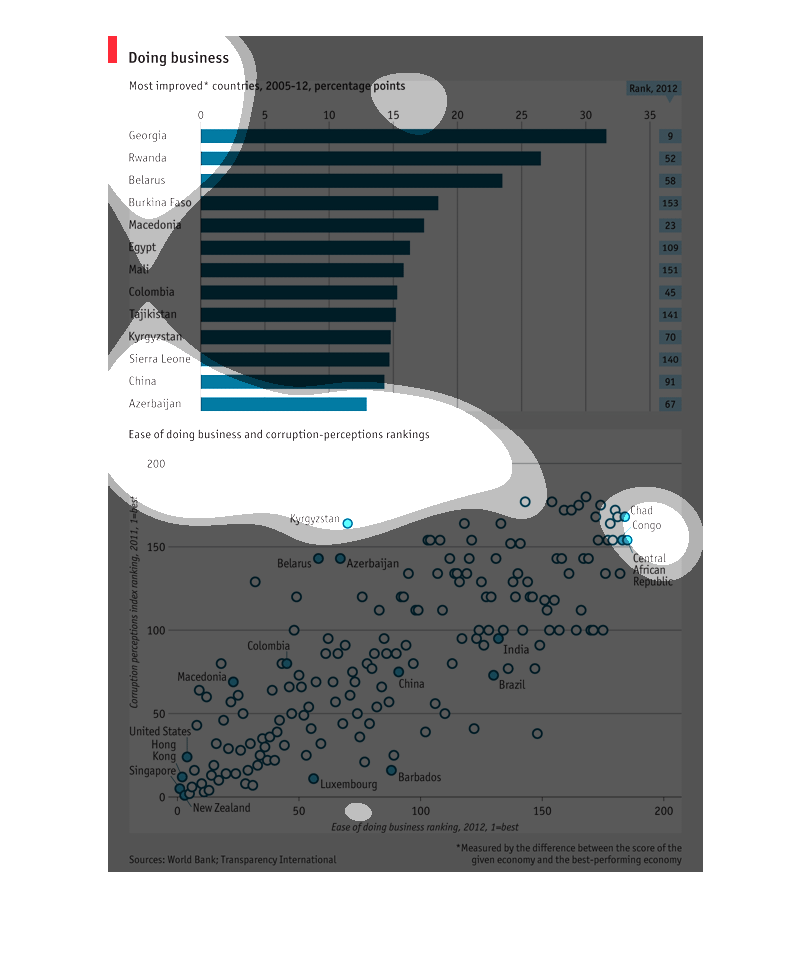
The top graph is showing the countries that have improved the most in the ease of doing business
with them between the years of 2005 and 2012. The bottom graph is looking at more countries,
all over the world.
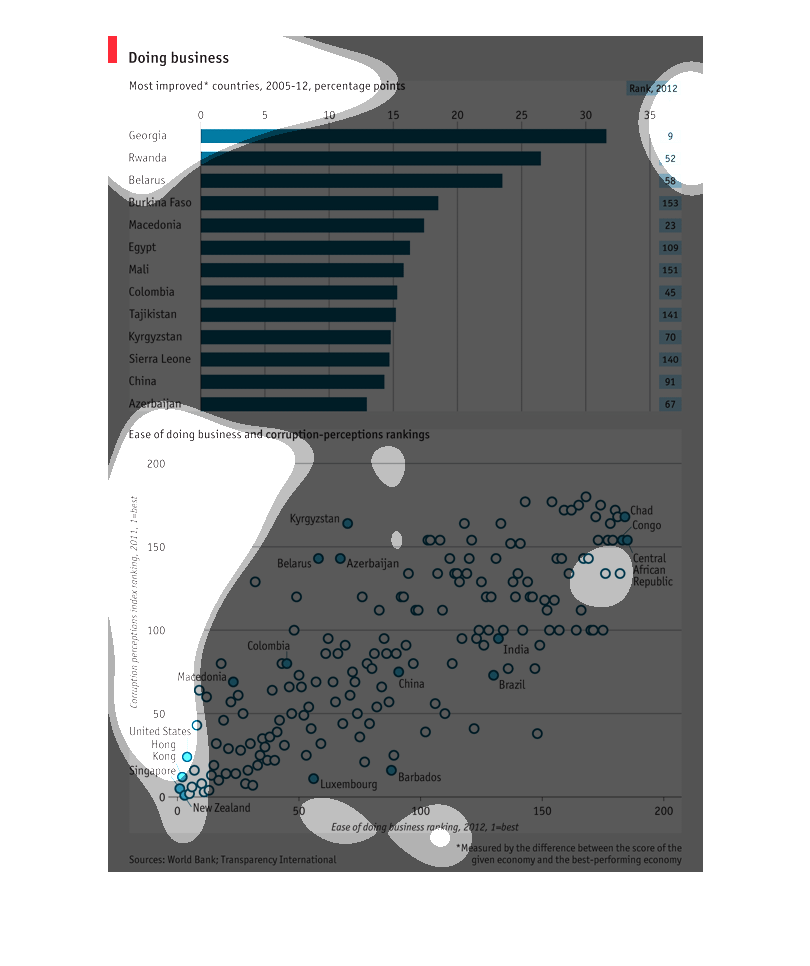
This graph is showing the countries with the biggest percentage of GPI gross increase over
the year shown. These countries have had the biggest percentile increases in business compared
to the rest of the world.
This is a graph comparing the ease of a country to do business with it's corruption perception
ratings. There appears to be no correlation between the two.
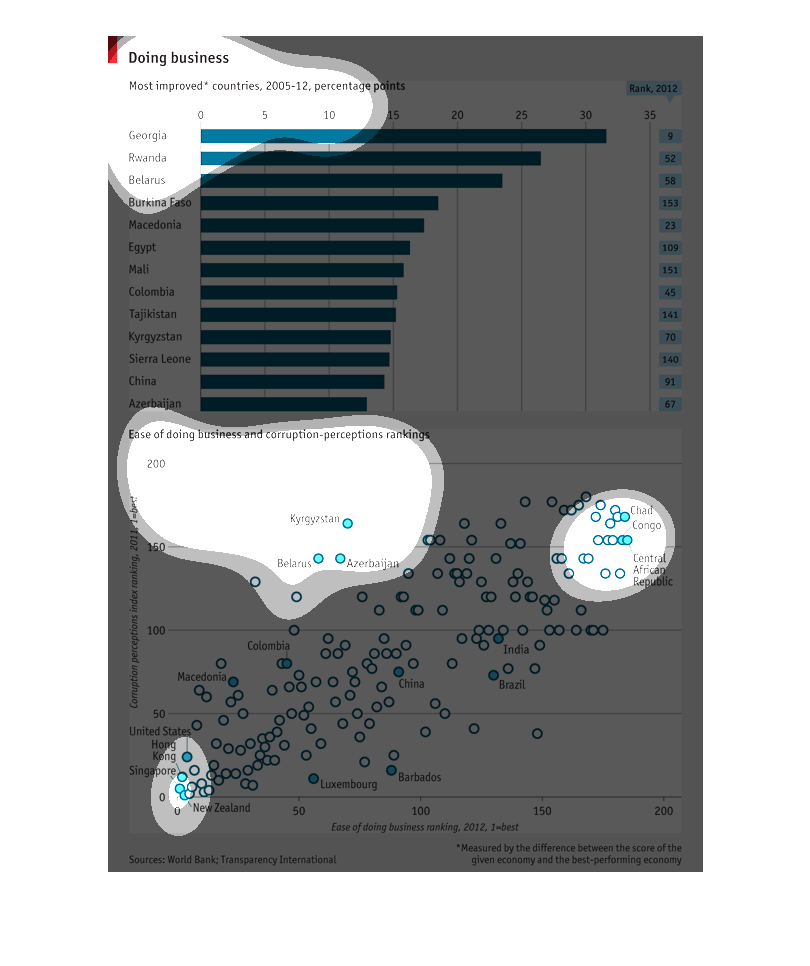
The bar graph at the top shows the countries which were the most improved (by percentage points)
in the ease of doing business rankings. The scatterplot at the bottom shows the correlation
between "Ease of Doing Business (x-axis), and "Corruption Perception Index" (y-axis).  This
plot shows that there is a relatively strong correlation between the ease of doing business
and the perception of corruption. As a countries Corruption Perception Index ranking gets
higher (closer to 1), the ease of doing business ranking also is higher.