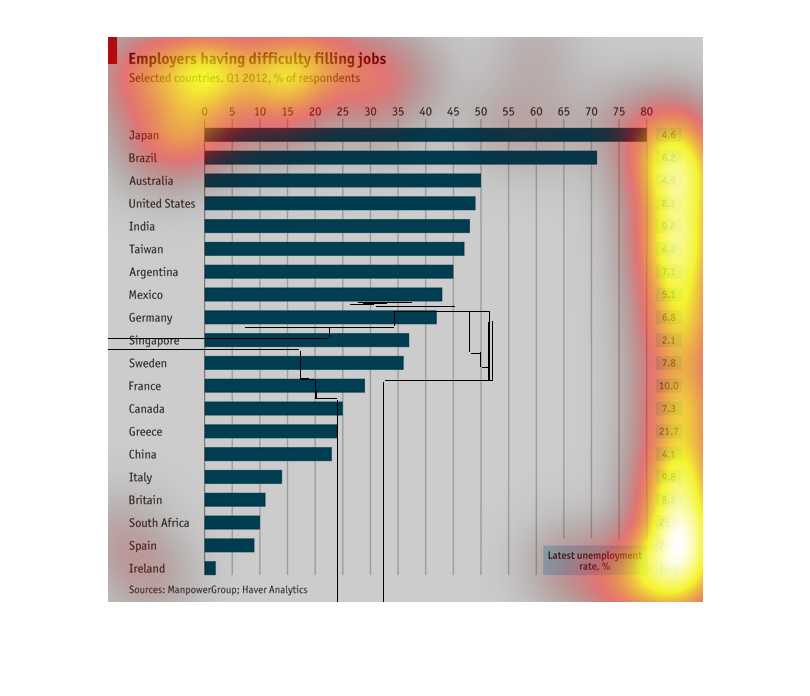
The bar chart represents the difficulty that employers are filling jobs in select countries.
 The chart is formatted from the most difficult to the least difficult.
Employees having difficulty filling jobs for selected countries. According to the graph, Japan
seems to be at the top with a total of 80 and Spain at the bottom with 10.
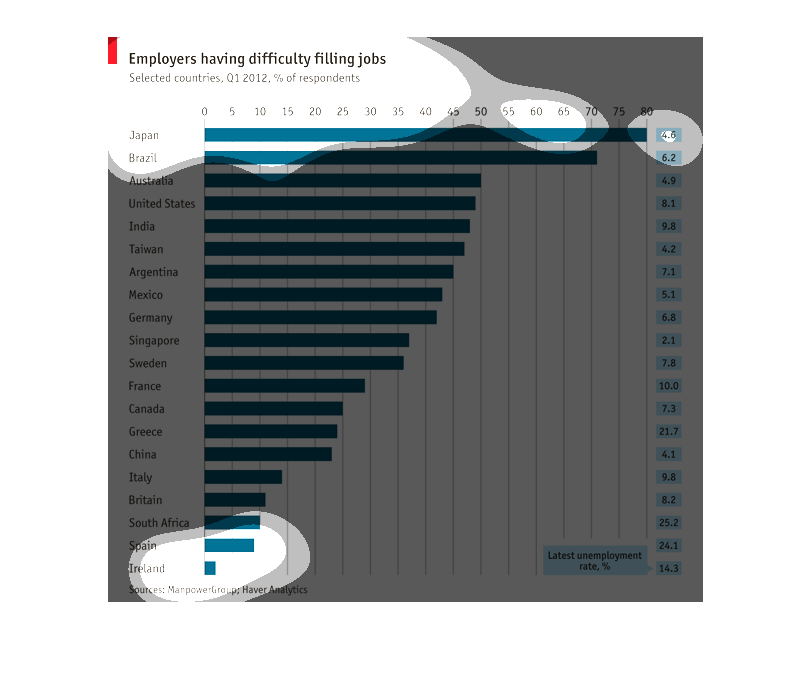
This graph shows the percentages of employers having difficulty filling jobs in various countries.
Japan has the highest percent and Ireland has the lowest.
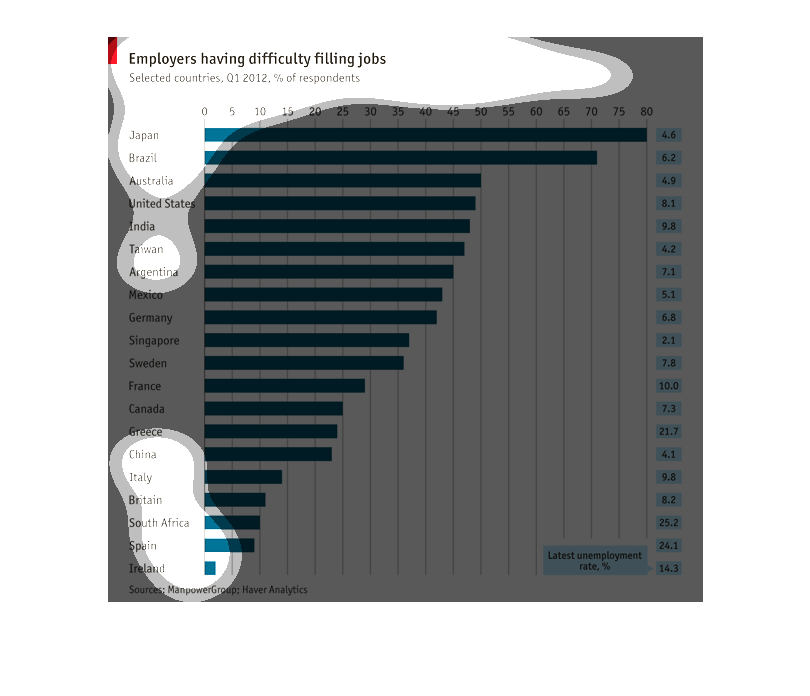
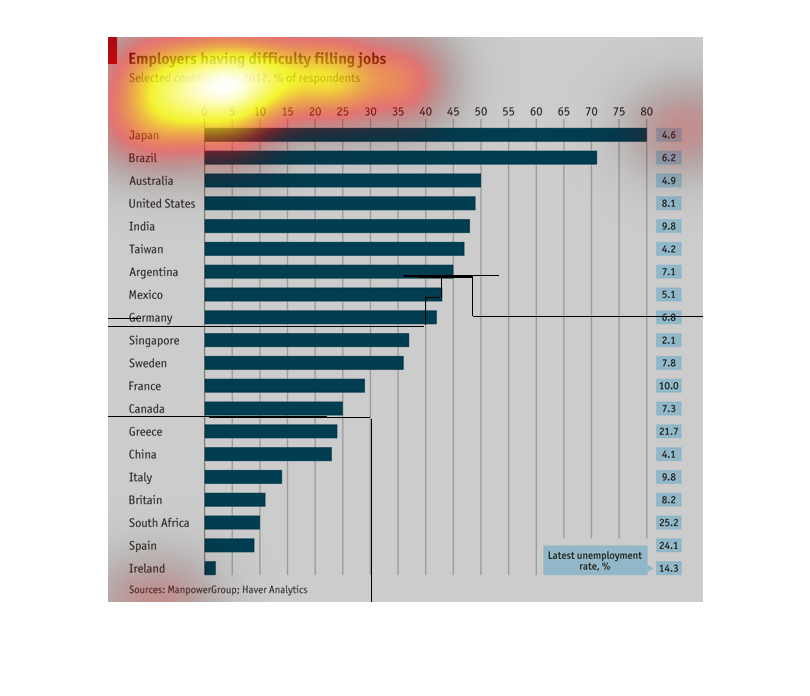
The bar graph, sorted by country, lists employers who have issues filling jobs. The top three
on the list include Japan, Brazil, and Australia while the last three on the list include
South Africa, Spain, and Ireland.
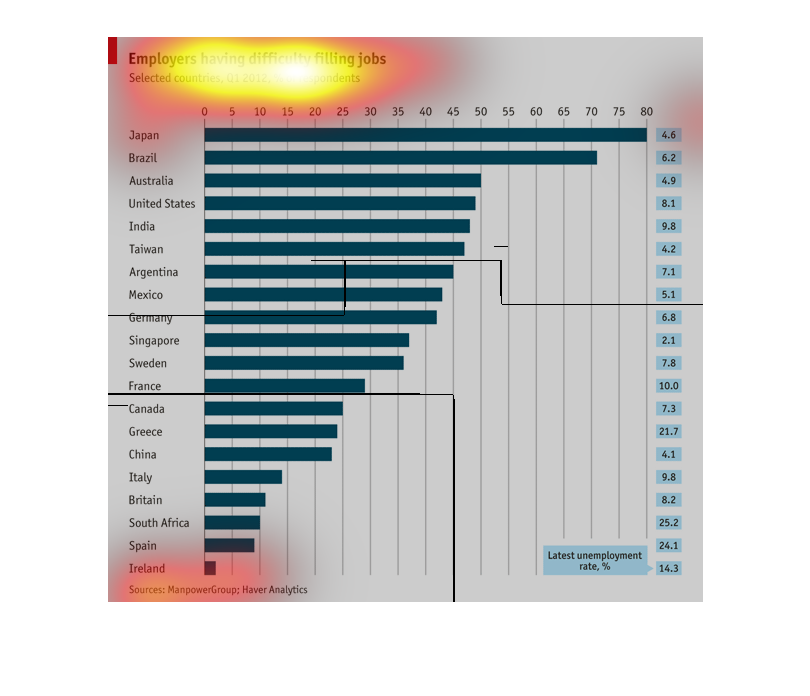
Employers Having Difficulty Finding Workers: This graph shows the rate of empty positions
per country. Japan is highest The U.S. is around 5th. The lowest rate is in Ireland.
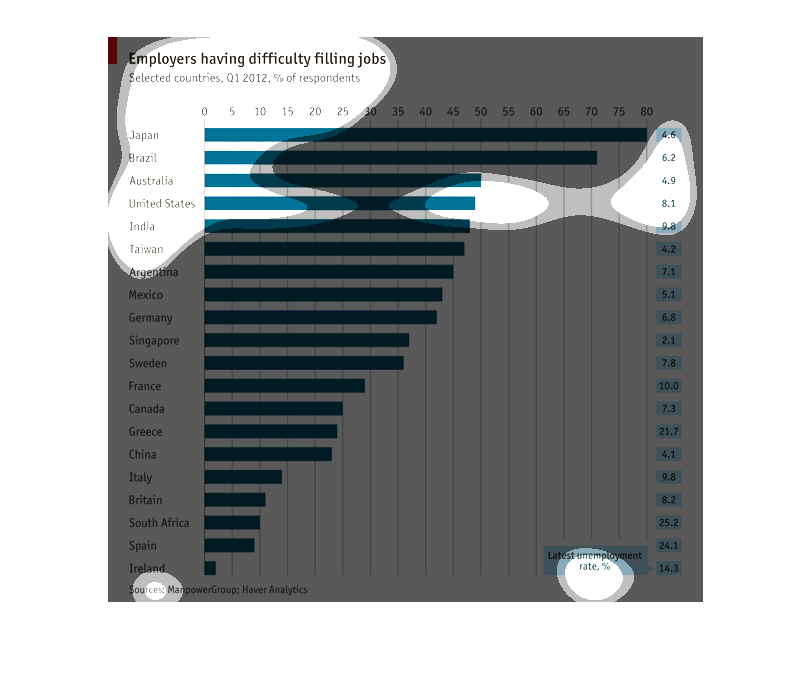
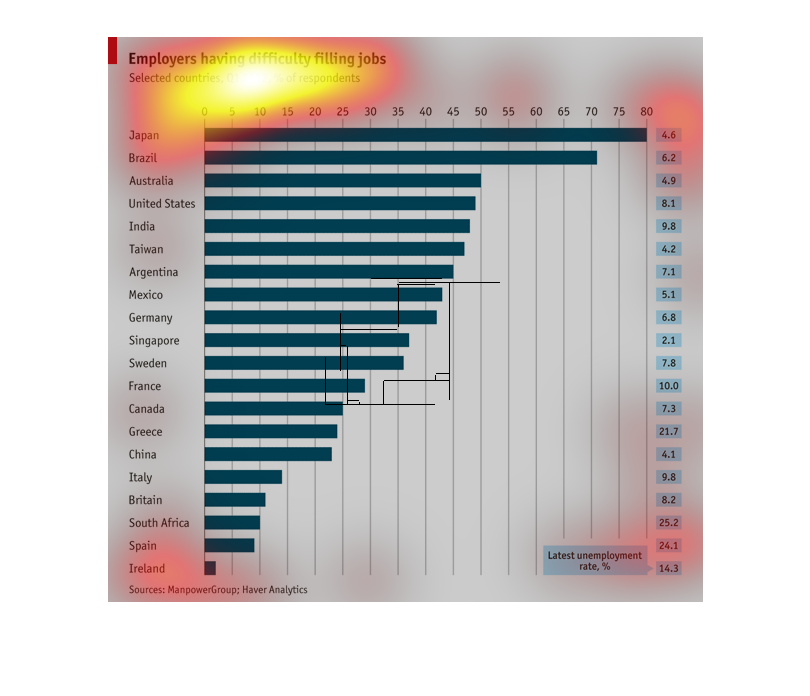
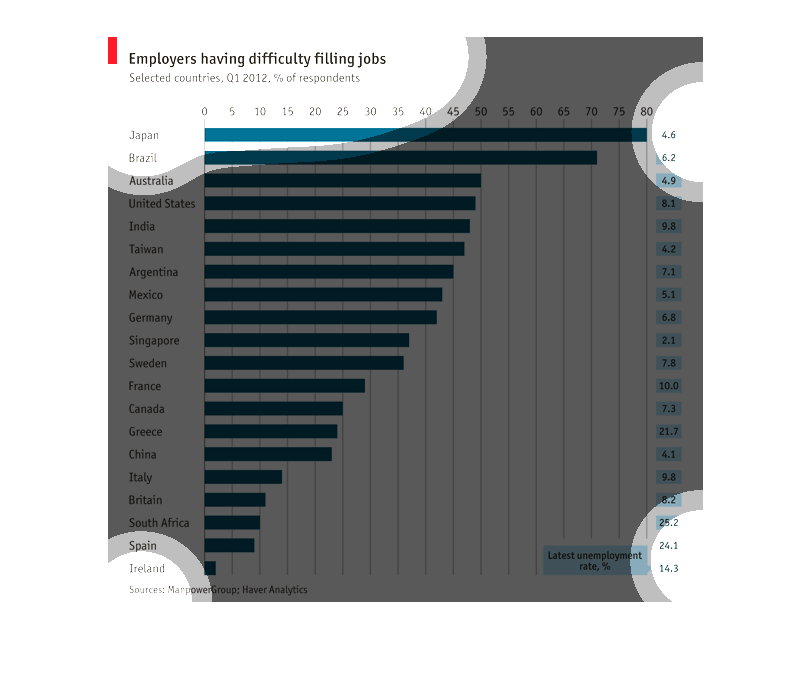
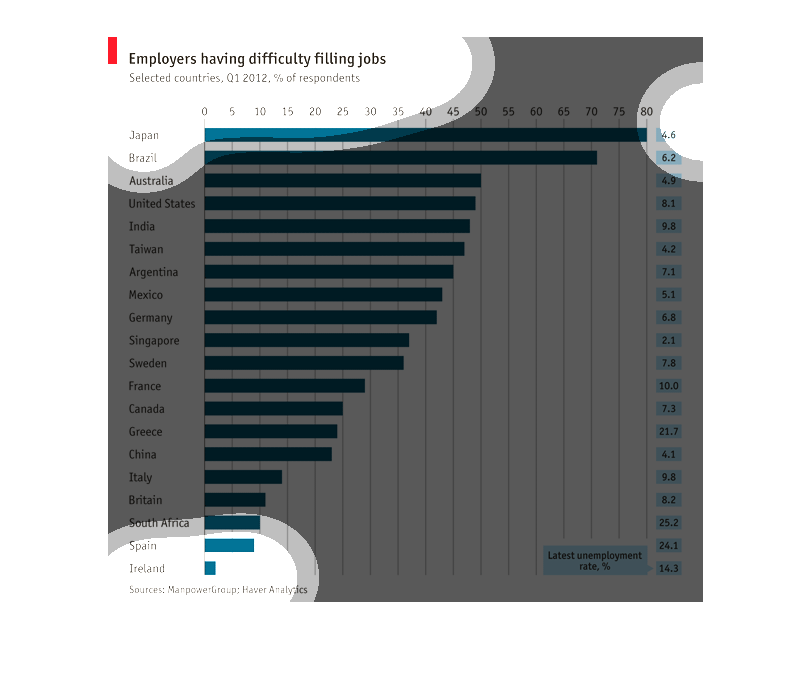
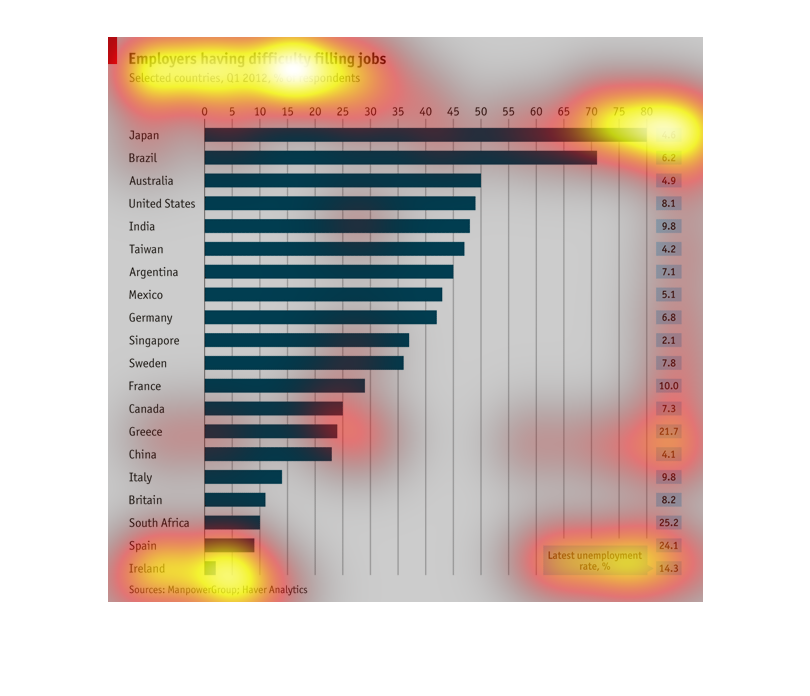
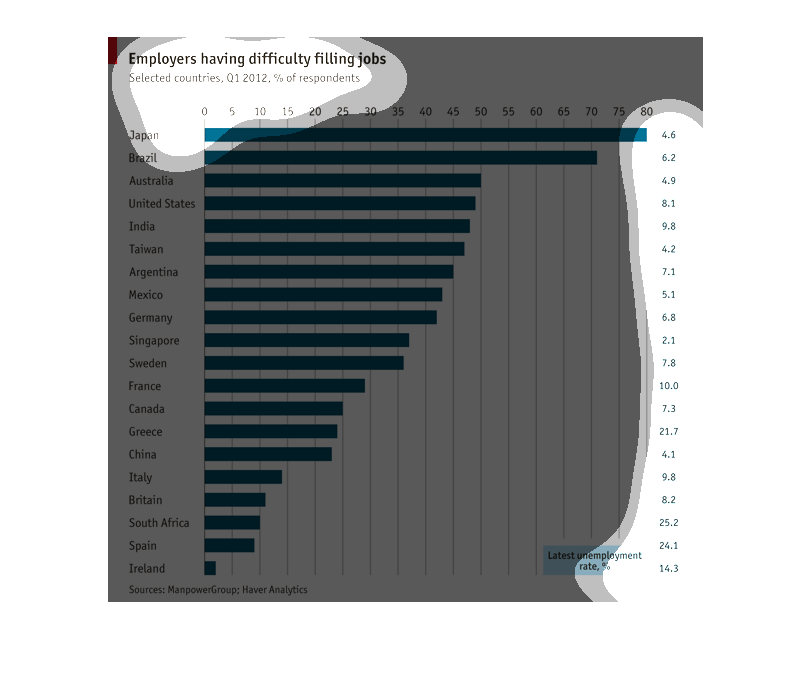
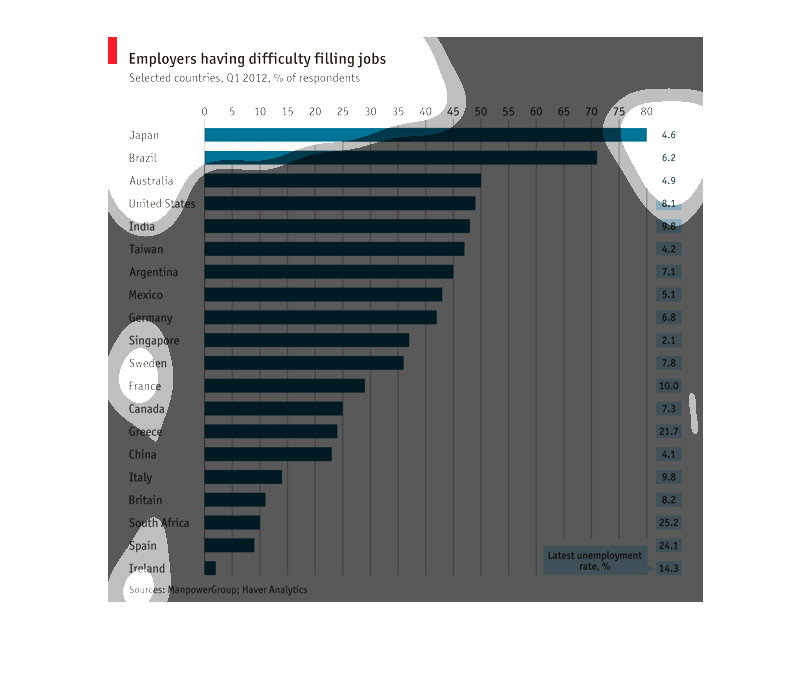
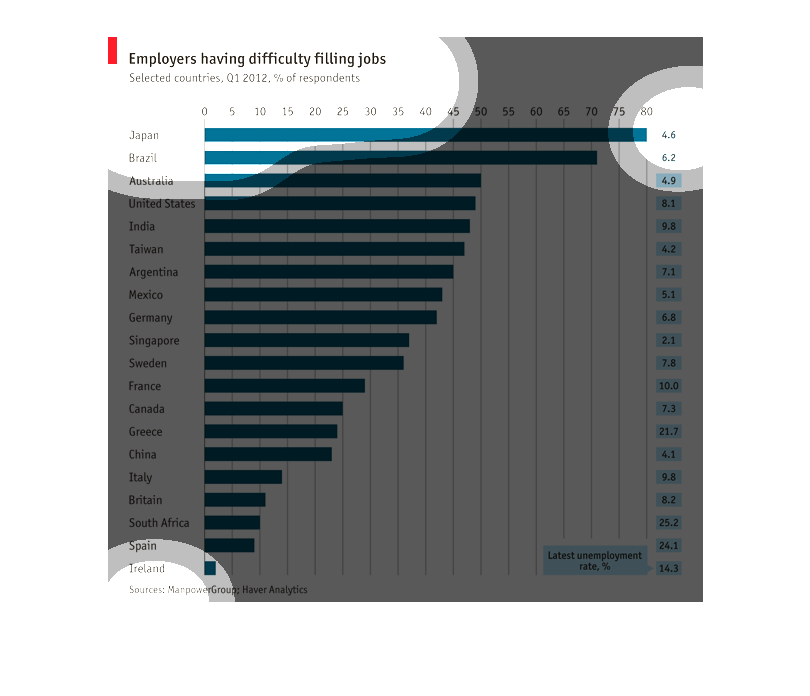
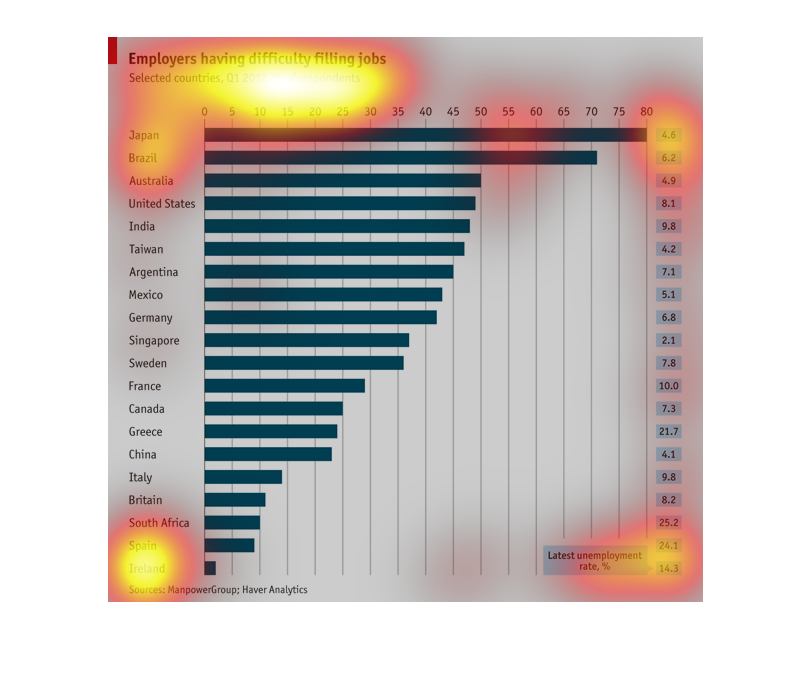
This graph is about employers that have difficulty filling jobs. The bars show the percentages
of respondents that have difficulties filling jobs. The numbers to the right of each bar show
the unemployment rates for that country. There is not a clear correlation between difficulty
filling jobs and unemployement rates.
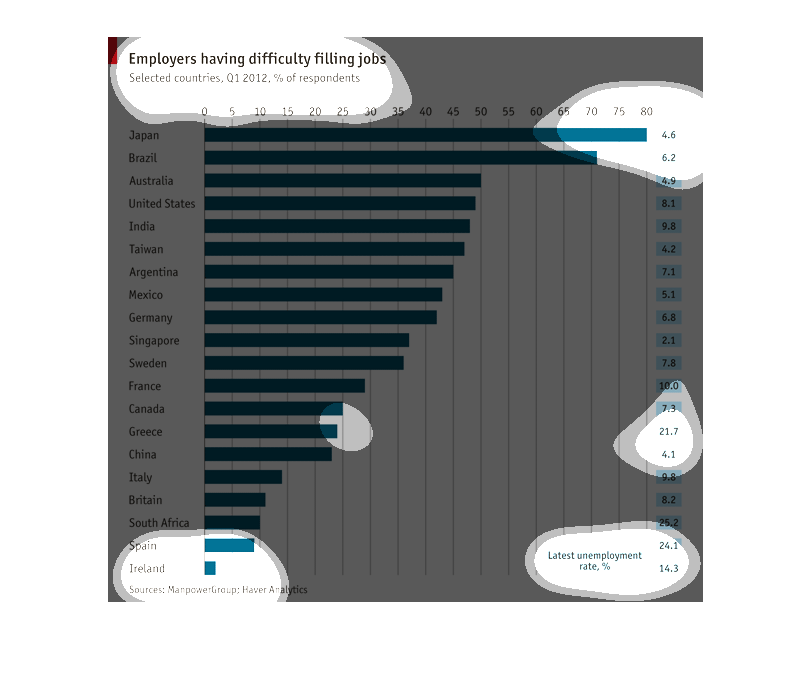
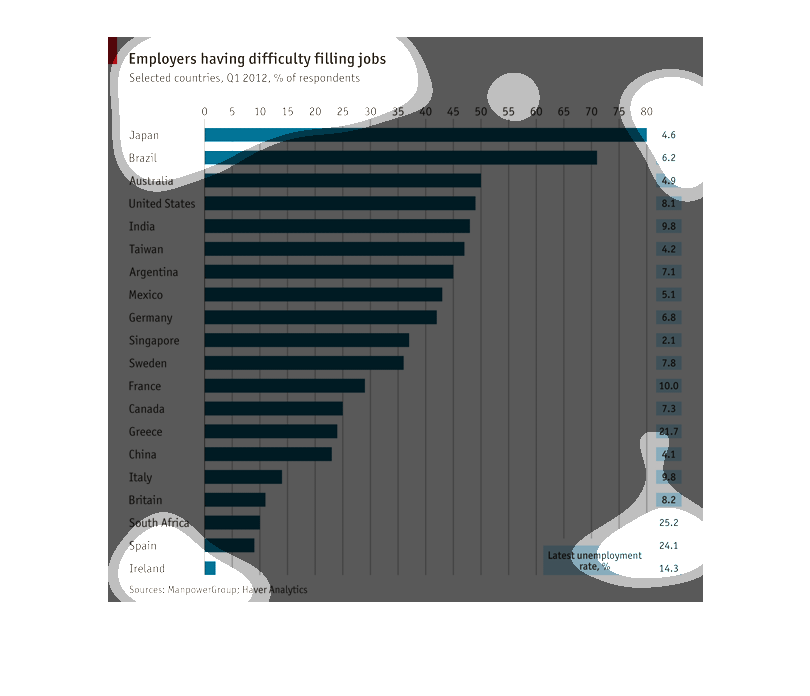
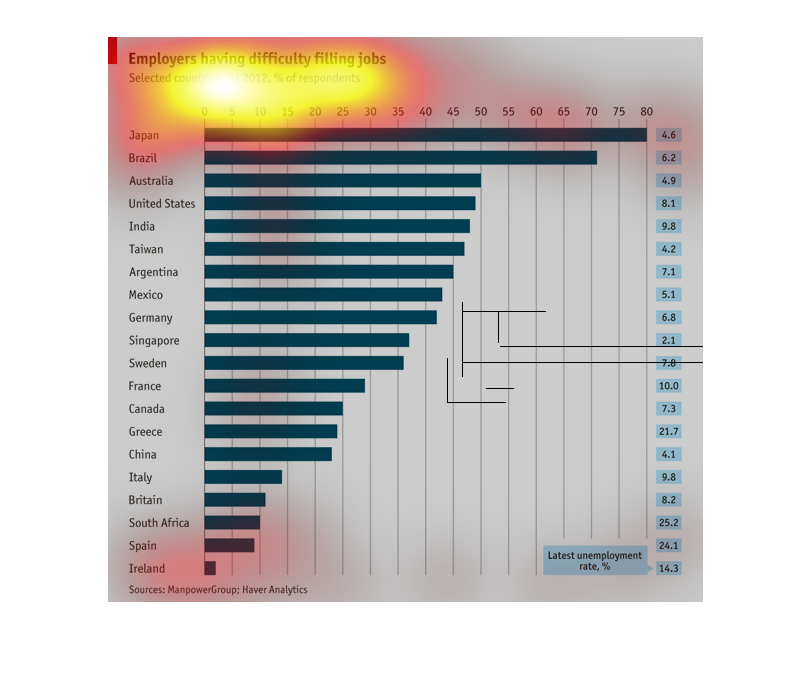
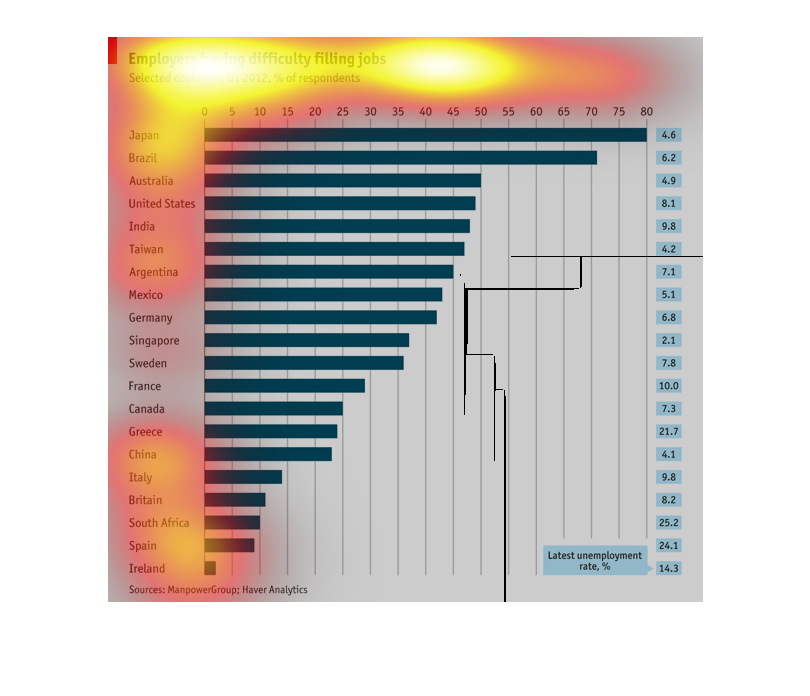
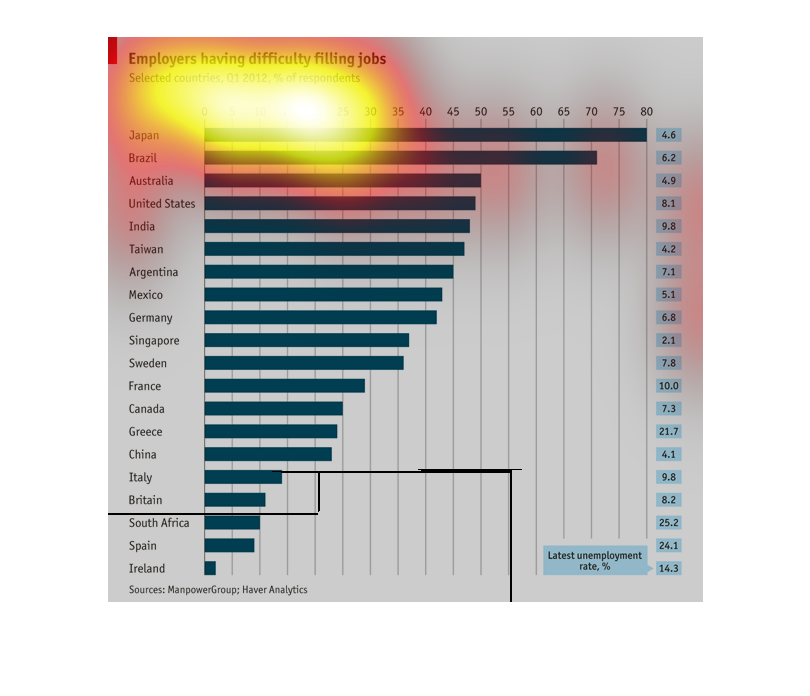
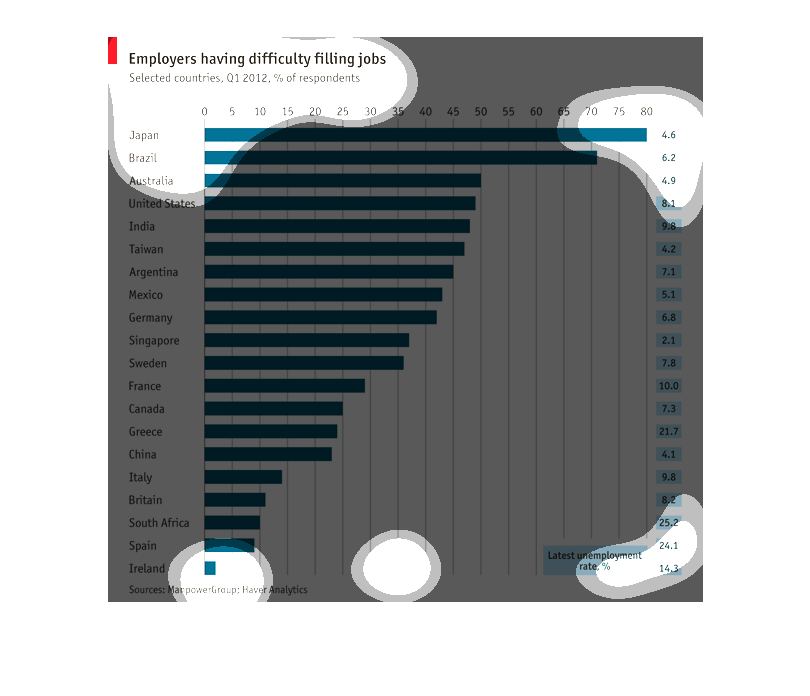
This graph tracks the percent of employers surveyed that report having difficulties finding
 employees to fill open positions. The graph plots the percent of employers reporting the
difficulties by country against the unemployment rate of that country. The graph shows that
the link between the unemployment rate and the rate at which employers report having difficulty
filling positions is not clearly linear, as the employers of some countries with a relatively
high rate of unemployment report having more difficulty filling positions that employers of
countries with a much lower rate of unemployment. It does seem to indicated that once countries
pass a certain threshold of unemployment, the difficulties employers experience with hiring
are dramatically reduced.
This graph seems to be a representation of the difficulty of filling jobs as a function of
Country.  The function and units are not clearly defined in this case.
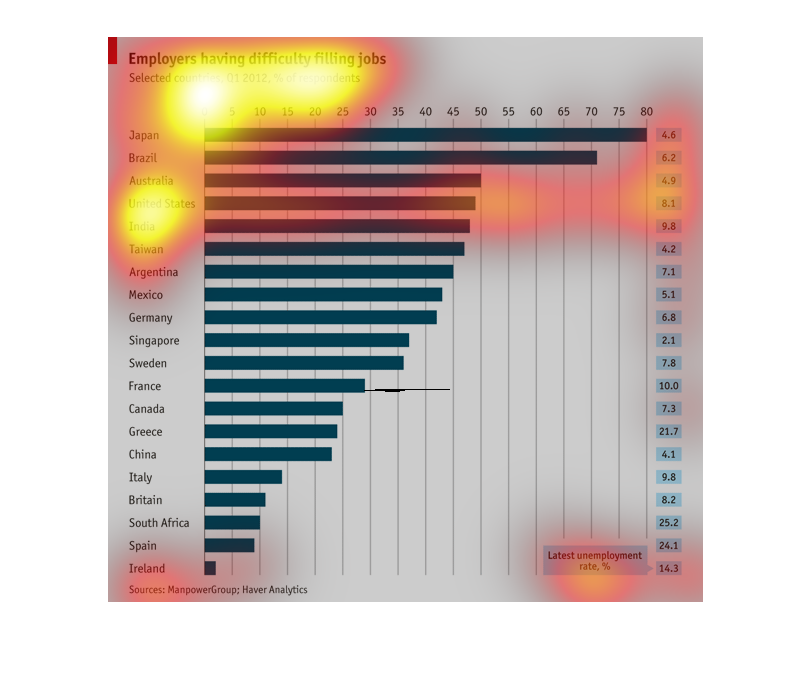
The graph show the percentage of employers that are having trouble filling Jobs in 2012. Japan
reports the most difficulty, followed by Brazil, Australia and the united States.
The graph shows percentage of employers having trouble filling jobs.  It is graphed by country
and Japan has the highest looking from the graph.  Highest unemployment is Ireland.
This chart compares how difficult it is for employers in various countries to fill job vacancies.
Employers in Japan have the most difficult time while employers in Ireland have the easiest
time.
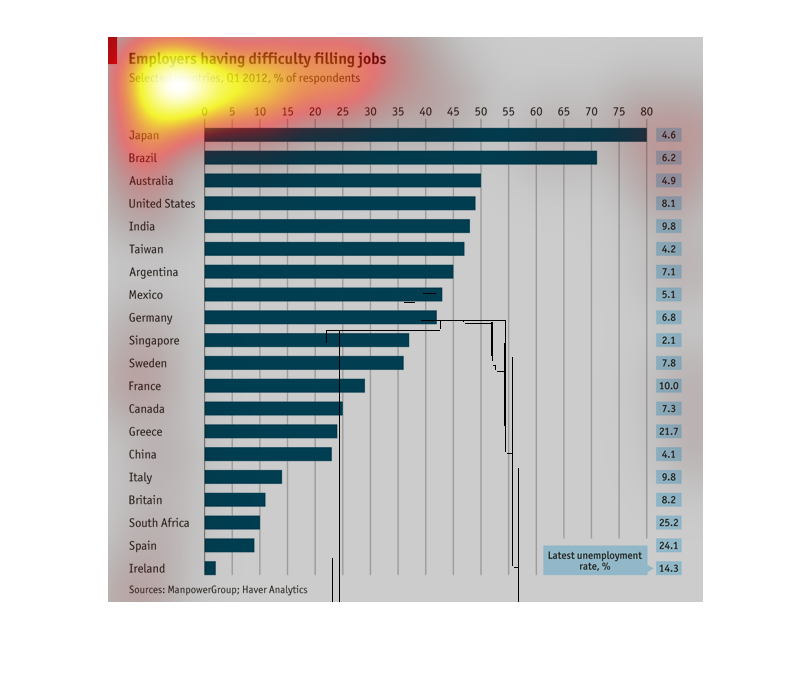
This chart represents the number of employers having difficulty filing jobs with a relation
to the country's latest unemployment rate.  Twenty countries are listed including the US and
Japan.
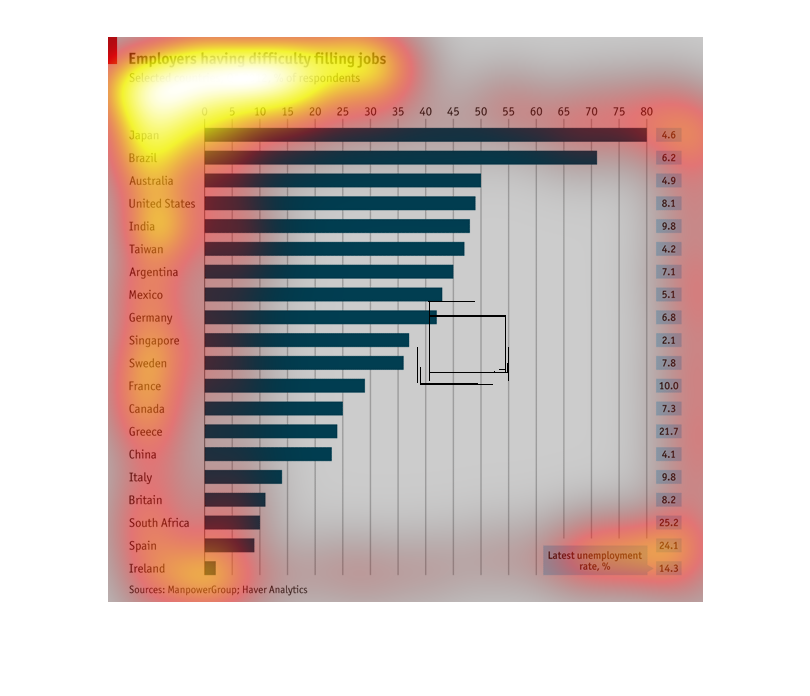
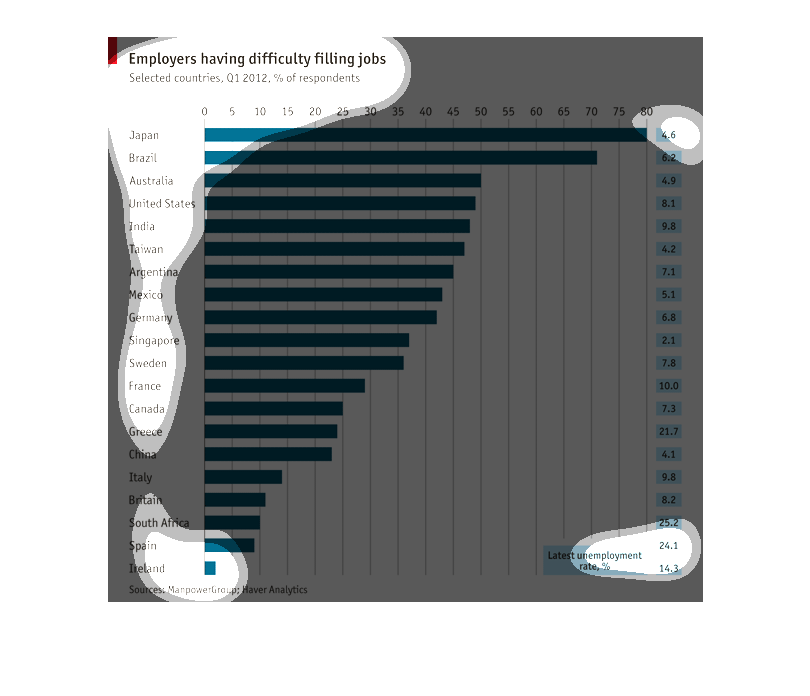
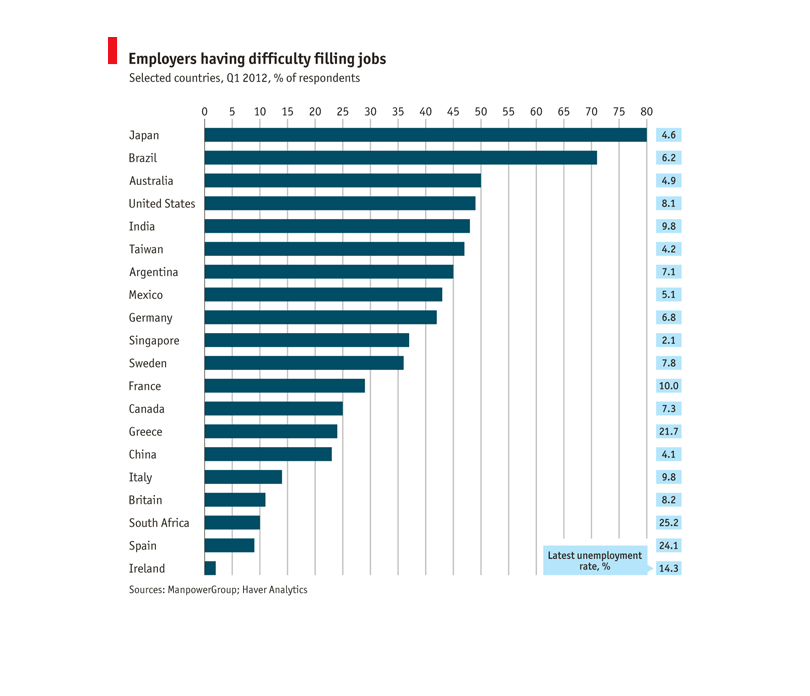
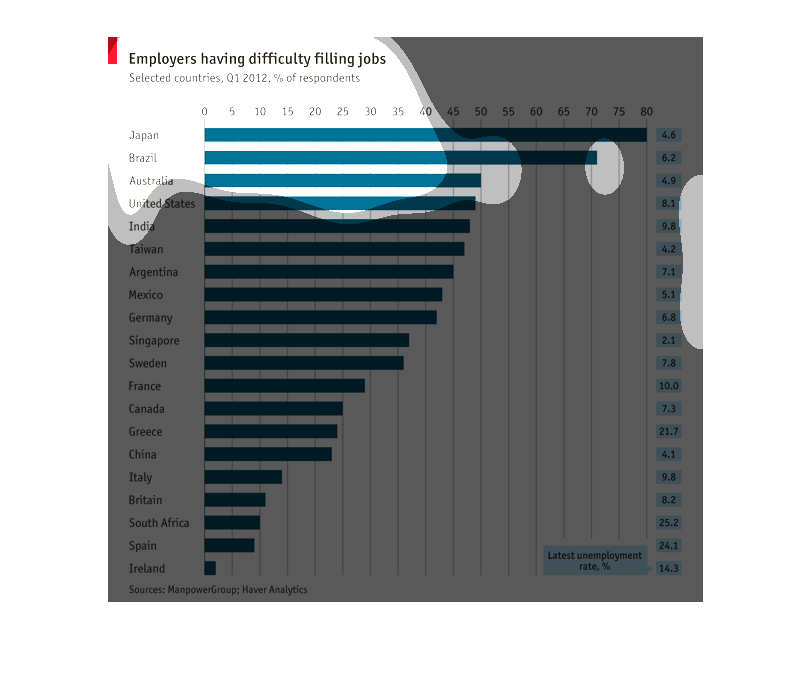
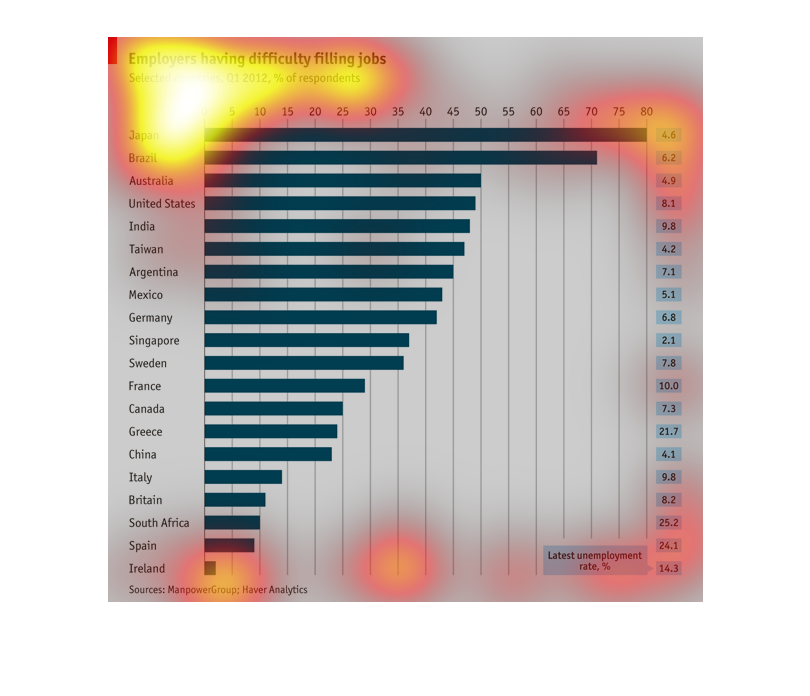
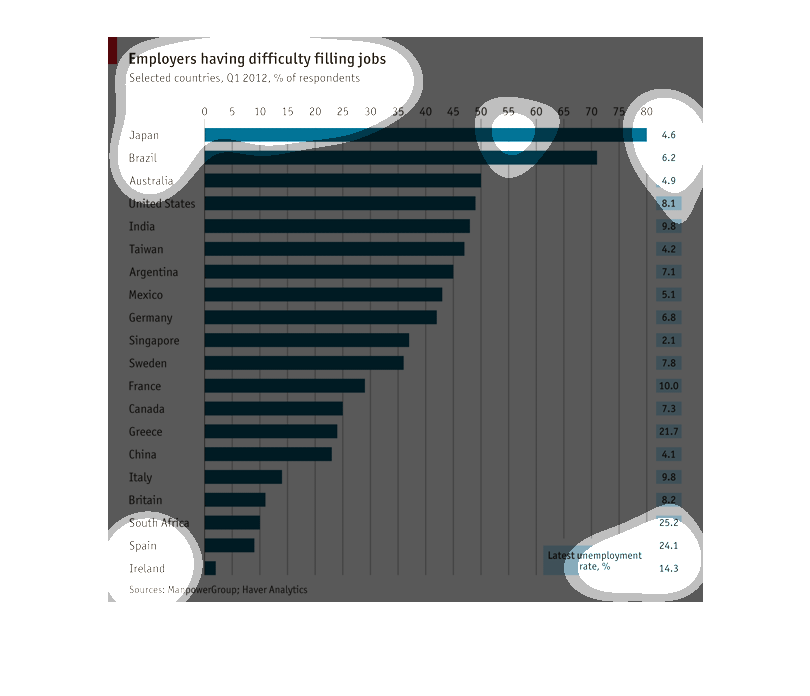
This is a chart showing the rates at which employers in several different countries have had
difficulties filling jobs in the first financial quarter of 2012. It also presents the latest
unemployment statistics of each country. Of all countries, employers in Japan, Brazil, and
Australia report having the hardest time filling positions, with around 80% of Japanese employers
reporting such difficulties. These countries also report low rates of unemployment, with Japan
reporting 4.6%, Brazil with 6.2% and Australia reporting 4.9%, and Ireland, Spain, South Africa,
and Britain report having the lowest rates of difficulty in filling jobs, which is interesting
given their relatively high unemployment rates (14.3% for Ireland, 24.1 in Spain, and 25.2
in South Africa).
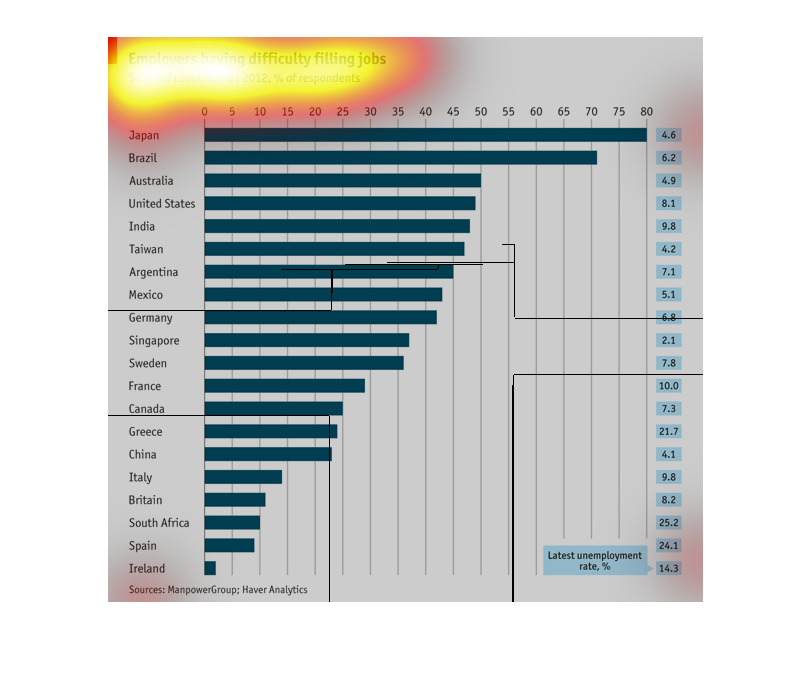
This chart displays the discrepancy in employers having difficulty filling jobs and the unemployment
rate. This is taken from countries around the world in 2012 with the % of respondants. Japan
seems to be leading for 2012. Ireland is on the low end of this chart.