This graph is related to the unemployment rate in our youth population in different countries.
At number one it's Spain and at the end is Netherlands.
THIS IS A CHART THAT SHOWING THAT THE TOP PART IS WINNING IN POINTS OR VOTES. THE BOTTOM PART
IS VERY LOW. LOOKS LIKE SPAIN IS WINNING THIS COMPETITION
This chart depicts the unemployment rate of a multitude of different major countries all over
the planet from December of they year two thousand-seven.
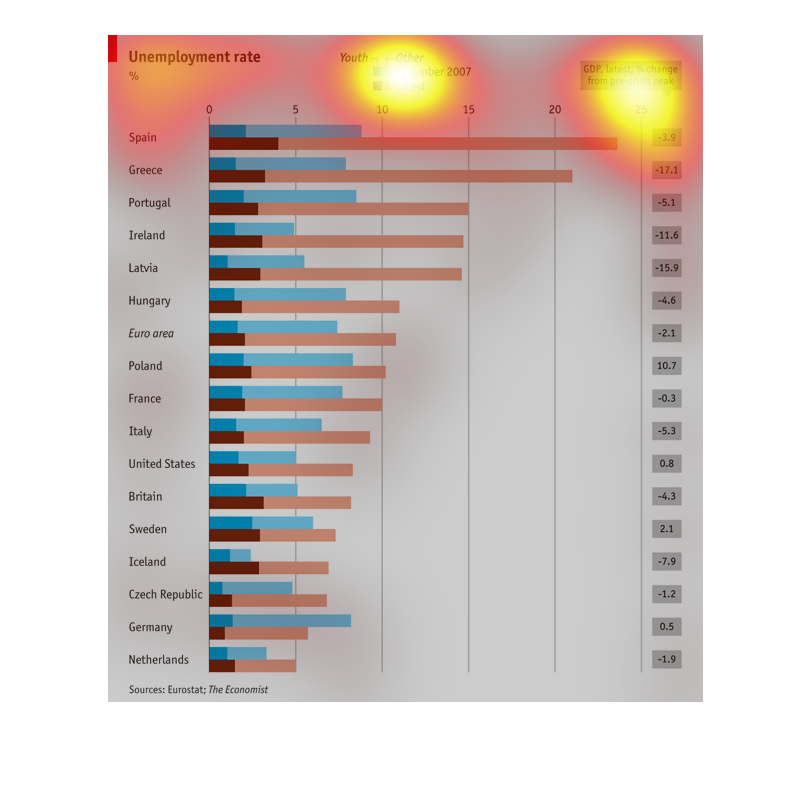
This chart shows the unemployment rates by country.  Spain is the country with the highest
unemployment rate.  The smallest unemployment rate is in the Netherlands.
The image chart is contrasting the unemployment rate among the youth of many different countries.
The unemployment collection data from December 2007 compared to the latest information.
Unemployment rates between different countries such as Spain and Germany. This is showing
unemployment in the youth and other parts of the world which is shown in positive and negative
numbers in a bar graph.
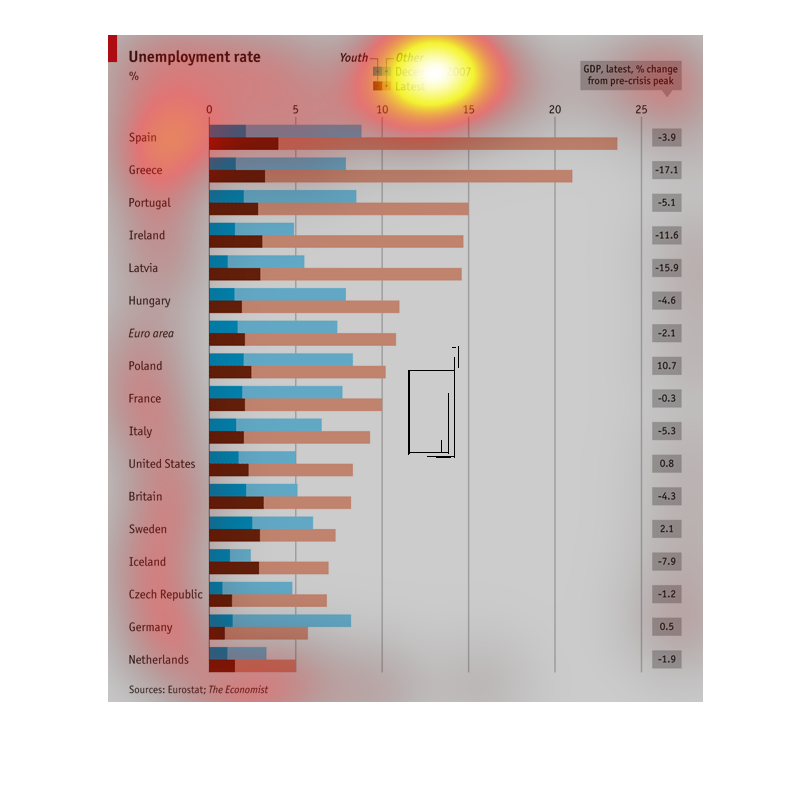
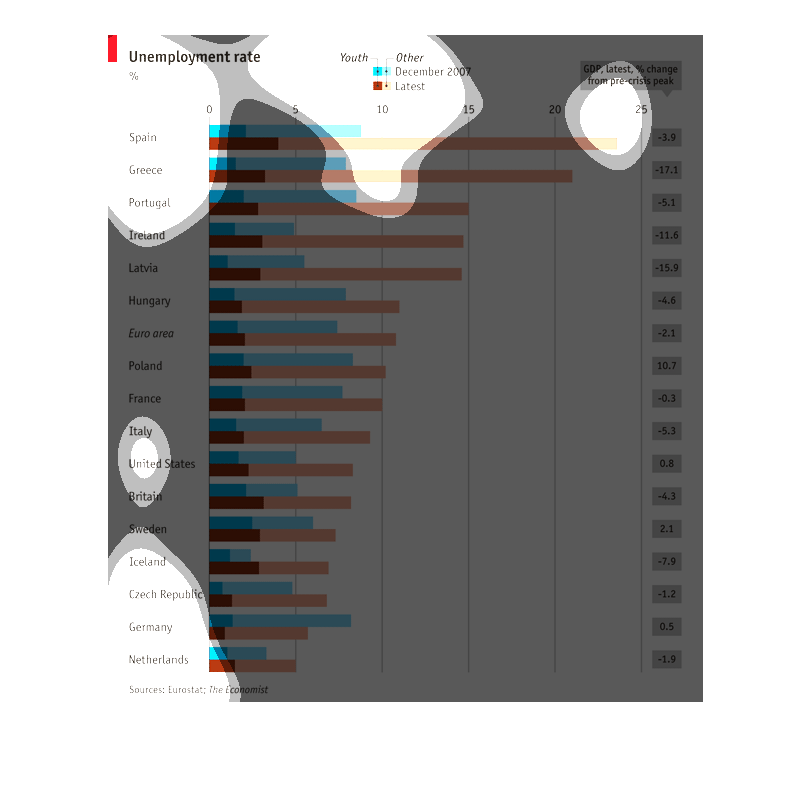
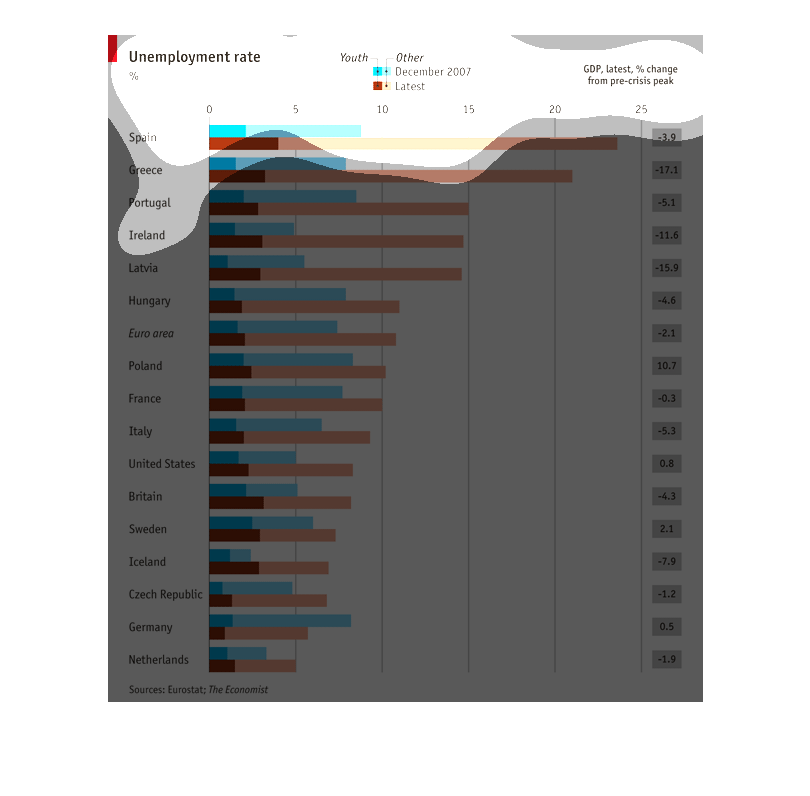
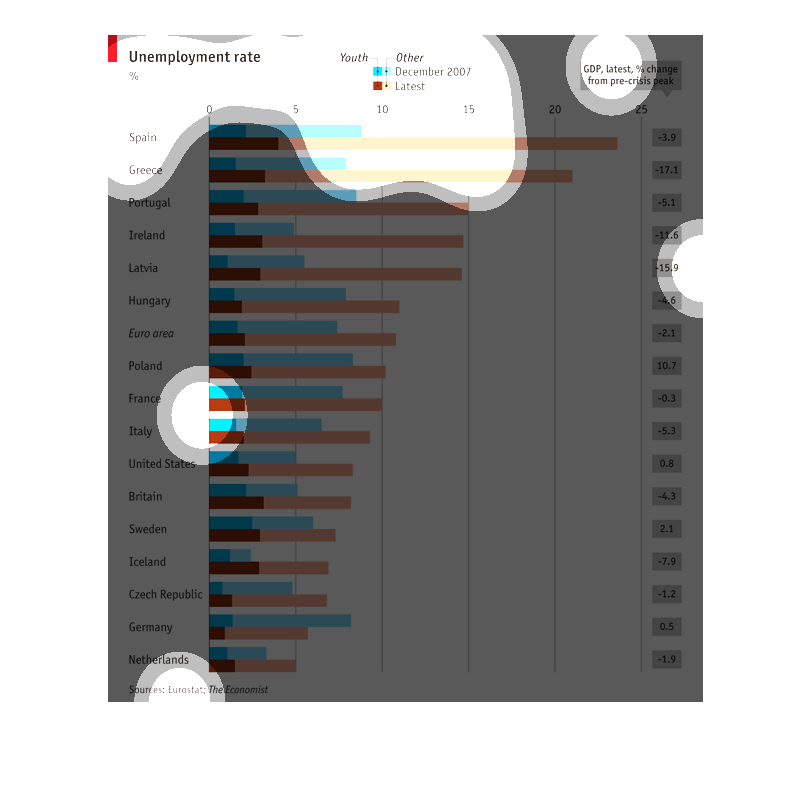
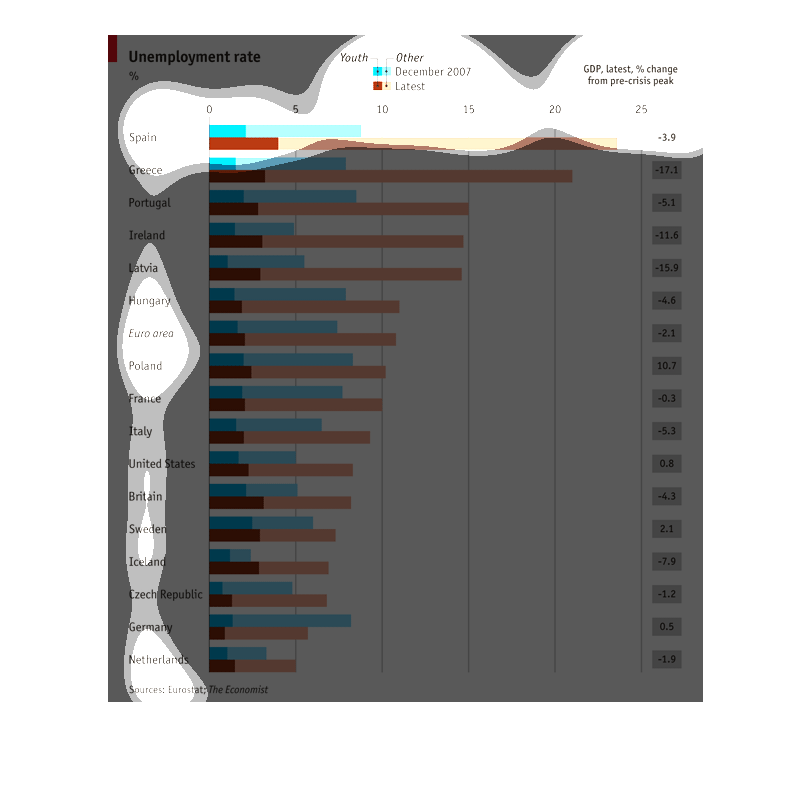
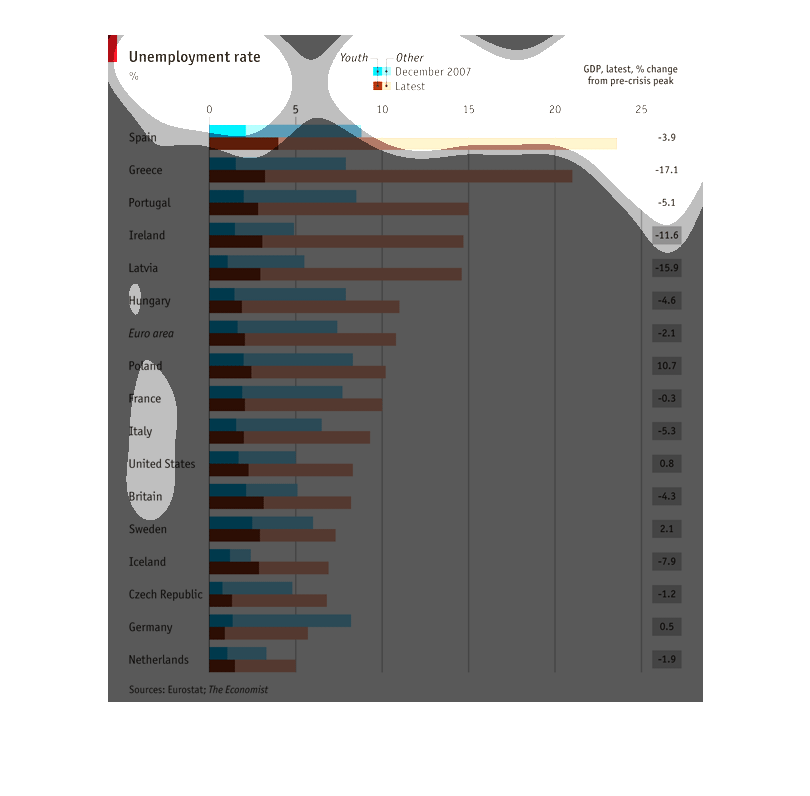
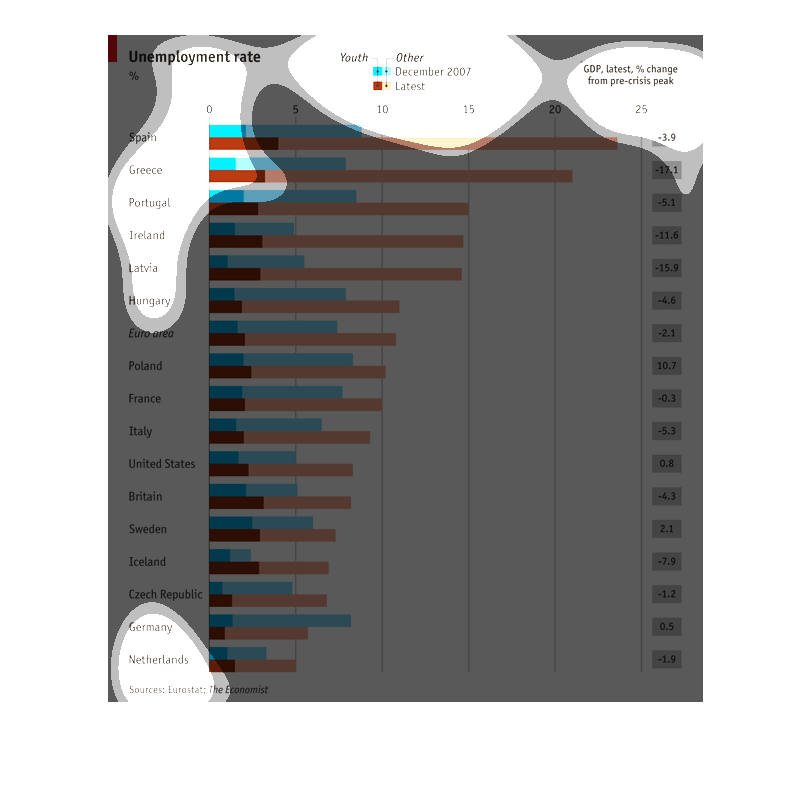
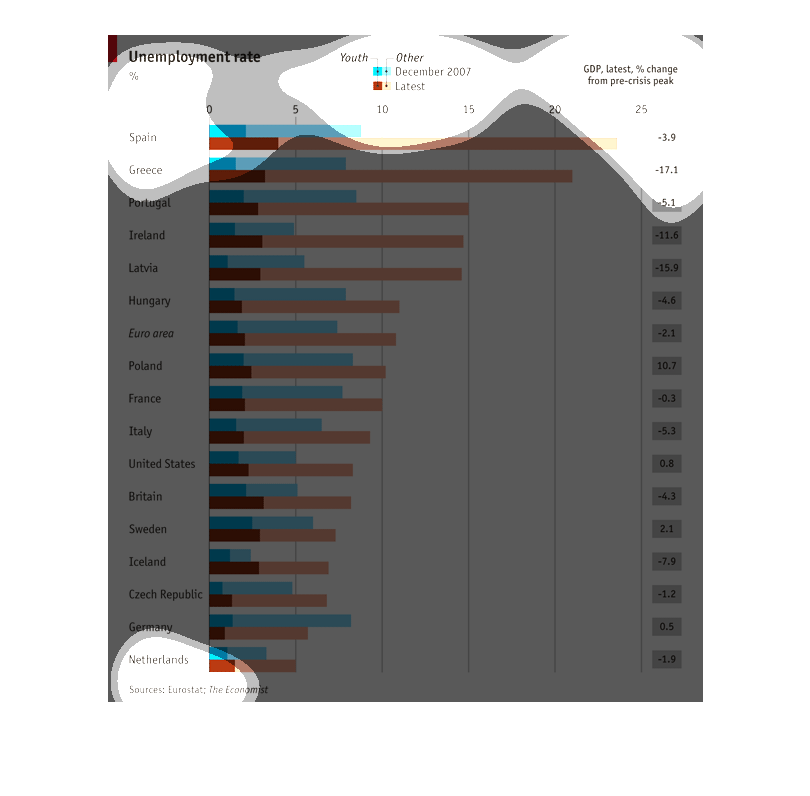
This is a horizontal bar chart that represents Unemployment Rates in Europe, Great Britain
and the United States for youth and other in December 2007 and Latest. I am unsure when "latest"
is. The dark blues are for youth in December 2007 and browns are for youth Latest, the light
blues is for "other" December 2007 and the orange is for "other" Latest. the scale is for
GOP, latest, % changes from pre-crisis peak for each of the countries listed.
This graph shows the unemployment rate of various countries in the world. It's separated into
multiple categories. The first is comparing December 2007 and the latest data. The second
is comparing youth to the 'other' category.
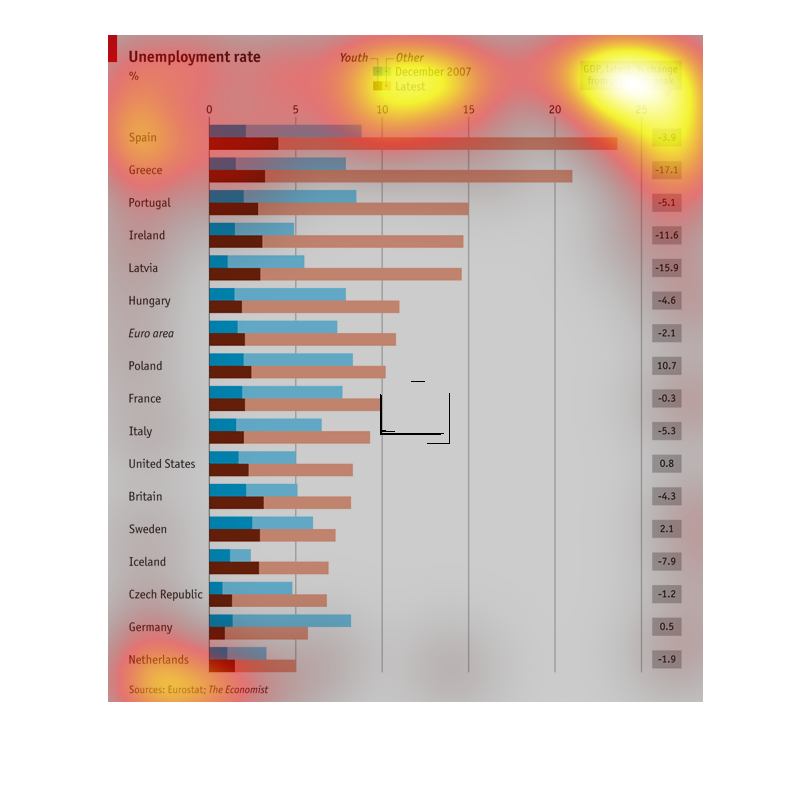
This chart is a depiction of the unemployment rate and the GDP latest percentage change.
The chart reflects large countries around the world like the use, Germany, the Netherlands,
US, and Italy and measures the change in GDP% based on the employment rate in increments of
five.
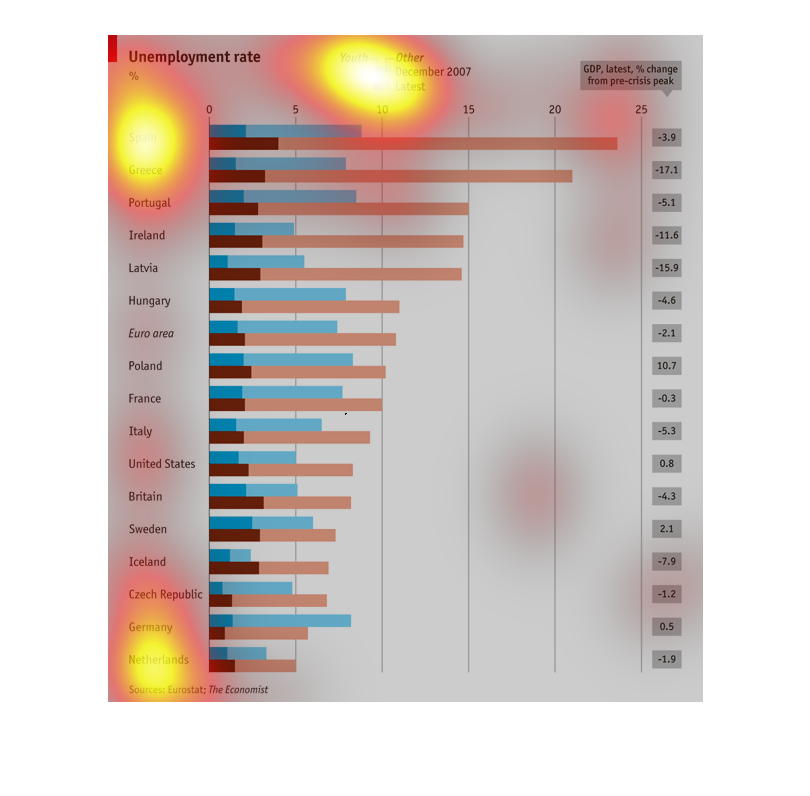
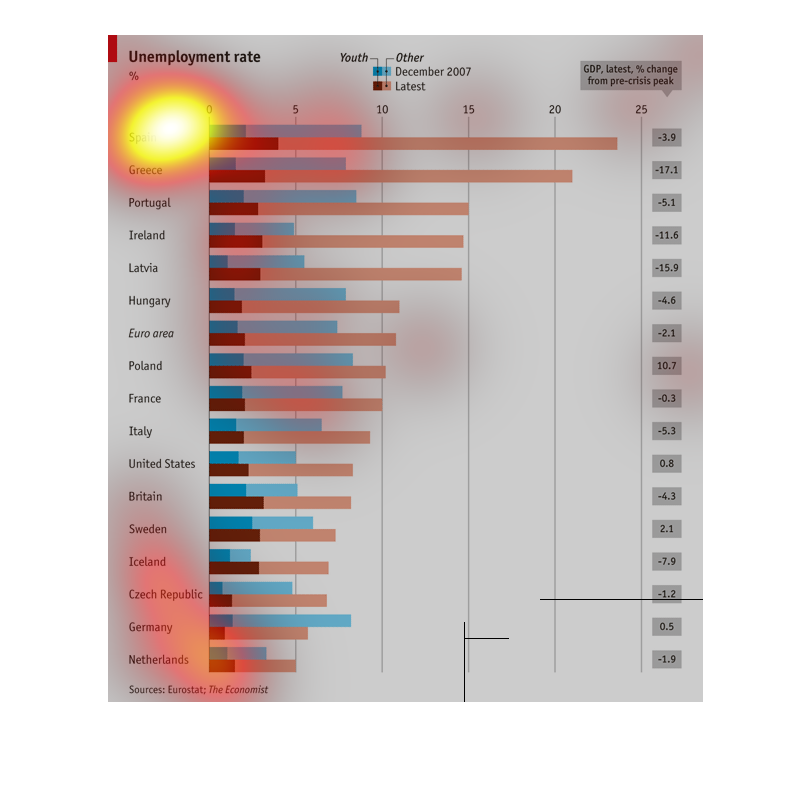
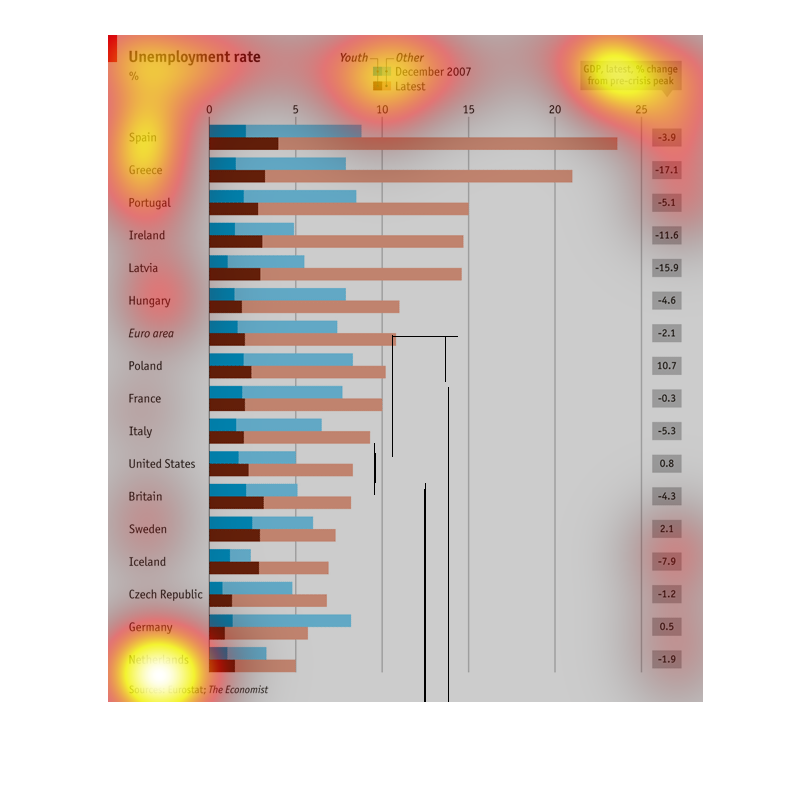
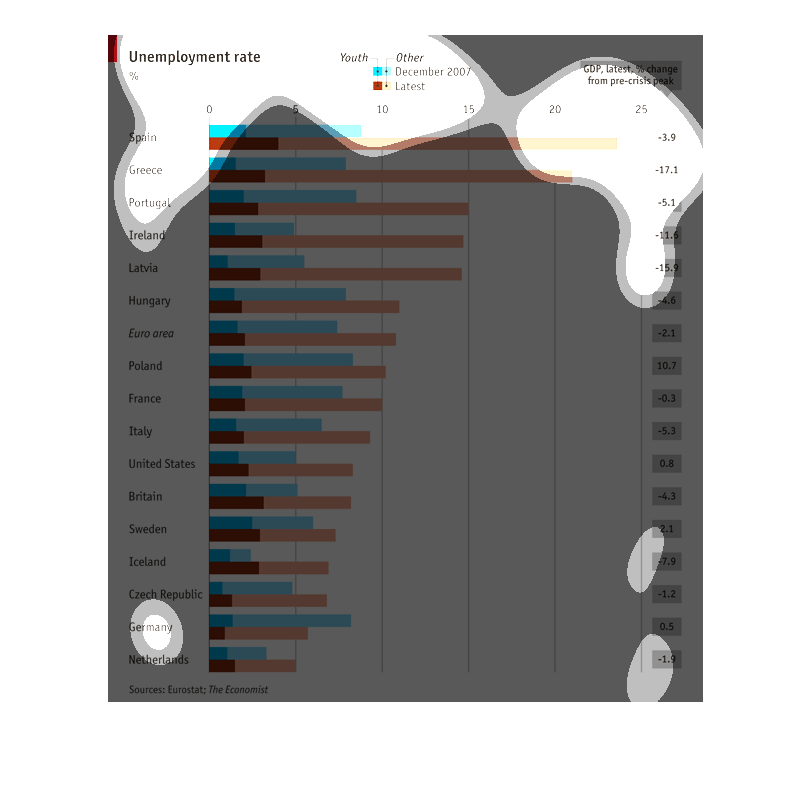
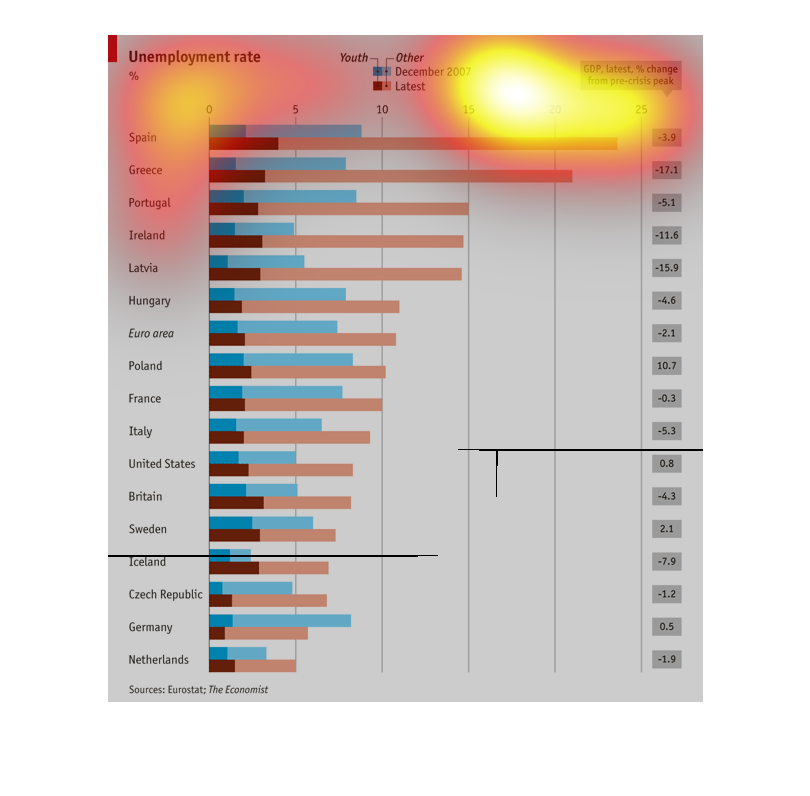
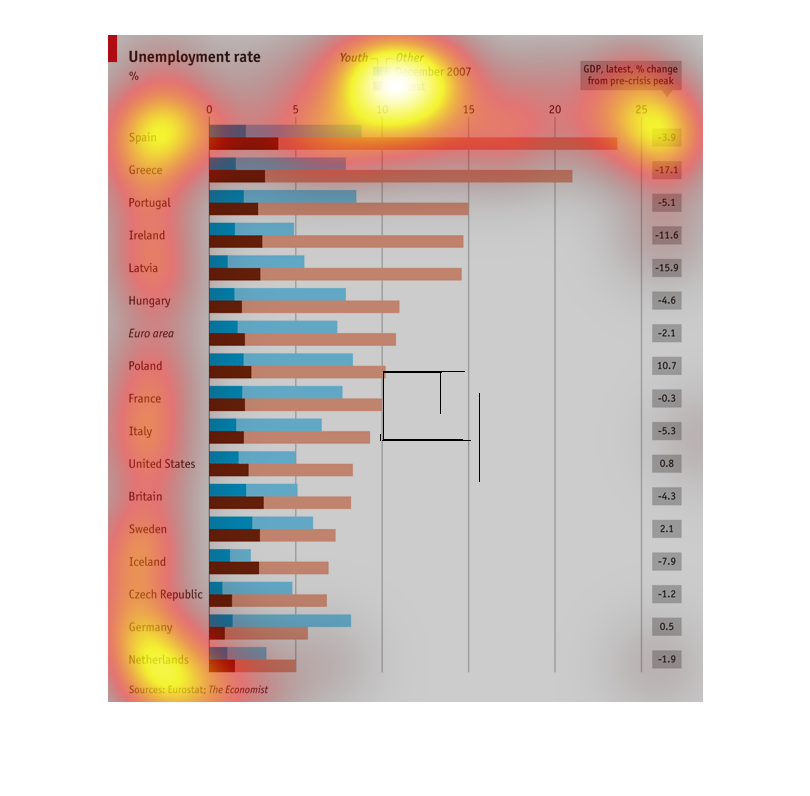
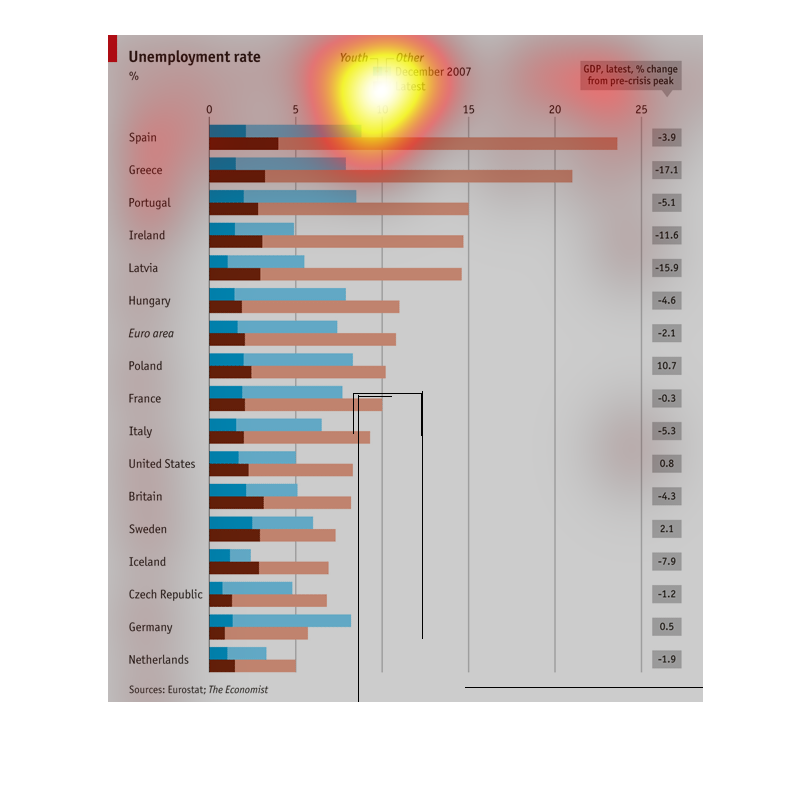
This graph is about Unemployment Rate coming from many developed nations such as Germany,
United States, Sweden, Netherlands, Iceland, France, Italy etc... The highest unemployment
rate to be recorded is Spain with a -3.9. The lowest unemployment rate stated is the Netherlands
with an admirable -1.9.
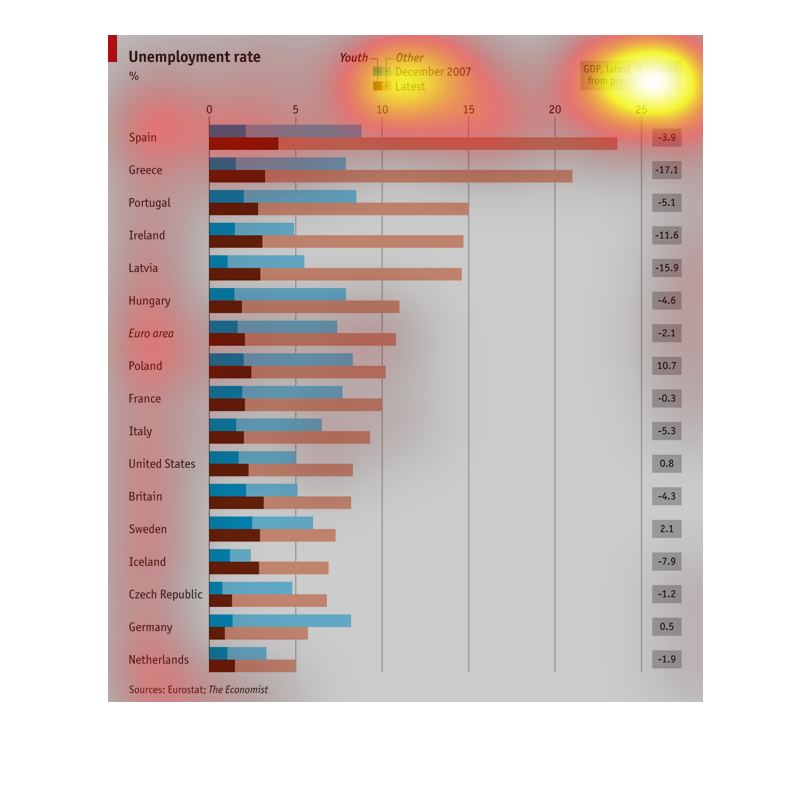
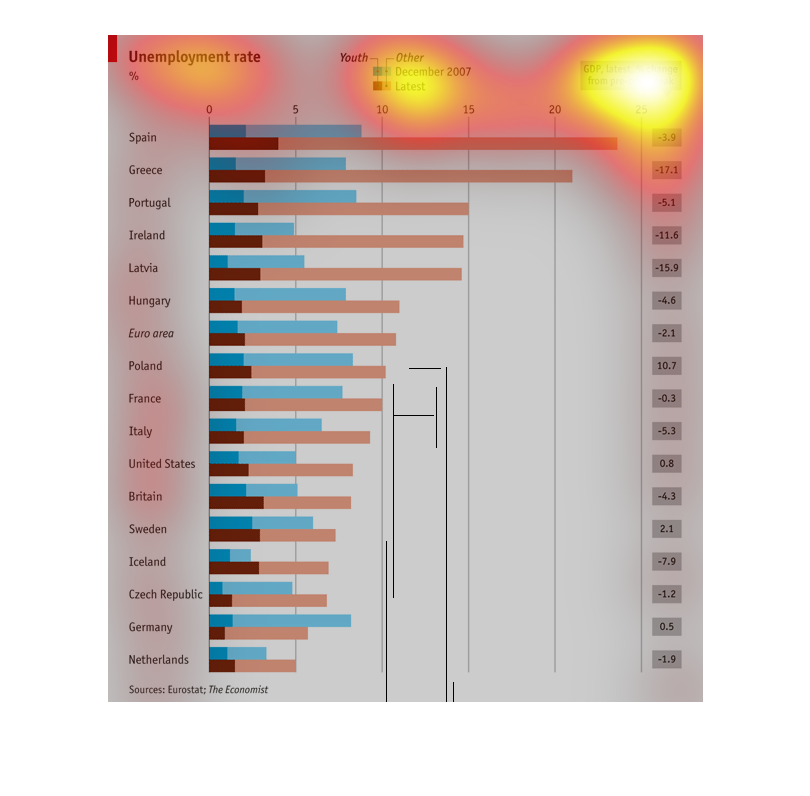
This chart shows the unemployment rate of younger workers in Europe and the United States
in December 2007 as compared to todays level, the chart also shows these percentages as a
pre- crisis level. Spain had the highest level of youth unemployment and the Netherlands had
the lowest unemployment rates.
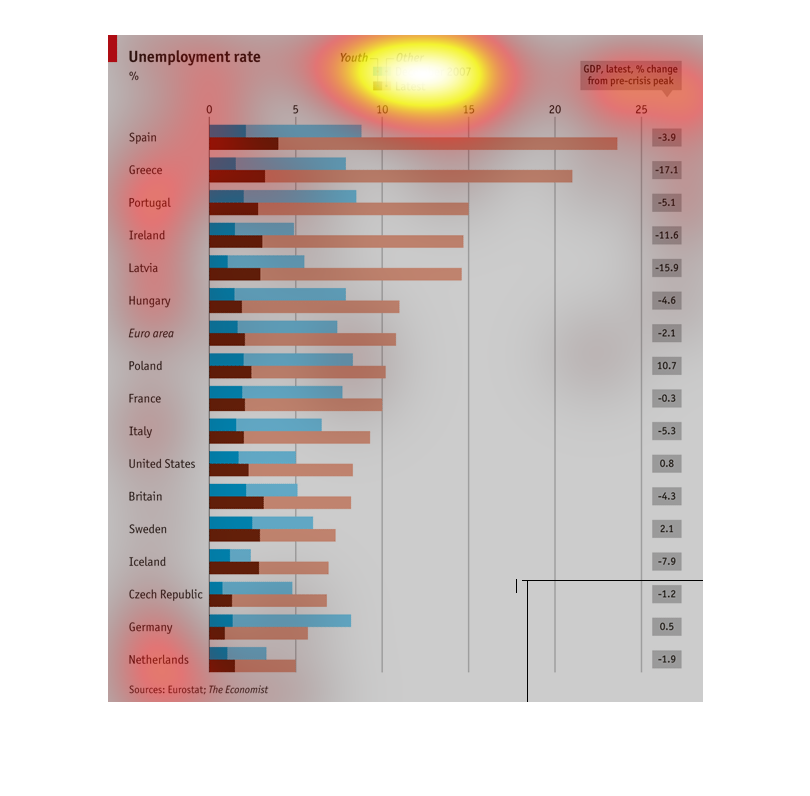
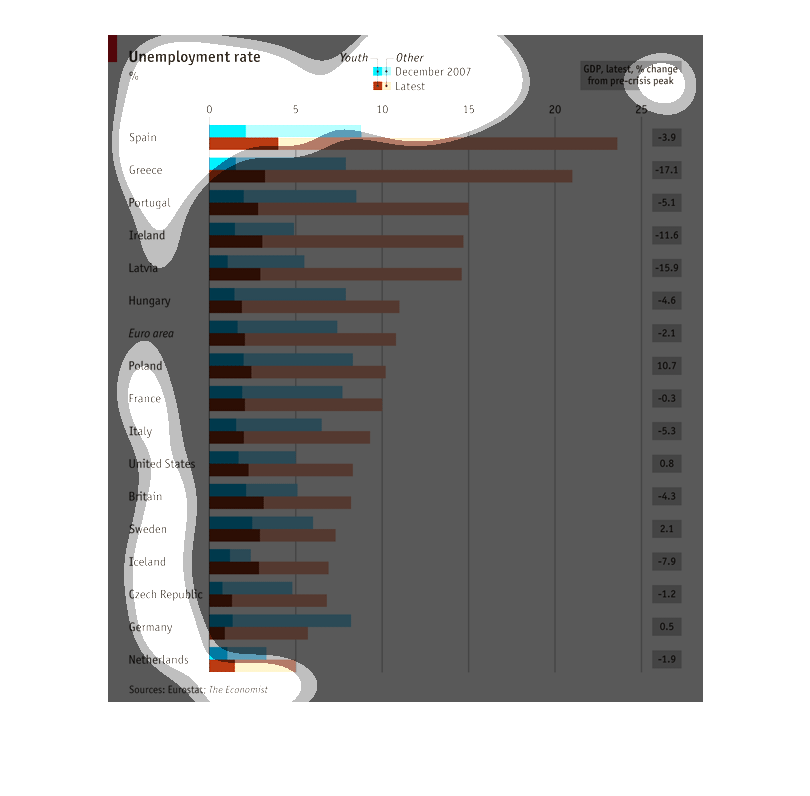
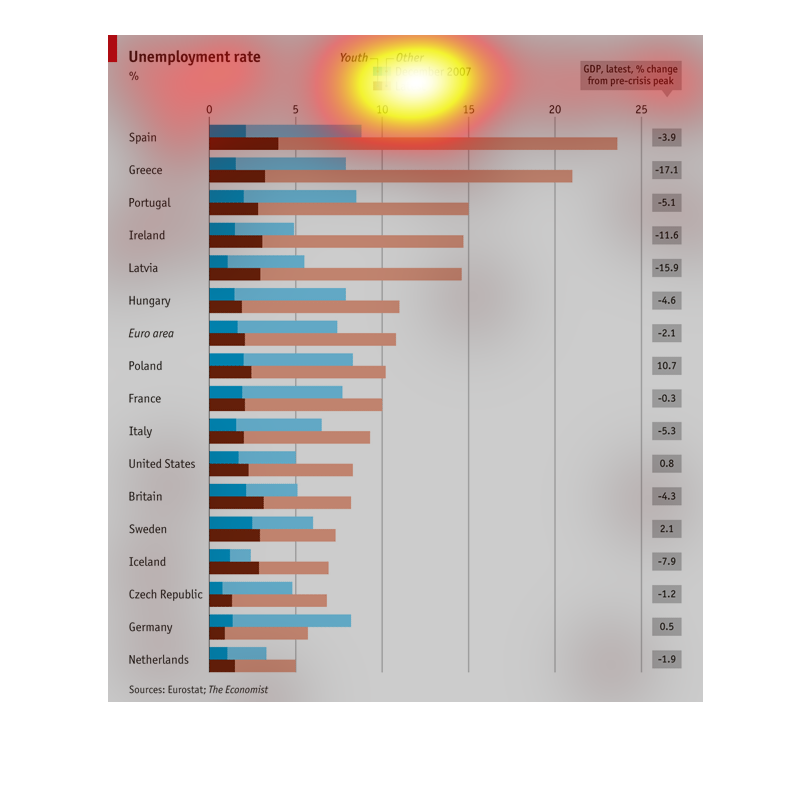
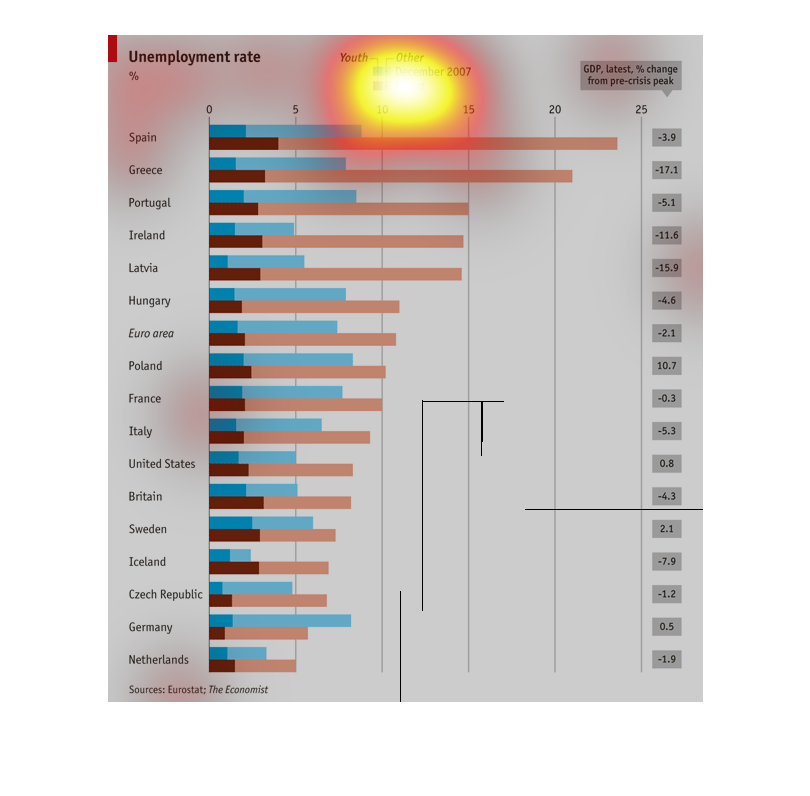
This graph shows the unemployment rate of various countries youth and "other". The blue bar
is the unemployment recorded in december and the brown bar is the unemployment as recoreded
"Latest"   It also shows the % change of the countries GDP
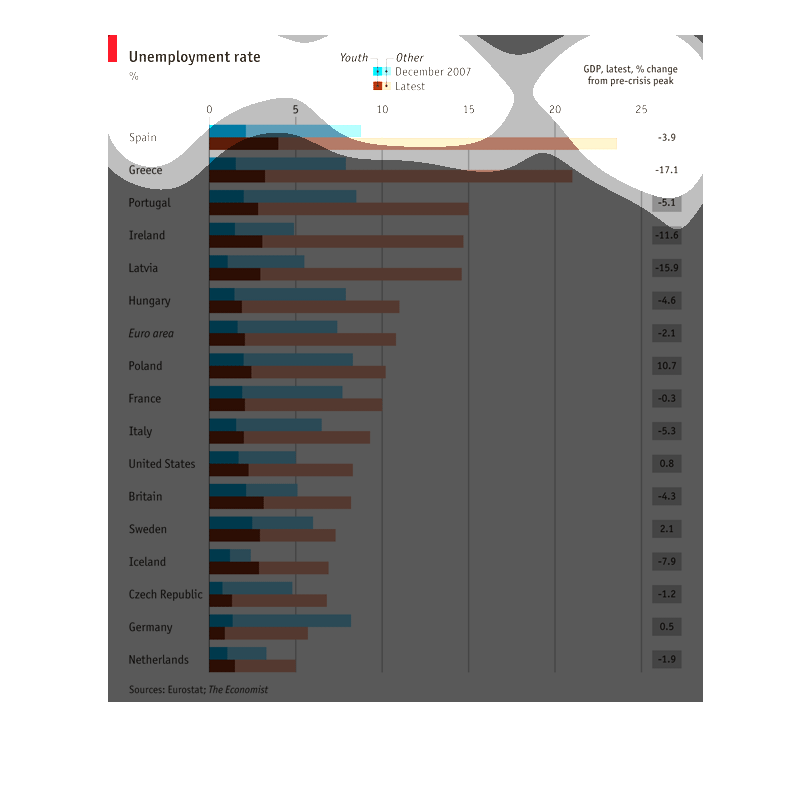
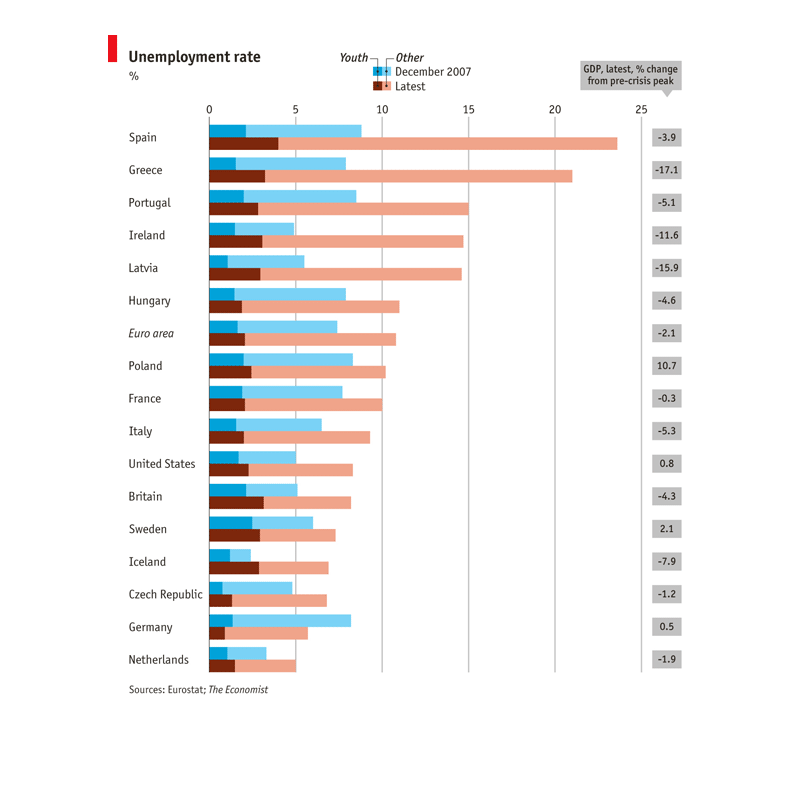
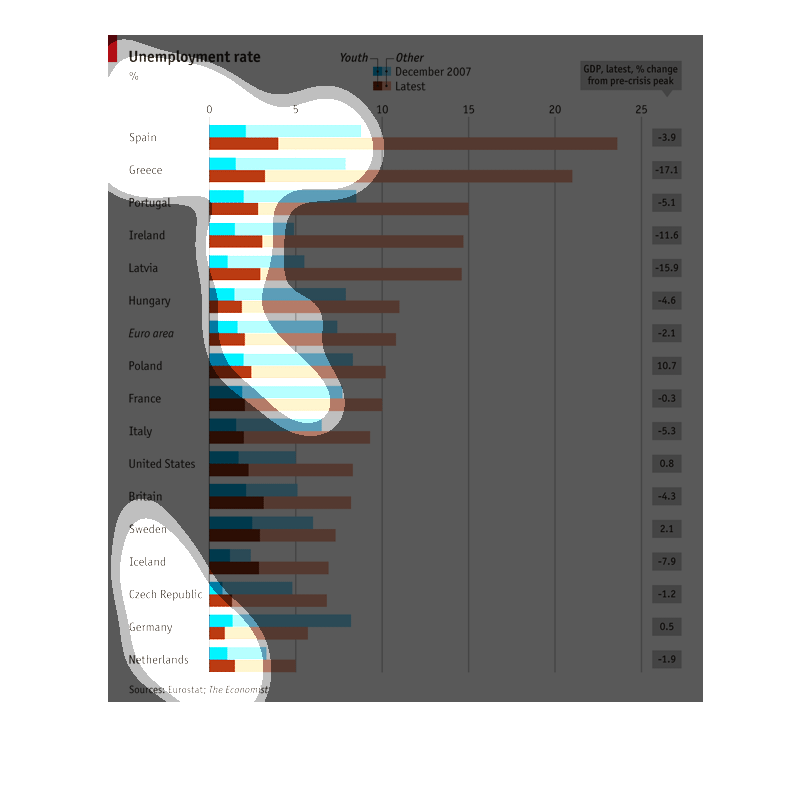
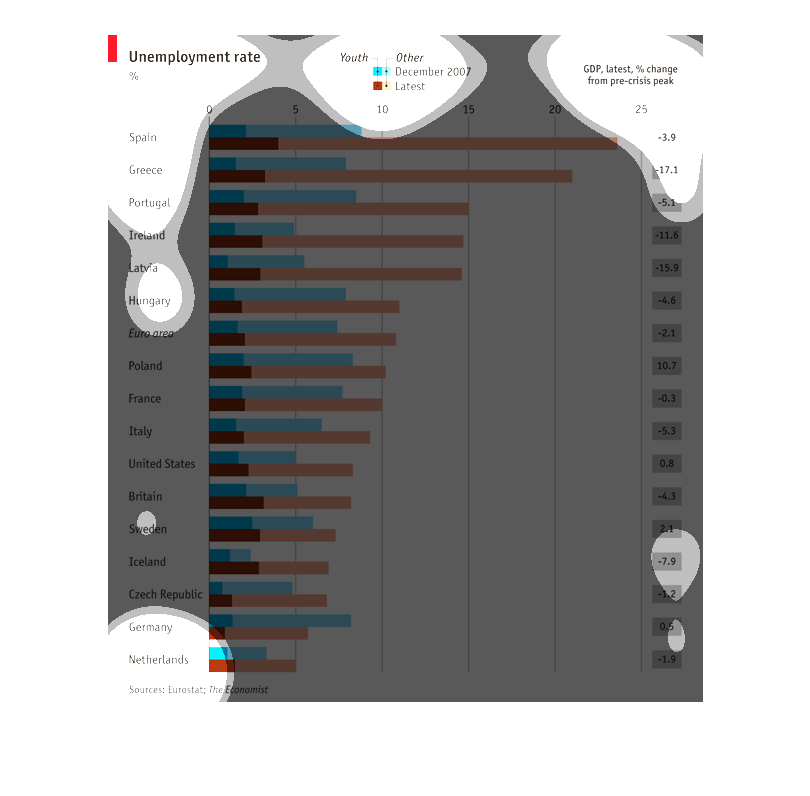
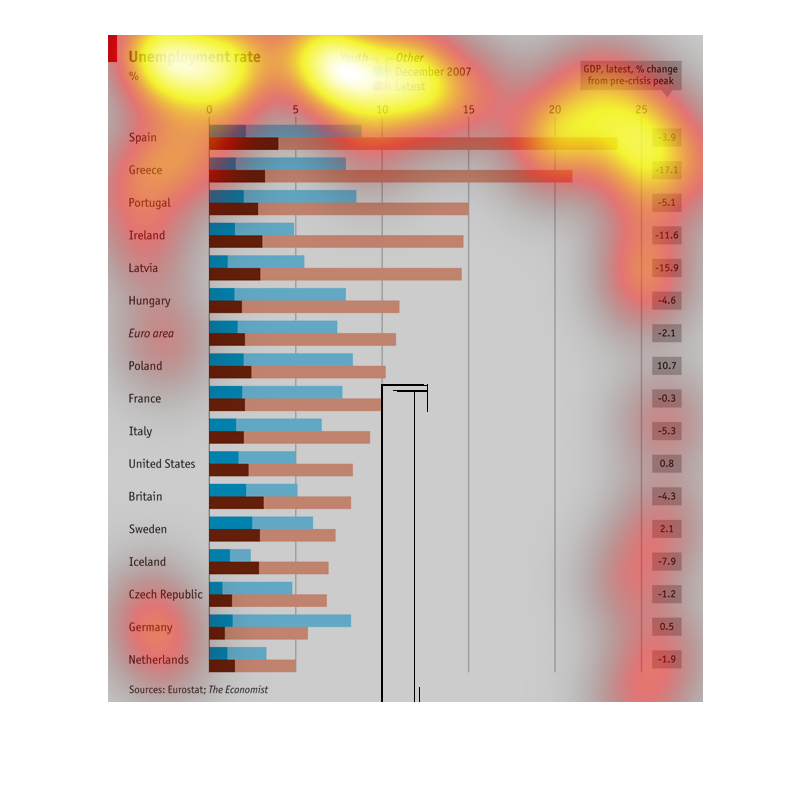
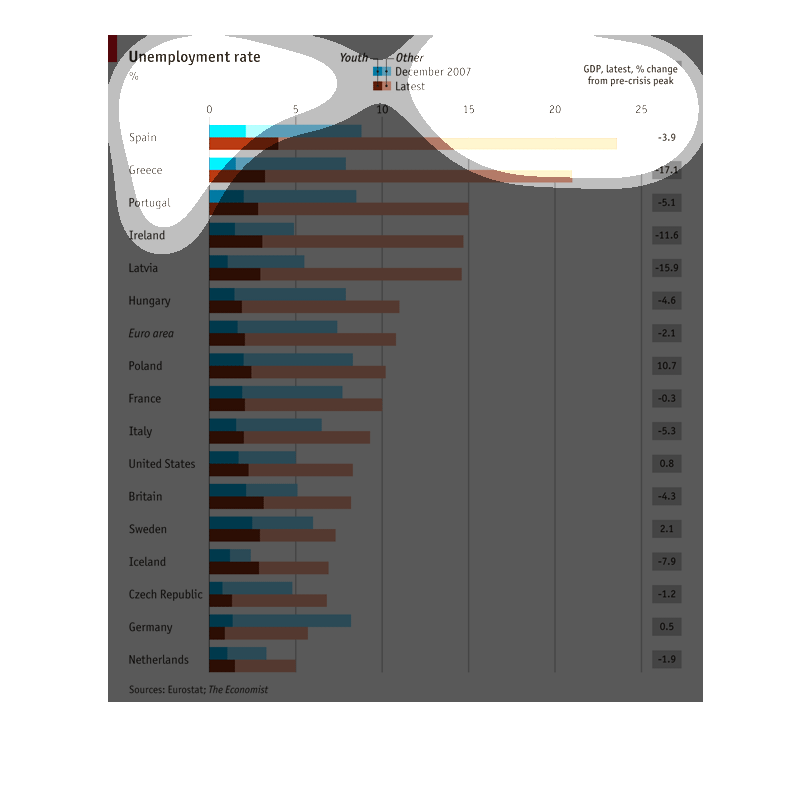
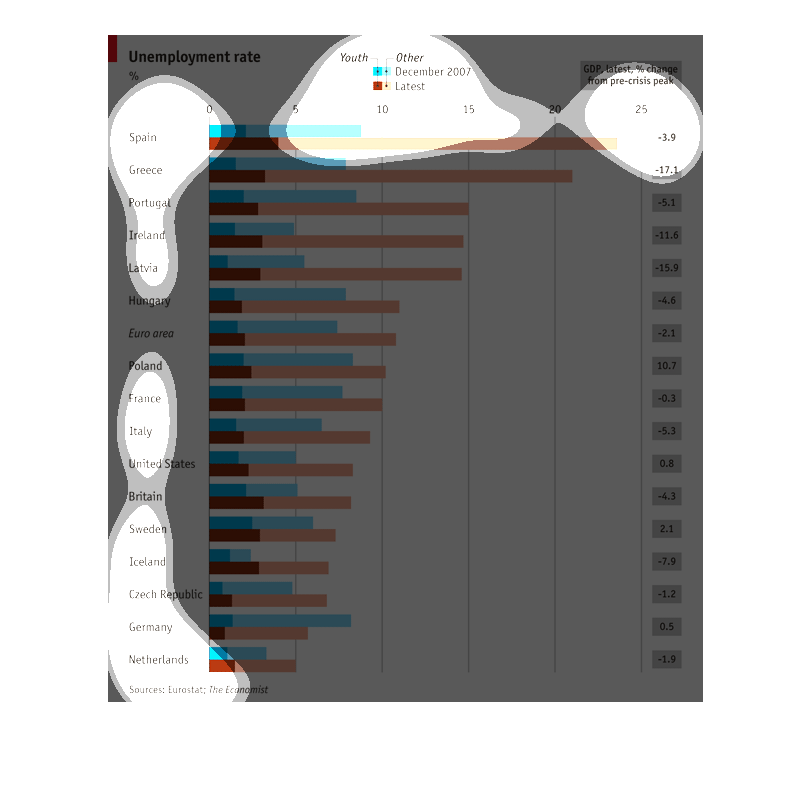
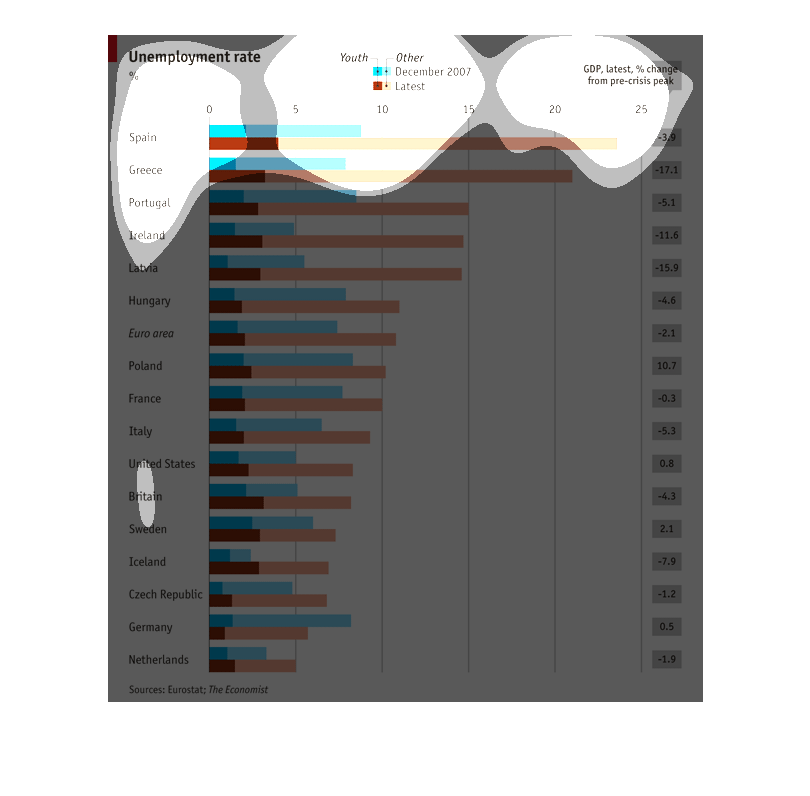
The graph shows the unemployment rates in 18 different countries comparing information from
December 2007 and the latest.  It lists youth unemployment and other unemployment.  Spain
is at the top of the chart and the Netherlands is at the bottom.  Sources include Eurostat
and The Economist.
This chart lists the unemployment rate for several countries with one bar representing December
2007 and the bar beneath it representing the current data.
The unemployment rate across several nations ranging from the U.S to Finland, to Spain and
Italy is displayed in this graph. The blue indicates December 2007. The red indicates the
latest data on unemployment.