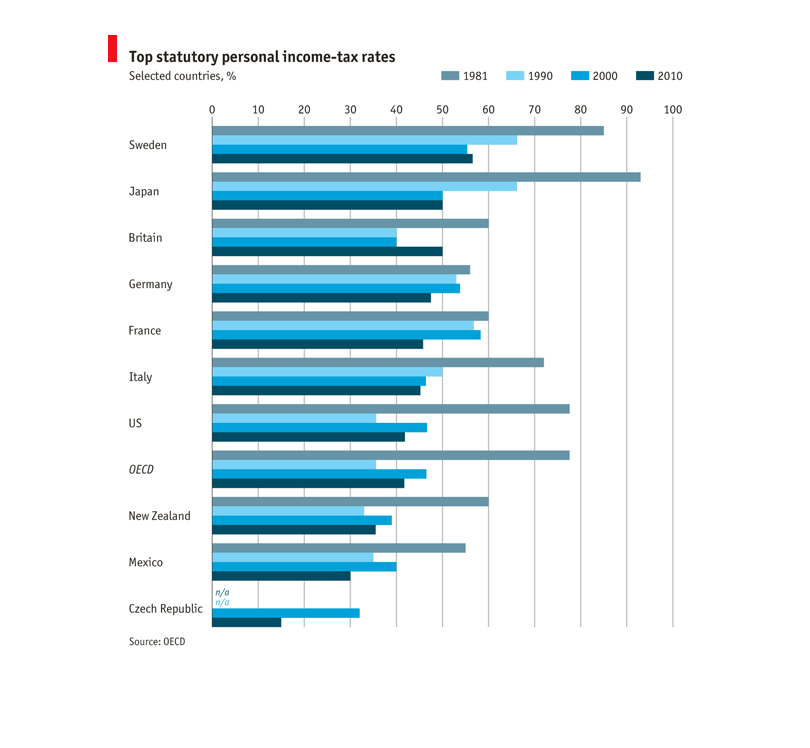
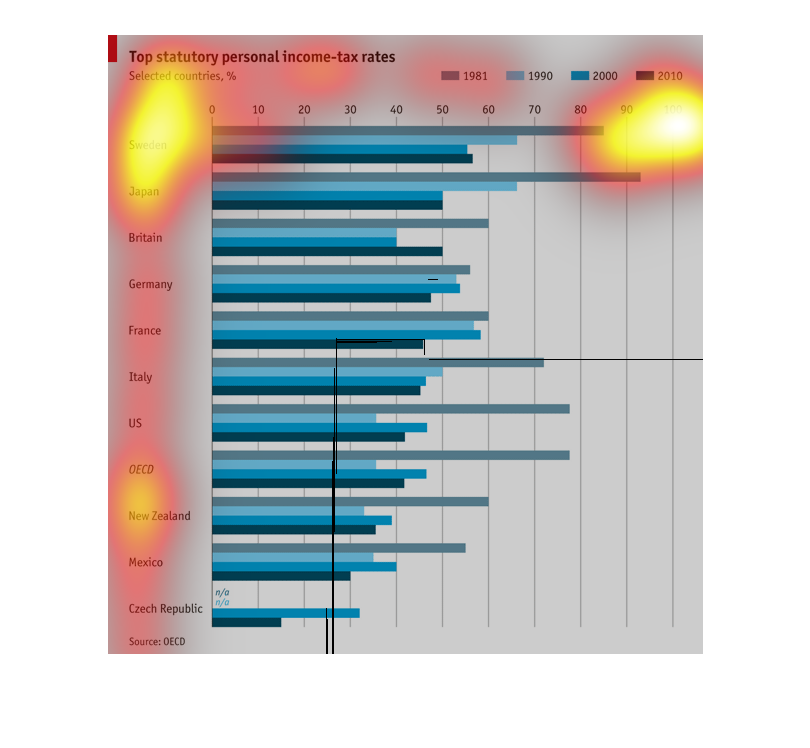
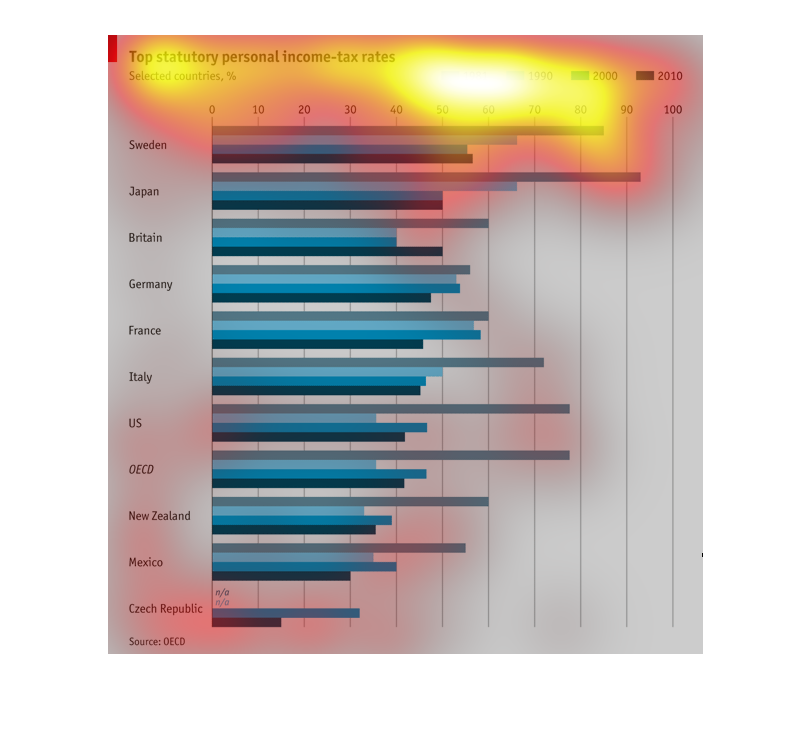
This graph shows the top tax rates by country, and by year from the 1980s to 2010.  Sweden
tops the list with the highest tax rates, where U.S is in the middle of the larger advanced
nations.
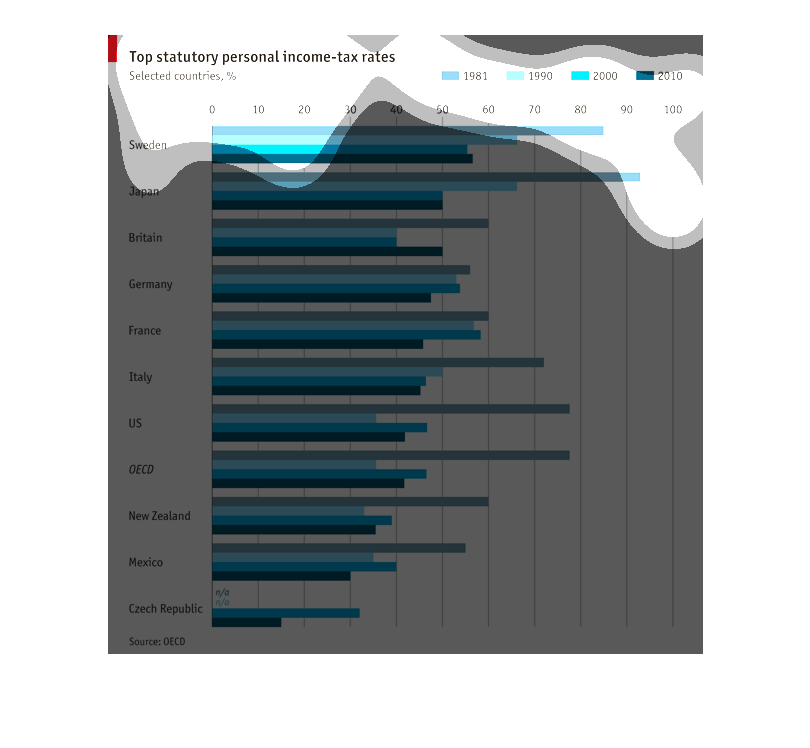
Top statutory personal income tax rates are the topic of this graph. A percentage is given
for selected countries. The graph covers select years from 1981 to 2010. Most years for most
countries are very similar to each other except 1981.
This is an image stating "top statutory tax rate". It compare from 1981-1990 the tax rates
for 11 countries including the US, Japan, and Sweden. They are ranked from 0-100.
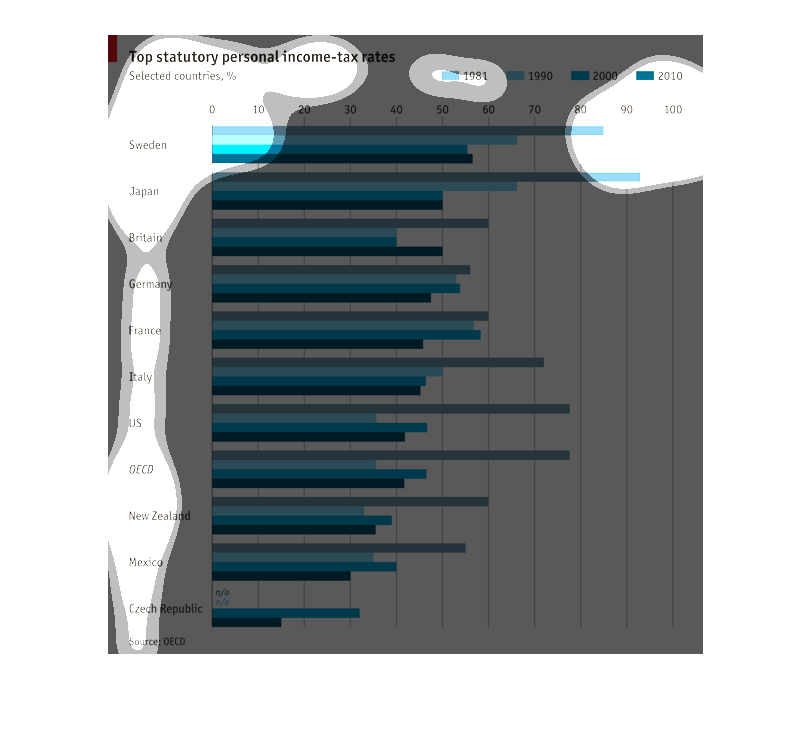
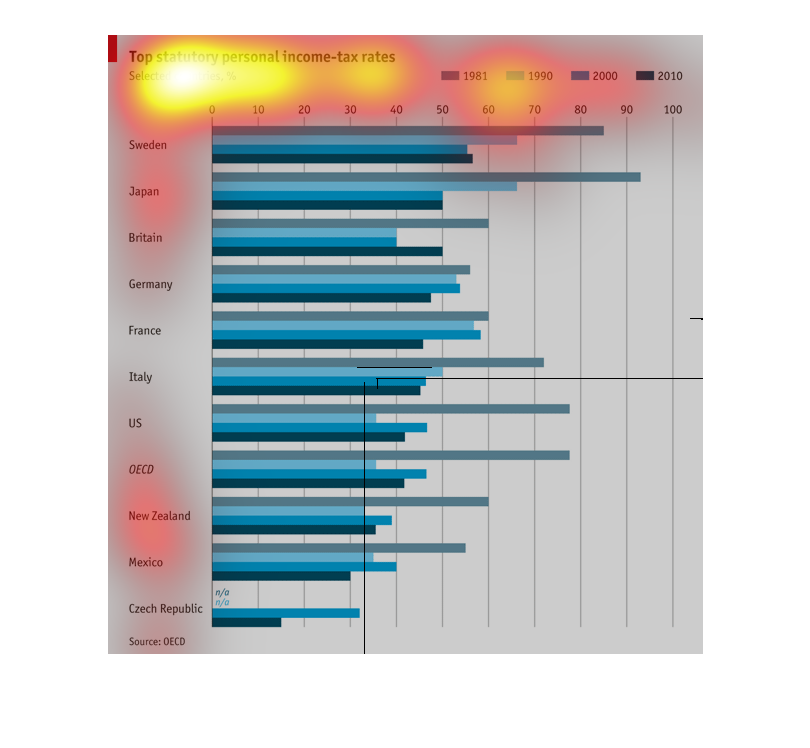
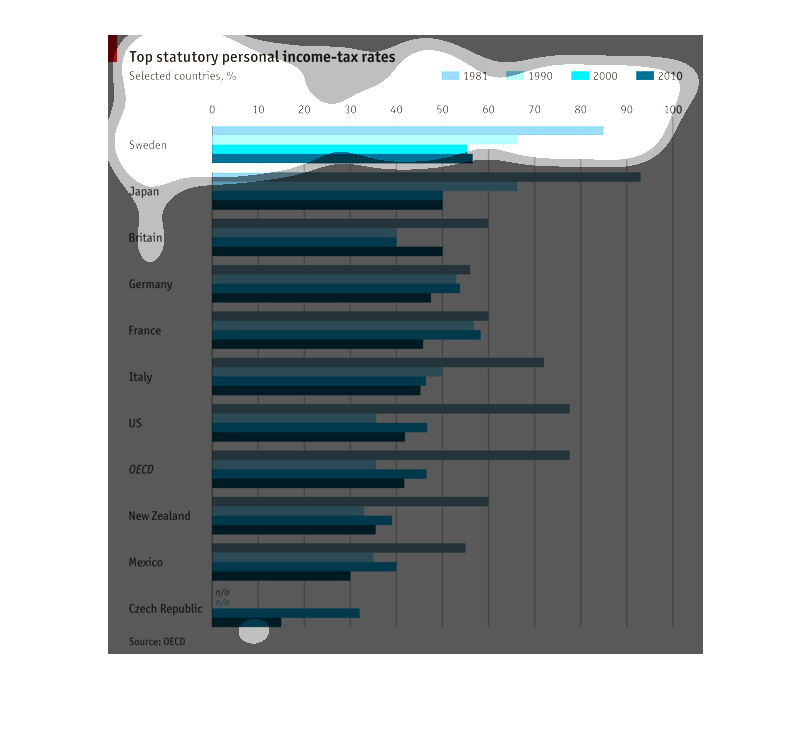
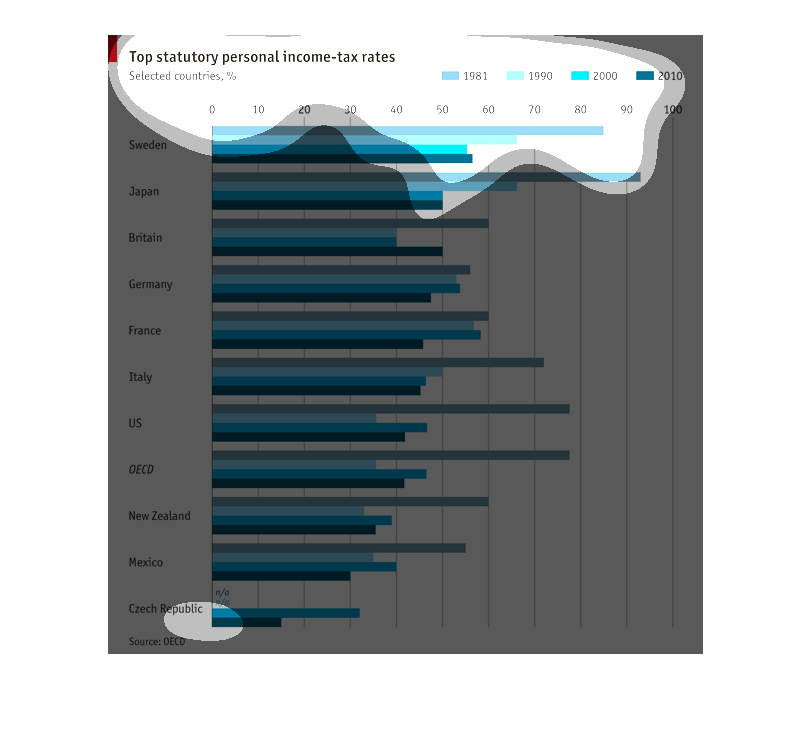
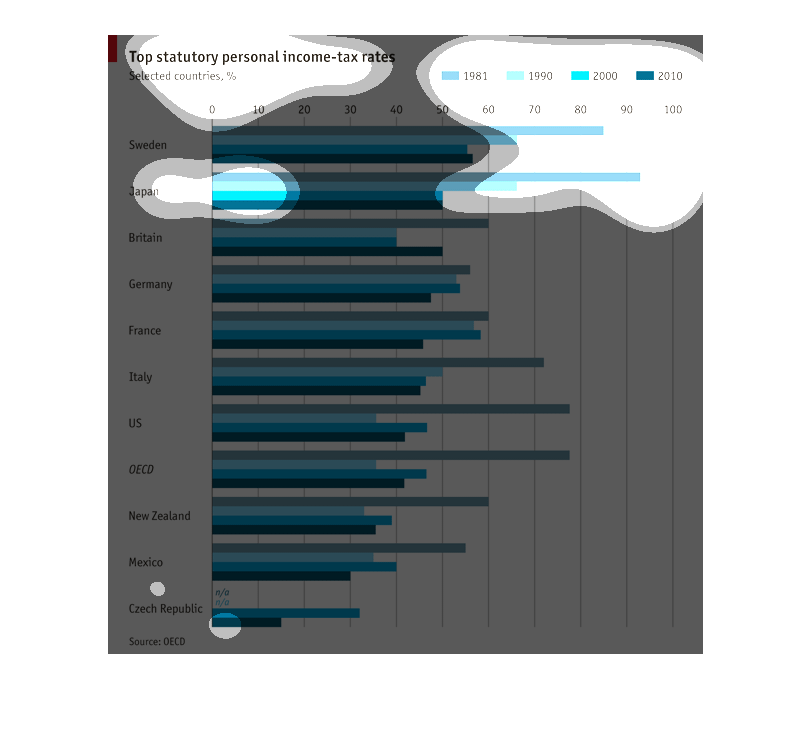
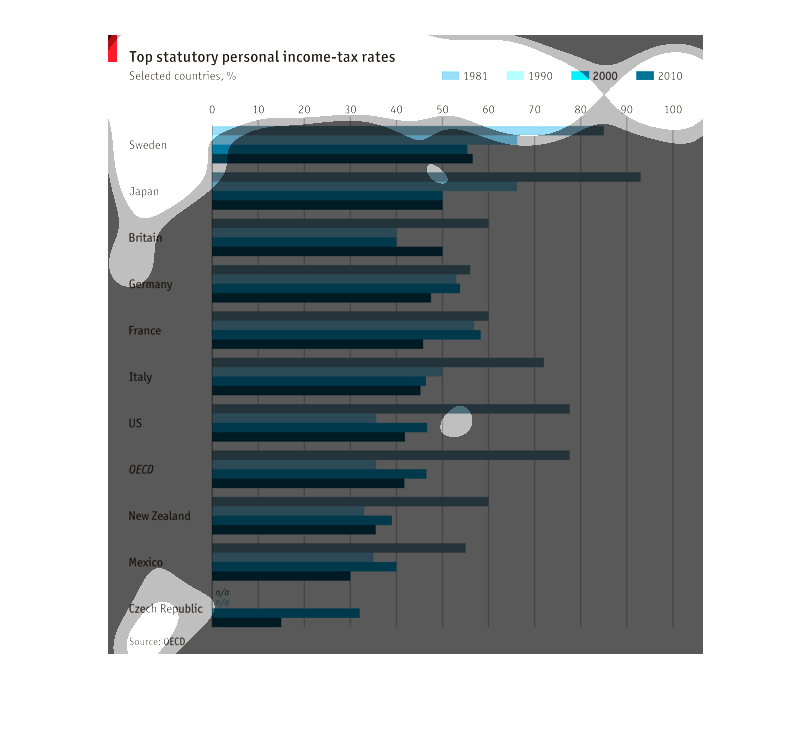
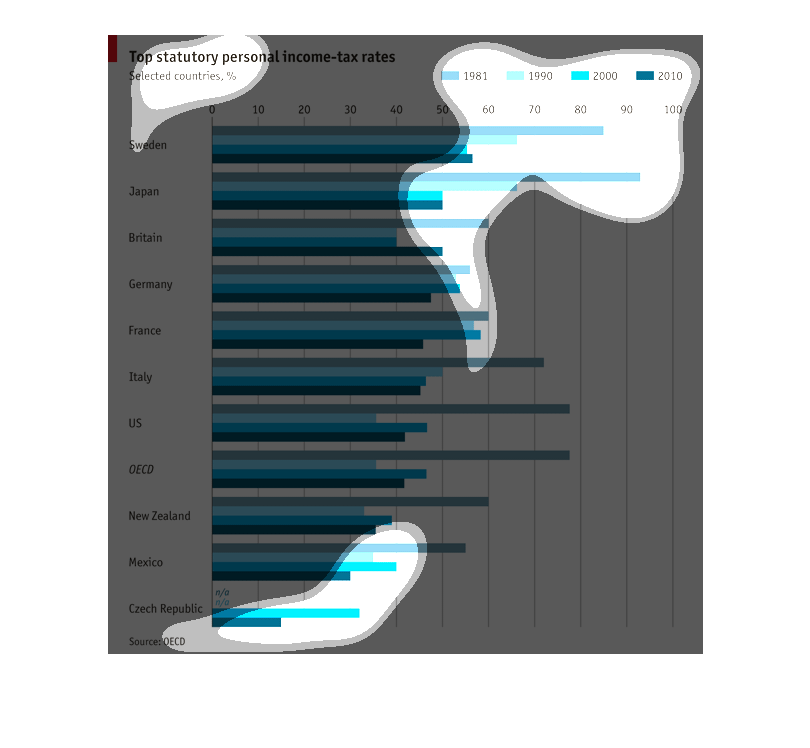
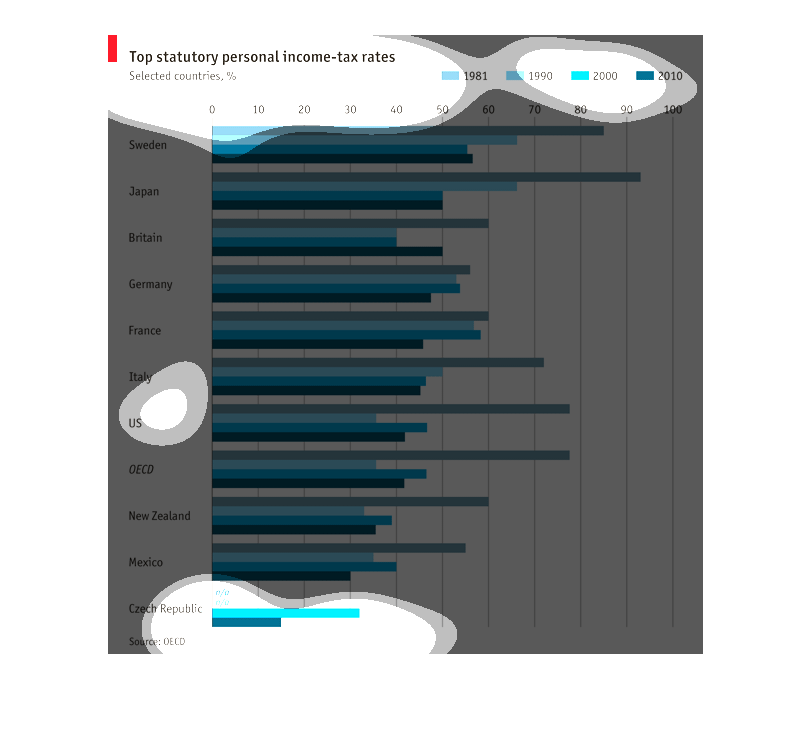
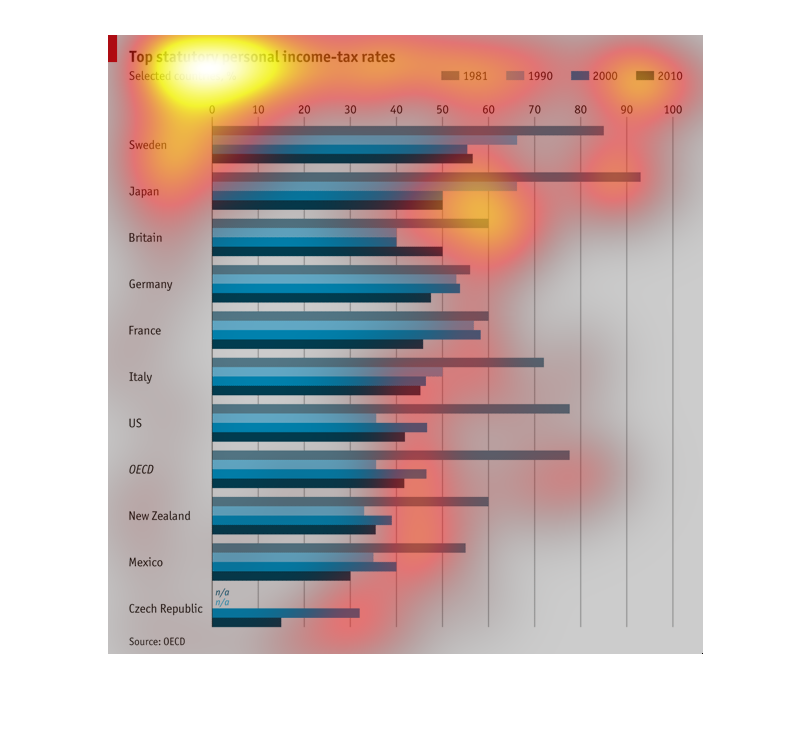
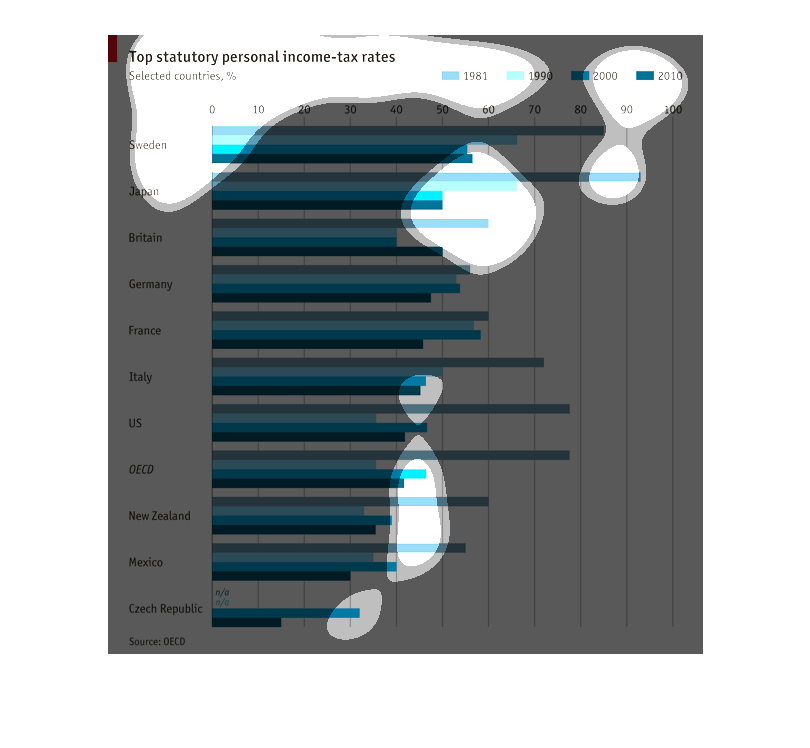
This chart is titled Top statutory personal income-tax rates. Sweden, Japan, Britain, Germany,
France, Italy, US, OECD, New Zealand, Mexico, and Czech Republic are all included. 1981, 1990,
2000 and 2010 are the years represented.
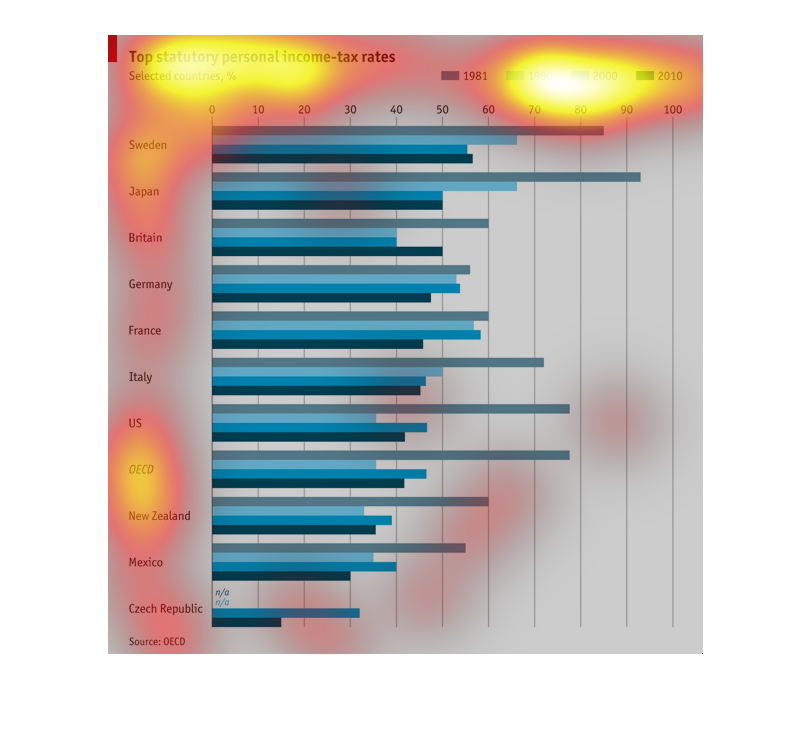
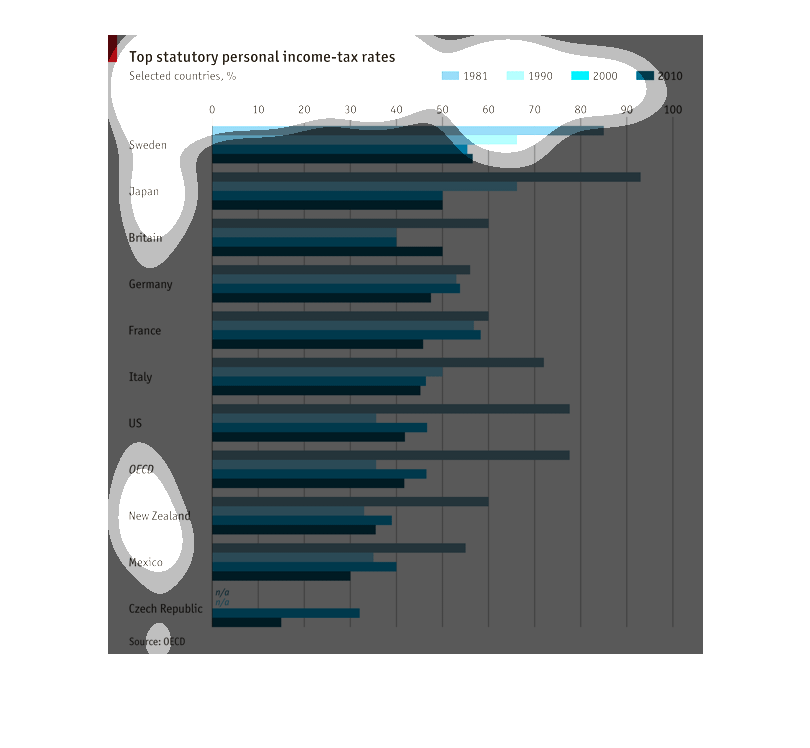
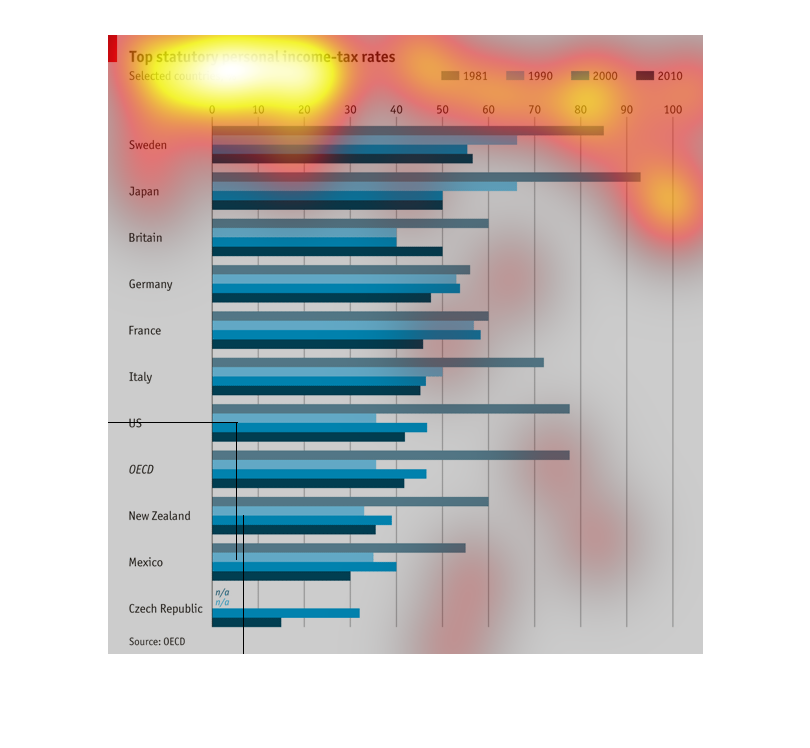
This bar graph represents the top statuatory personal income-tax rates for selected countries.
 The bars in colors represent years 1981,  1990, 2000, 2010.  The data in the graph suggests
that personal incom tax rates have dropped sharply from 1981 to 2010.
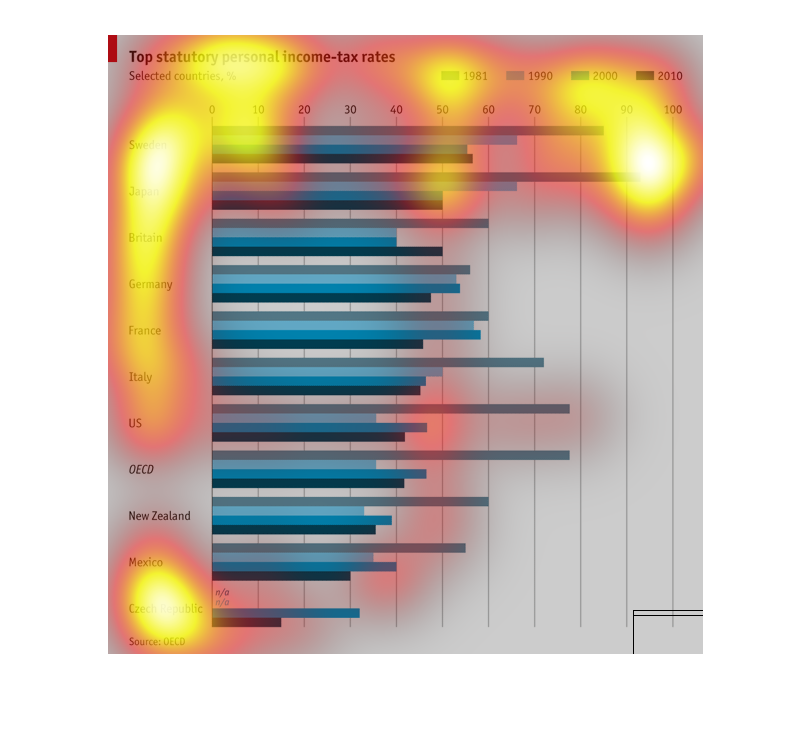
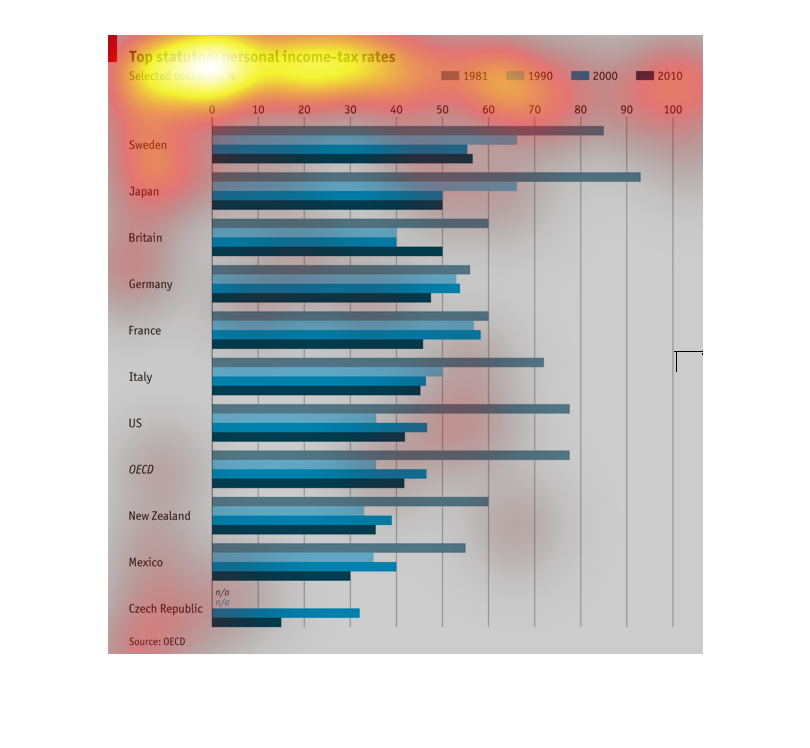
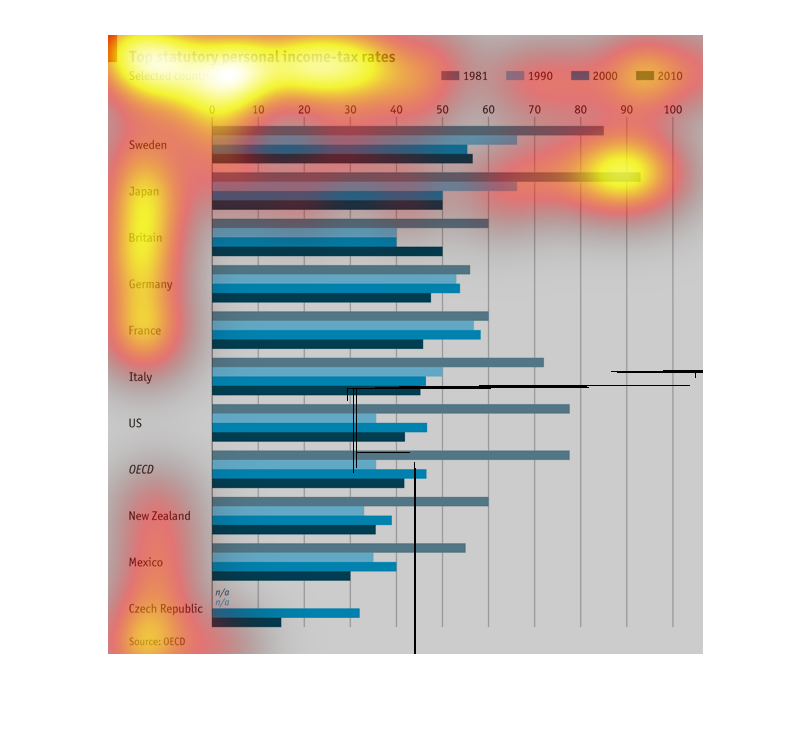
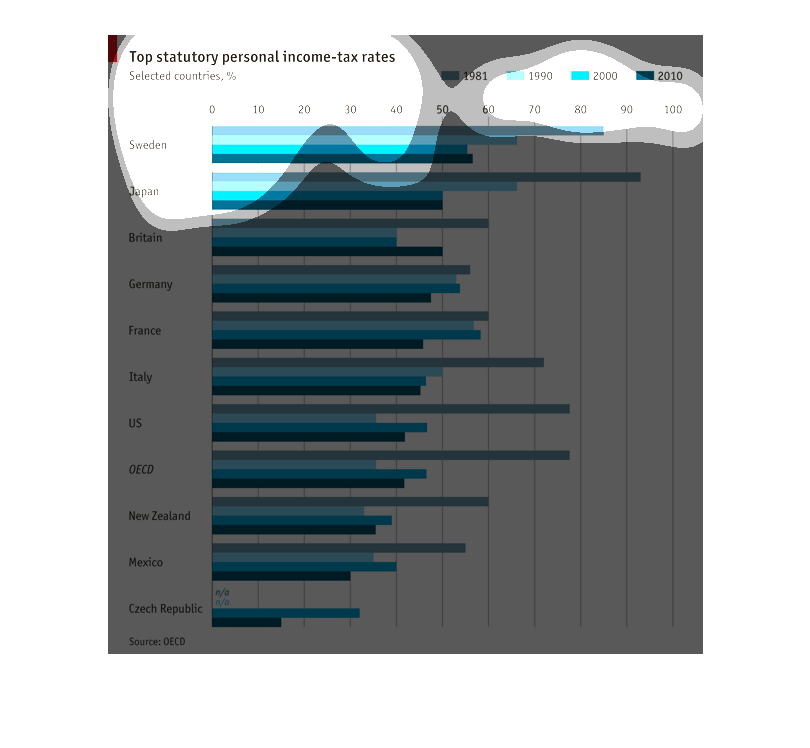
This chart describes trends in the statutory personal income tax rates between 1981 and 2010
in several different countries. According to this graph, Japan currently has the highest statutory
income tax rate of over 90%, which is a large increase since the beginning of the 21st century.
Since 2000, statutory income tax rates in many countries has increased substantially. The
United States ranks 7th in this list, but demonstrates a rate that is currently much lower
than comparable countries.
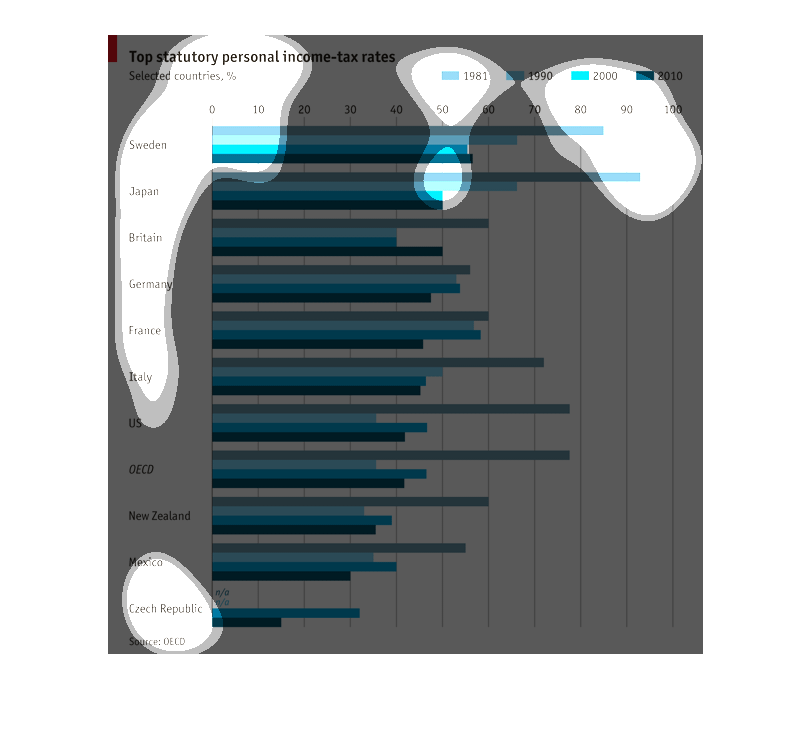
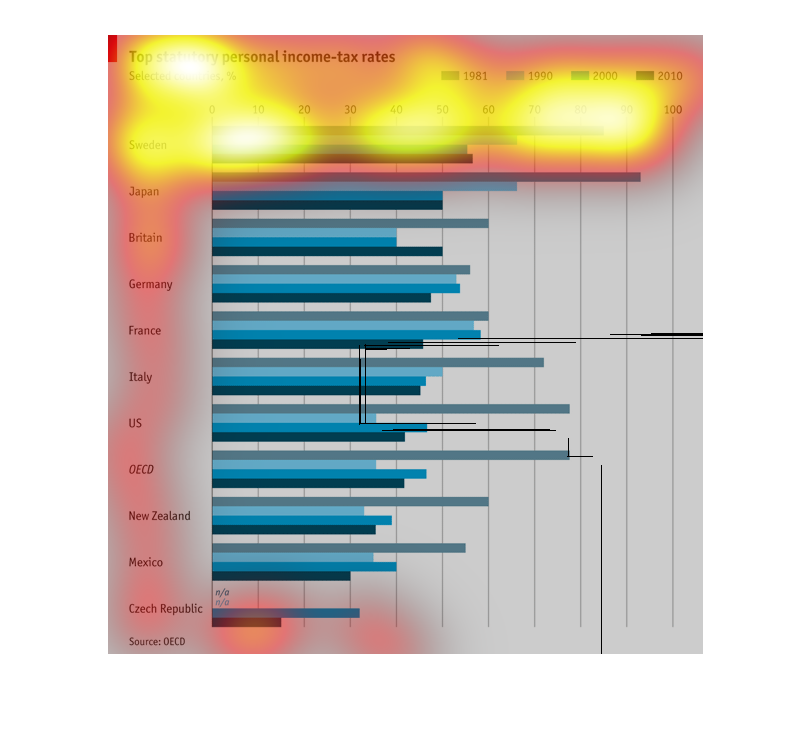
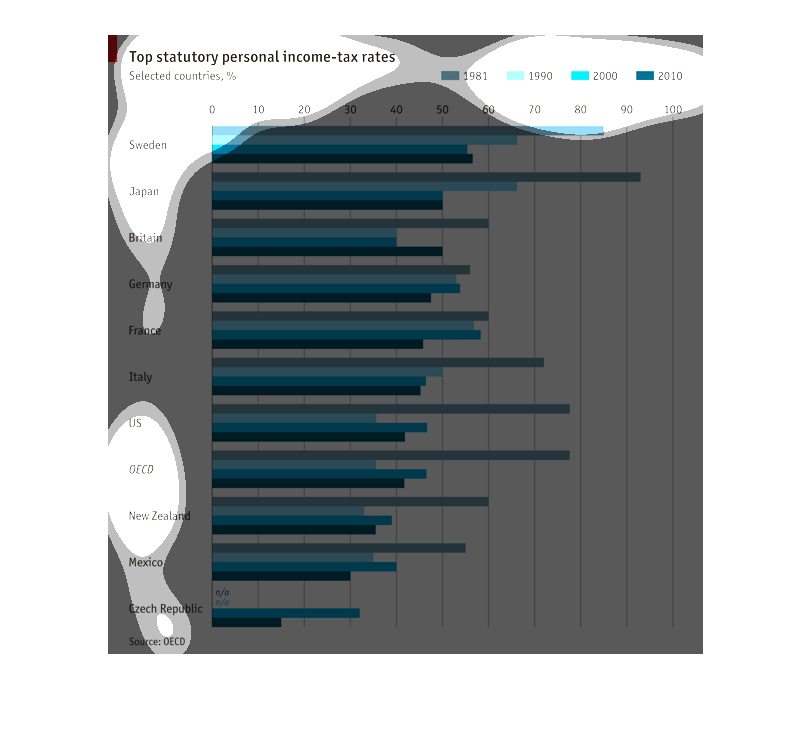
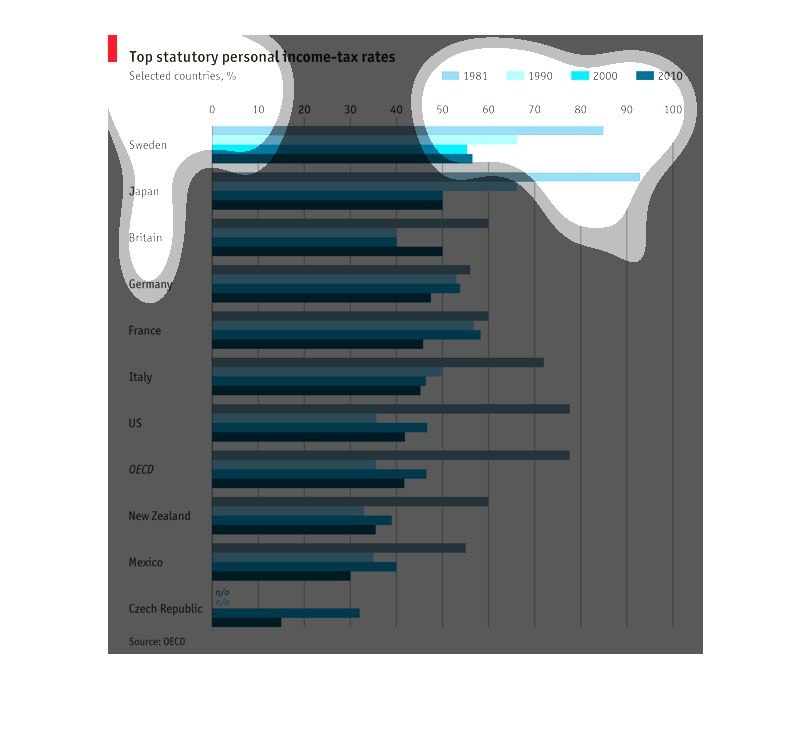
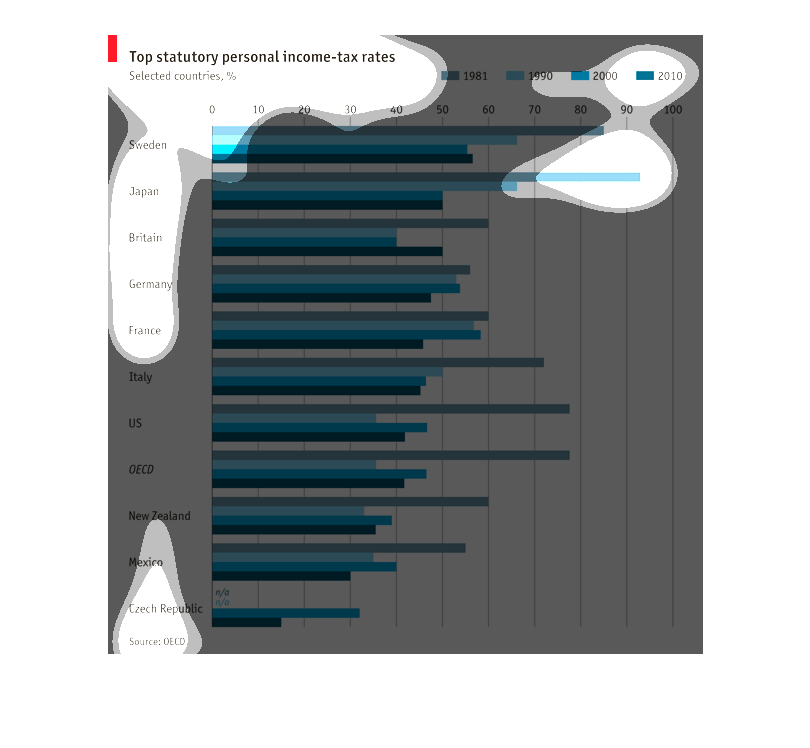
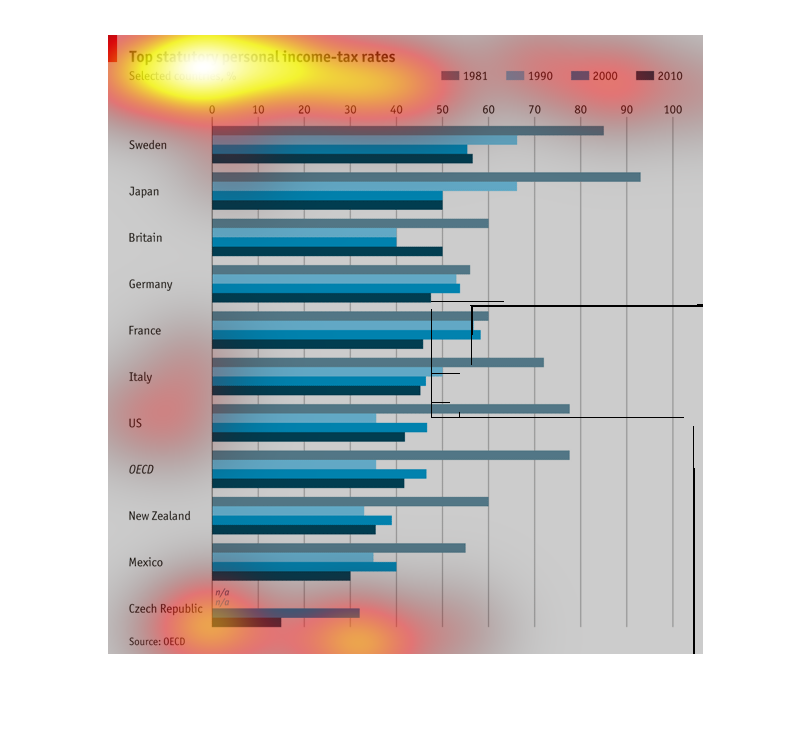
This shows the top statutory personal income rates in 1981, 1990, 2000, and 2010 in various
countries throughout the world. The highest by far is Japan in 1981 at nearly 100%; the lowest
is Mexico in 2010 at around 30%.
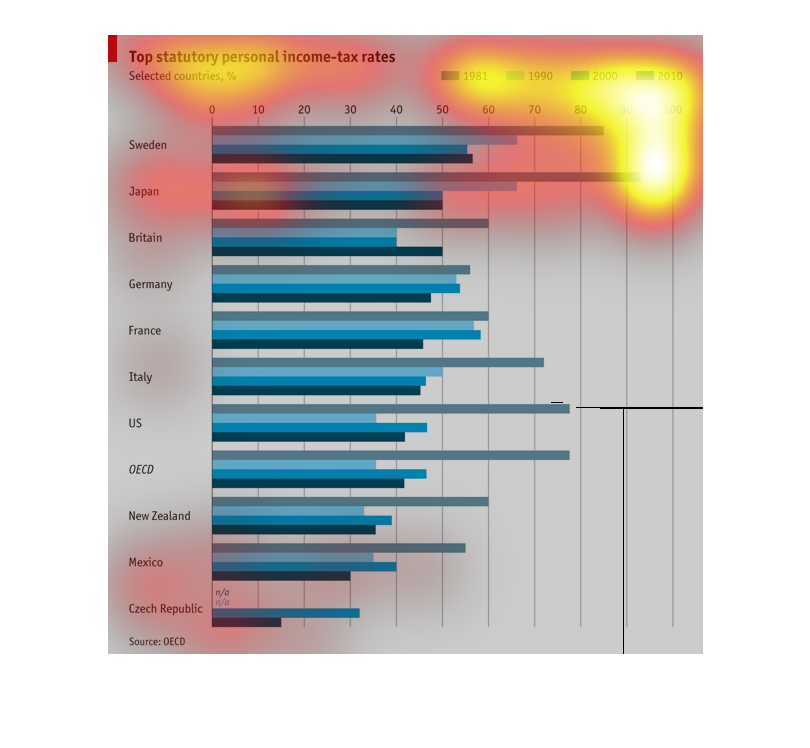
This chart shows the top statutory income tax rate percentages of different nations in years
1981, 1990, 2000 and 2010. In 1981 the year Japan had the highest percent of statutory income
tax rate.
The graph is titled Statutory personal income tax rates on the top left-hand corner of the
graph.  There are a selected number of countries which proceed down the left column of the
graph.  The years covered in this graph are 1981-2010.
The bar graph reflects the top statutory personal income and tax rates of eleven countries
for year 1981, 1990, 2000 and 2010.  For 2010 Japan showed a significant increase.
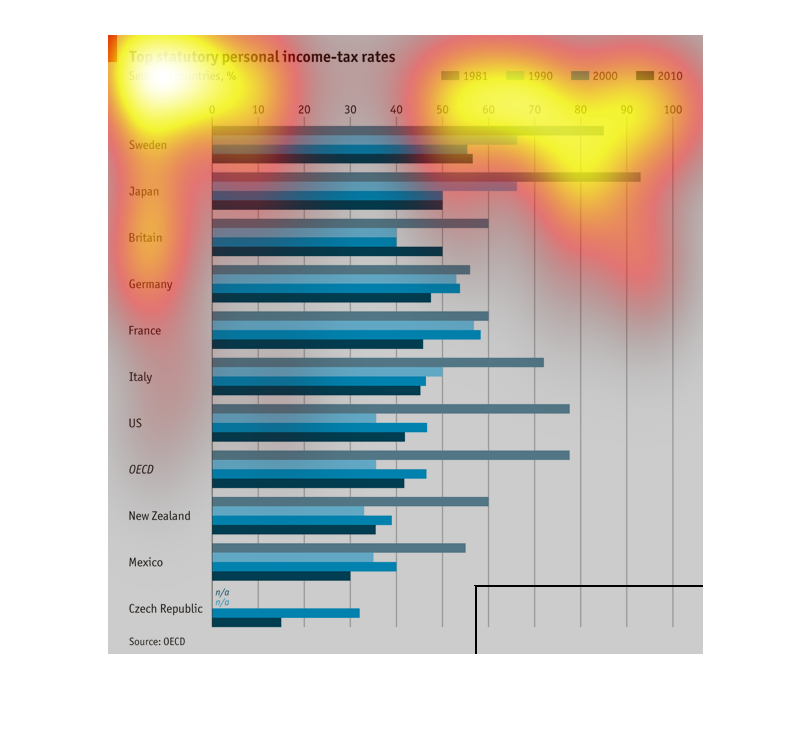
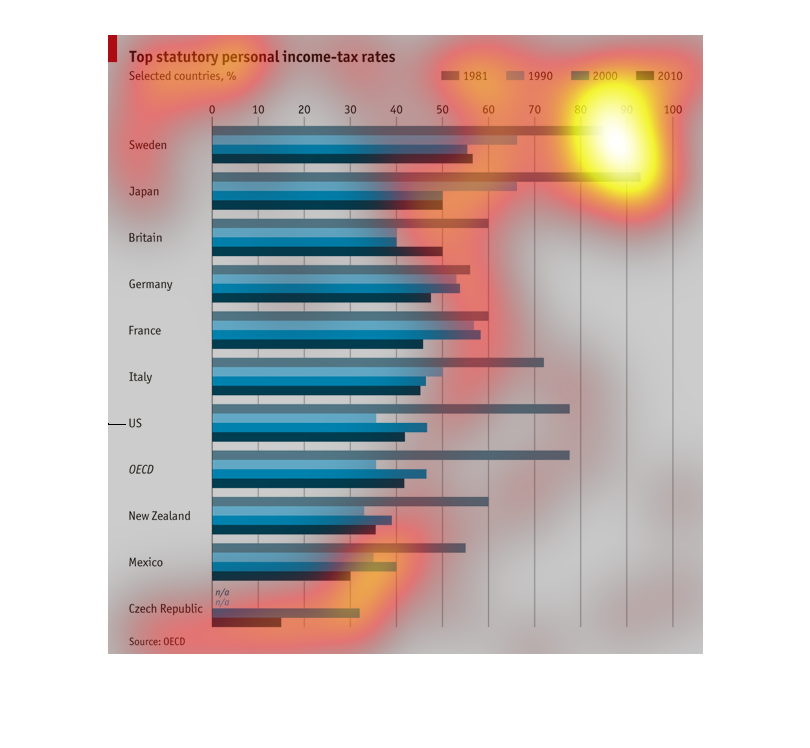
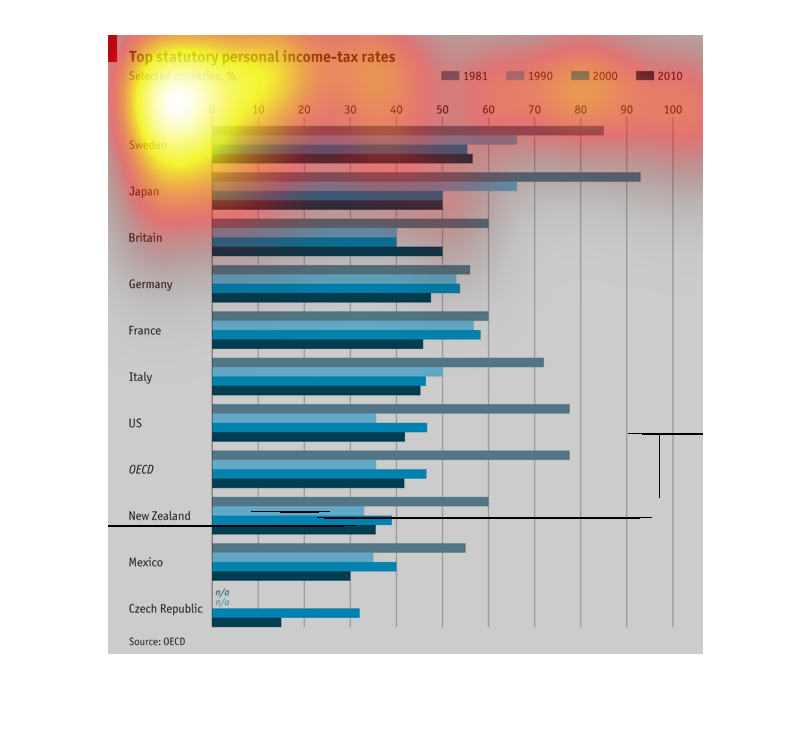
The chart shows the top statutory personal income-tax rates for various nations at specific
time points: 1981, 1990, 2000, and 2010. The Czech Republic consistently has the lowest personal
income-tax rates of the nation's listed (less than 30%), whereas Sweden and Japan are amongst
the highest (with numbers approximately at 90%). Also of note is that in general, the tax
rates of 2010 in every nation are lower than that of 1981, though there are diverse fluctuations
amongst the nations listed in the decades between those years. The source of the information
in this chart is OECD.
This bar graph describes the top statutory personal income-tax rates of different countries
within the years of 1981, 1990, 2000, and 2010; all measured in percents.
This graph shows the top statutory  personal income tax rates for different countries. Different
tax rates are displayed for different years in the 1990's .
This chart shows top statutory personal income- tax rates over 4 decades. Personal tax rate
have seem to fall over the the last 40 years. With Japan having a significant drop.
On this chart, the top statutory personal income tax rates of approximately 12 countries are
listed. The rates for the years 1981, 1990, 2000 and 2010 are included.