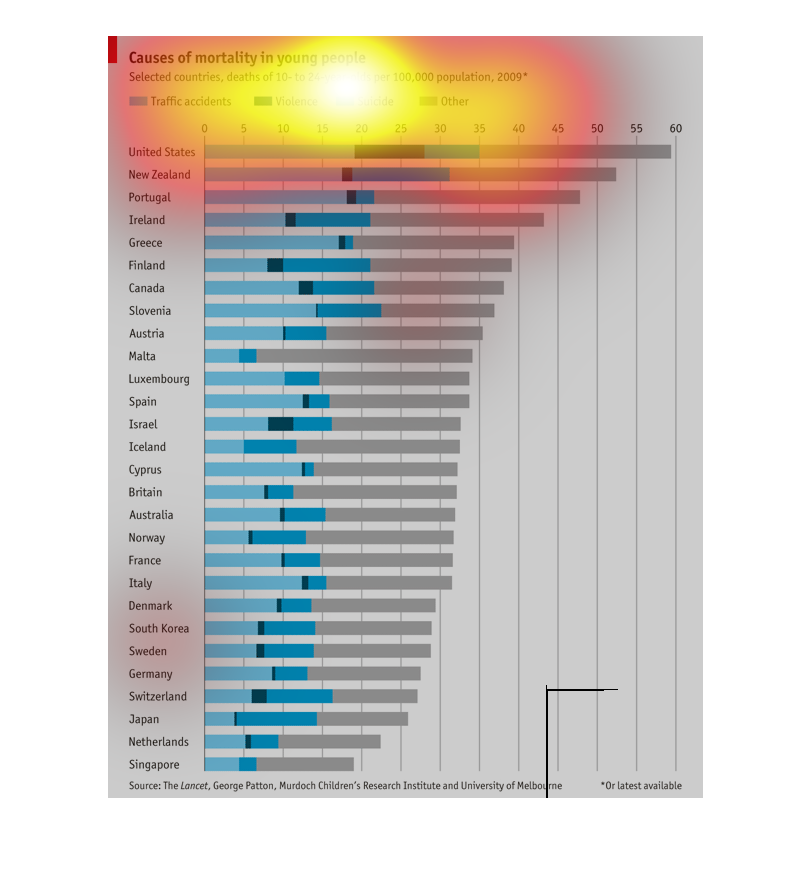
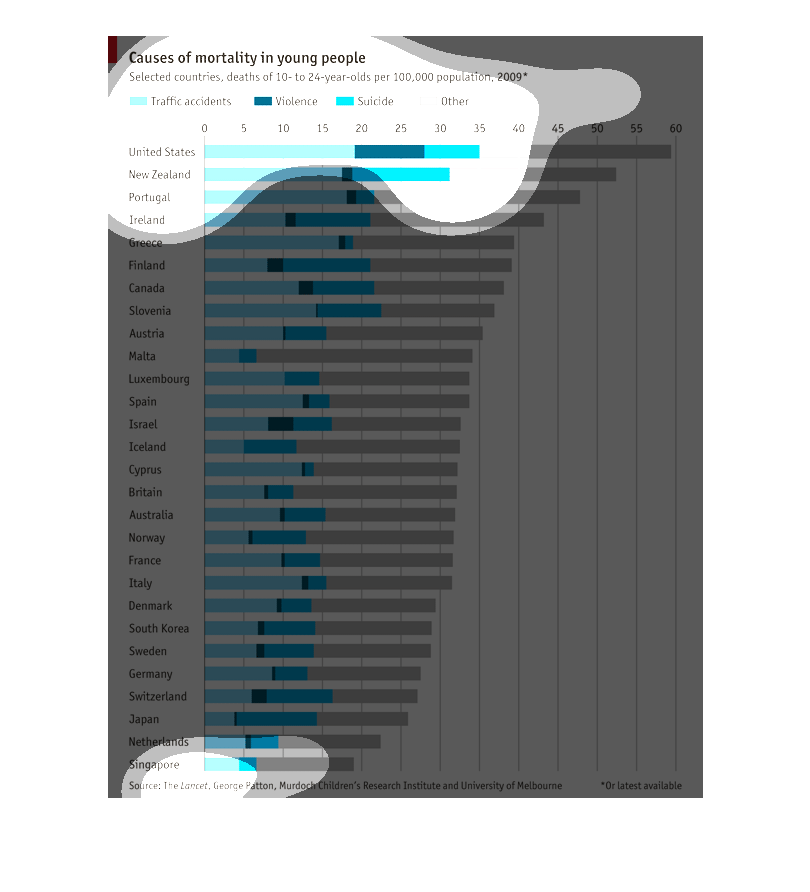
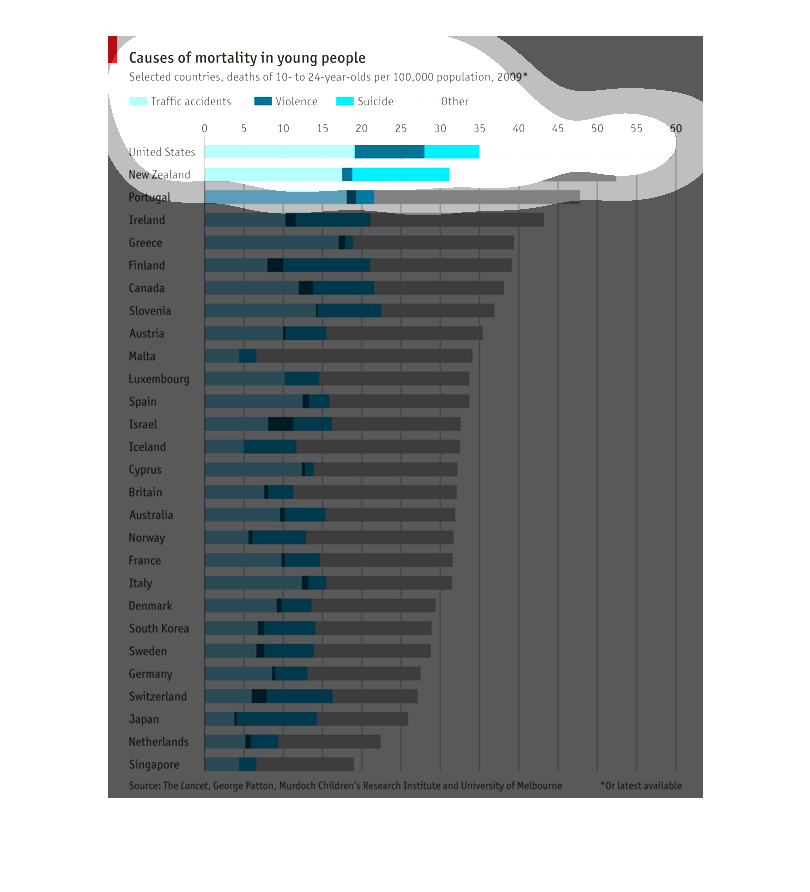
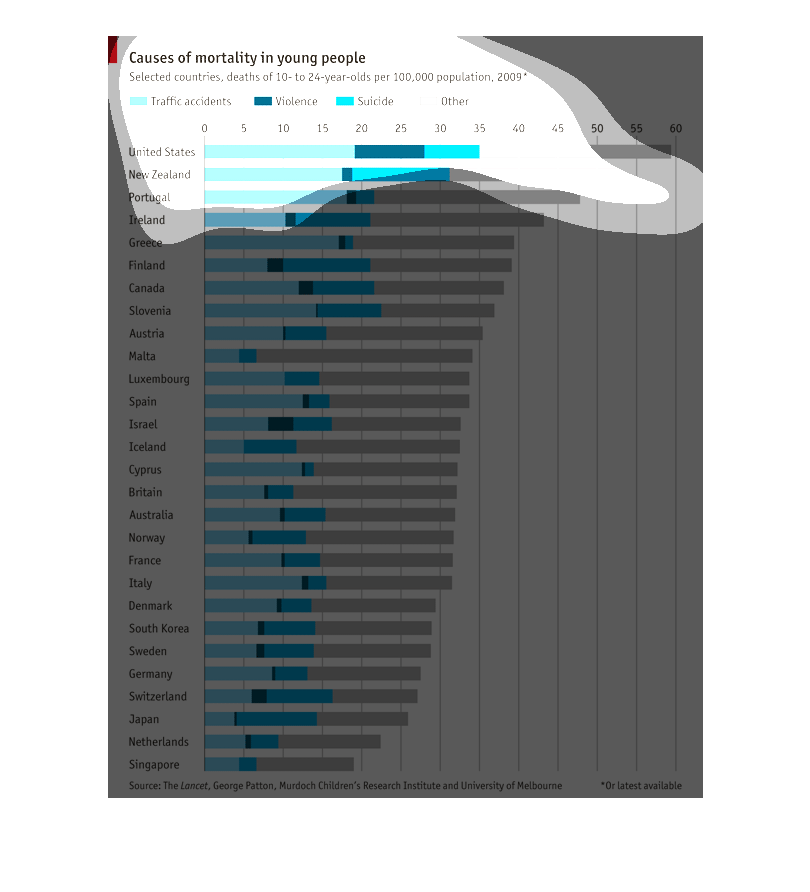
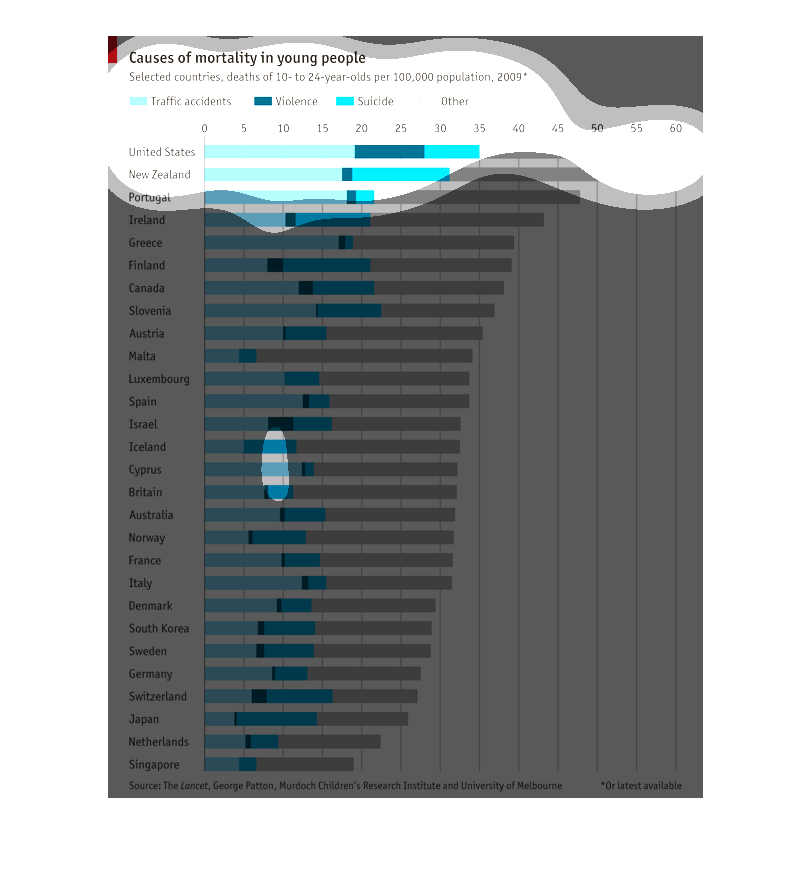
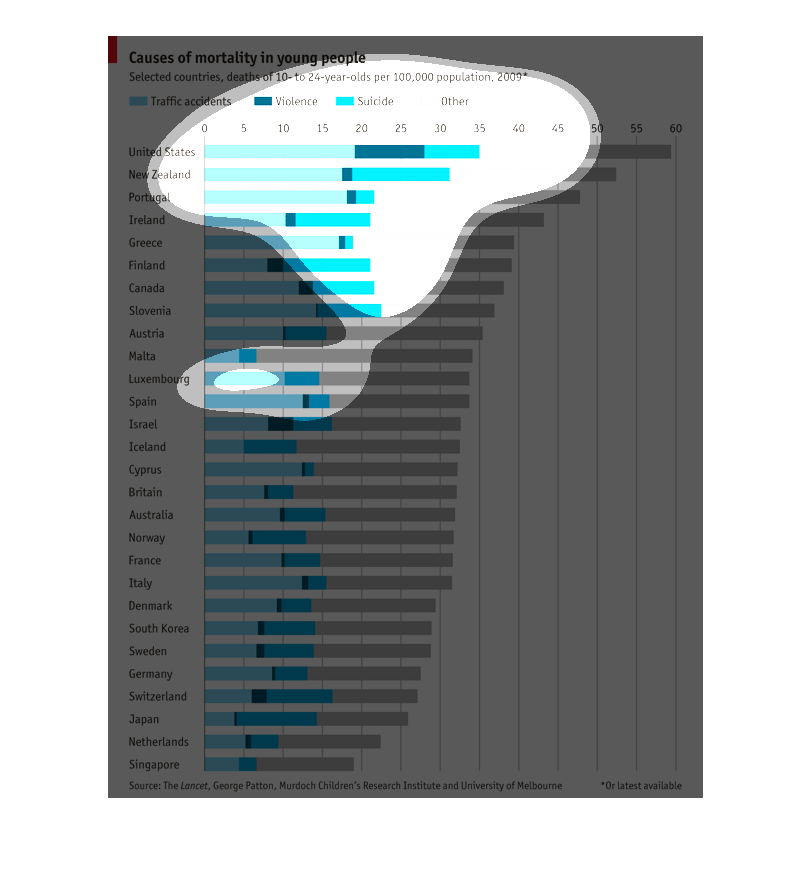
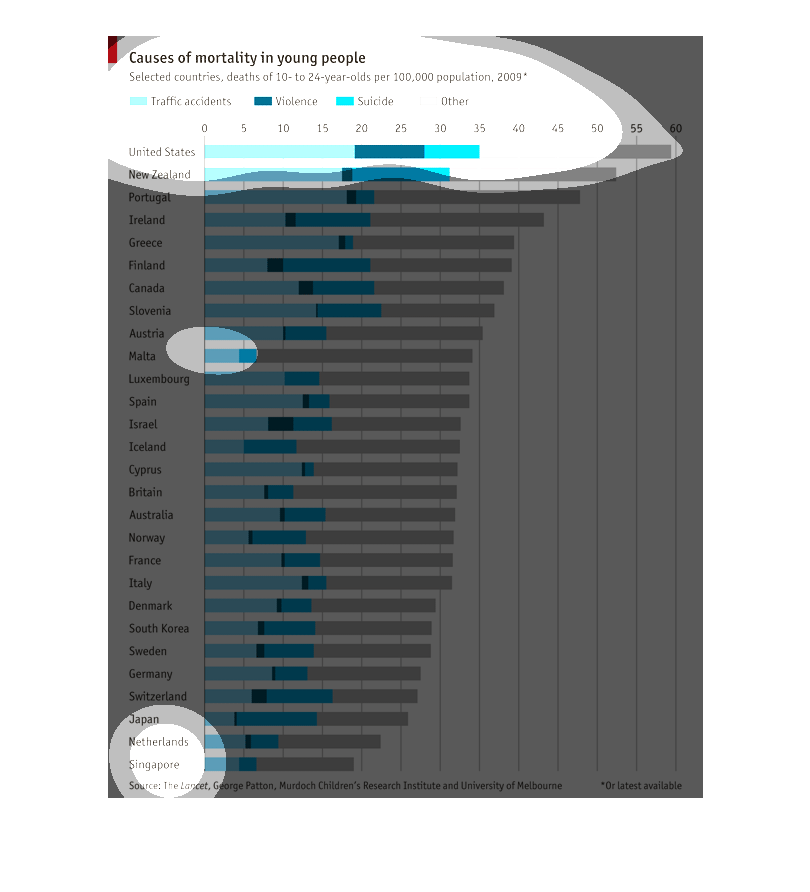
This graph charts causes of death for people in many countries between ages 10 and 24 per
100,000 people using data from 2009. The information is compared by country. Overall, the
United States has the highest rate of young death among countries displayed with "violence"
constituting a much higher percentage of the total in the United States than in any other
country displayed.
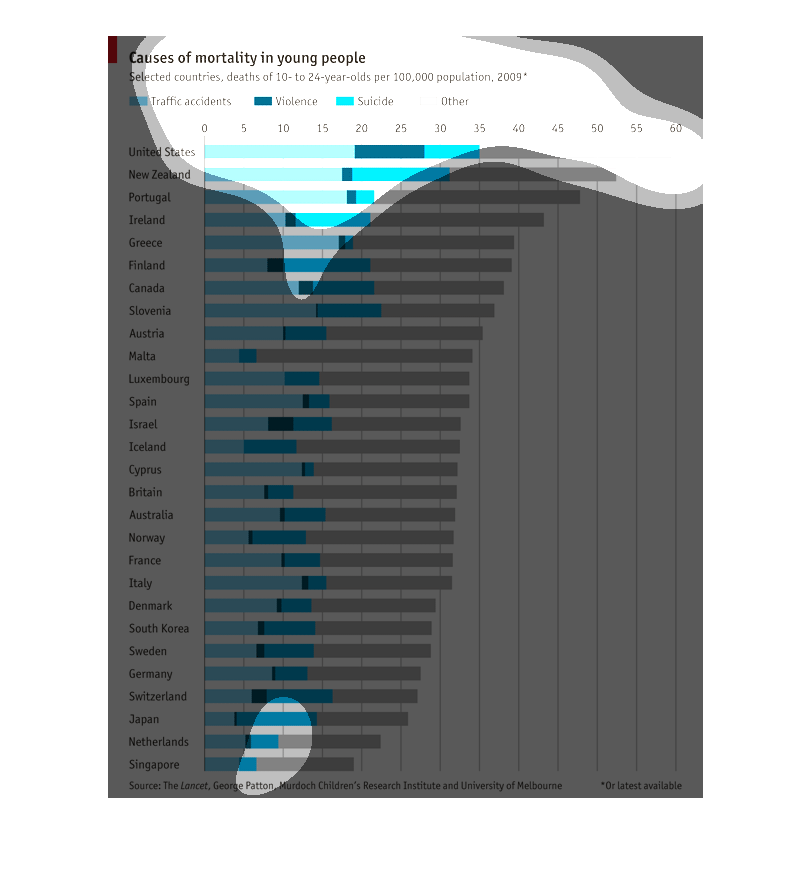
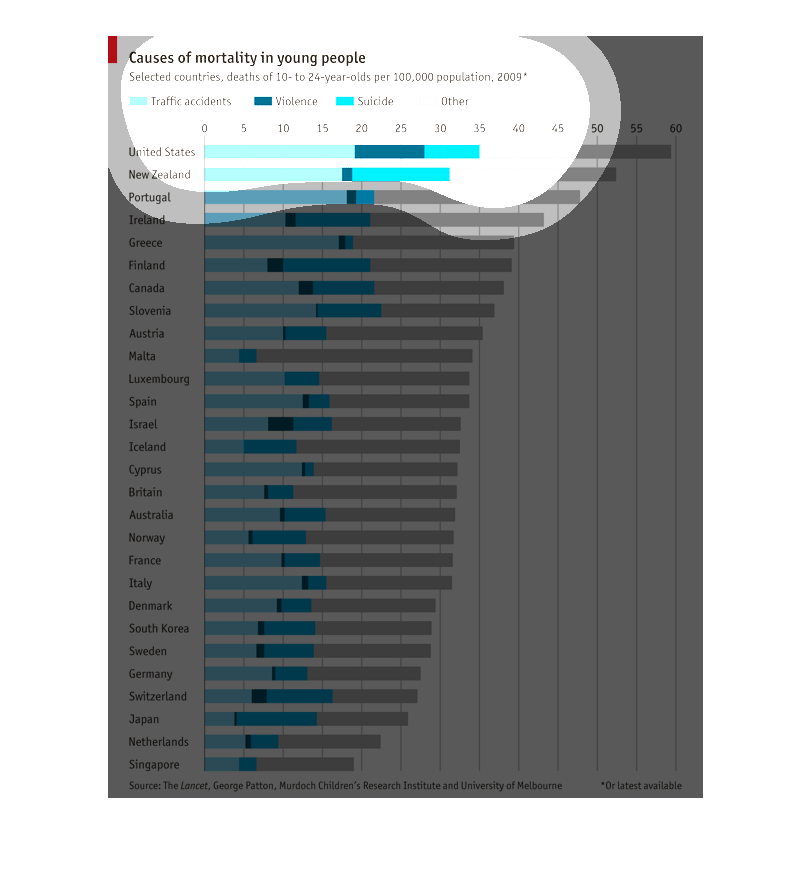
This Image is showing a chart representative of the Mortality rates and accompanying causes
of death of young people sorted by the countries they resided in.
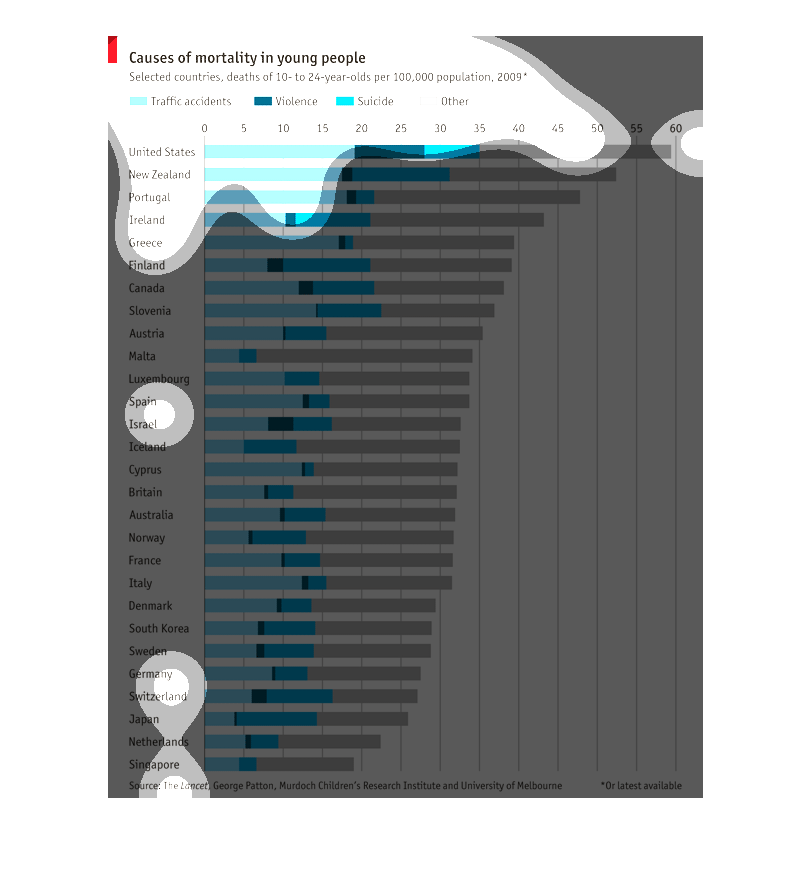
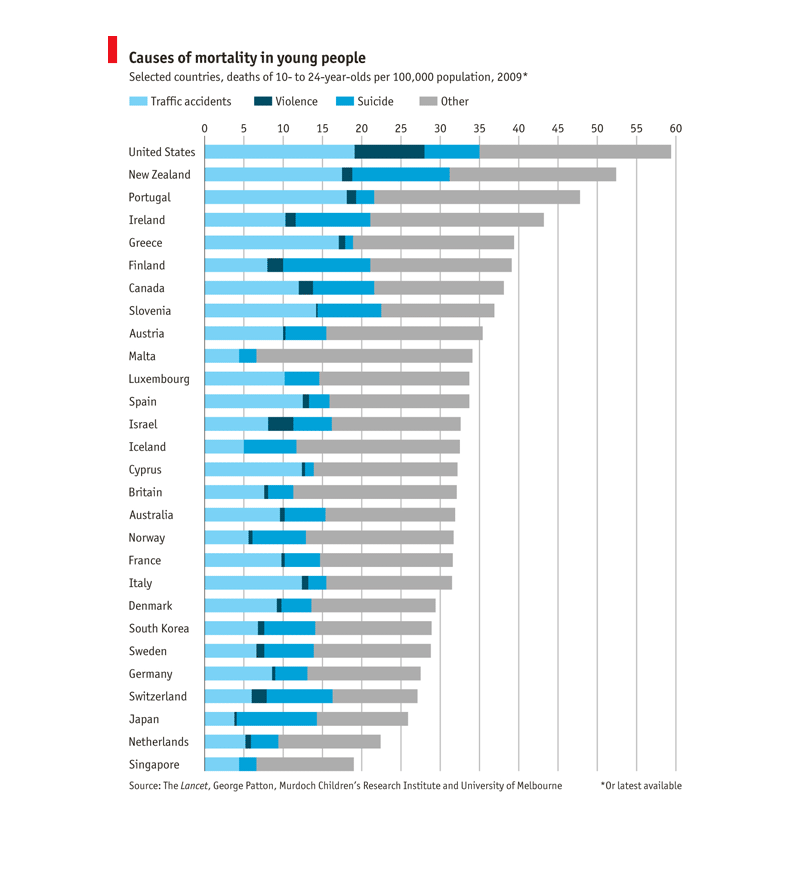
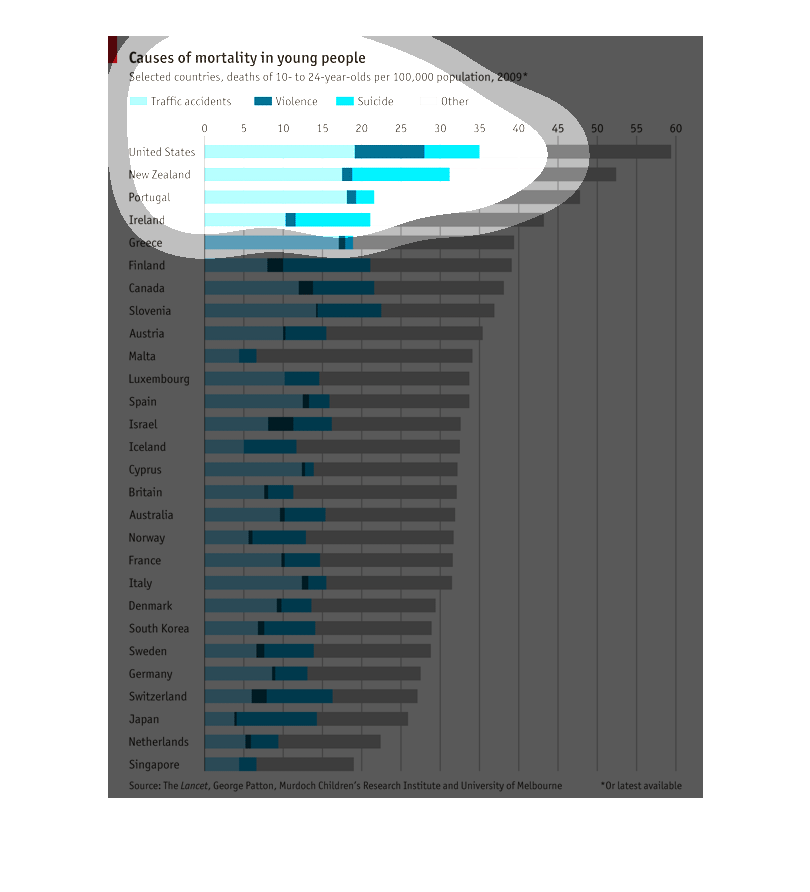
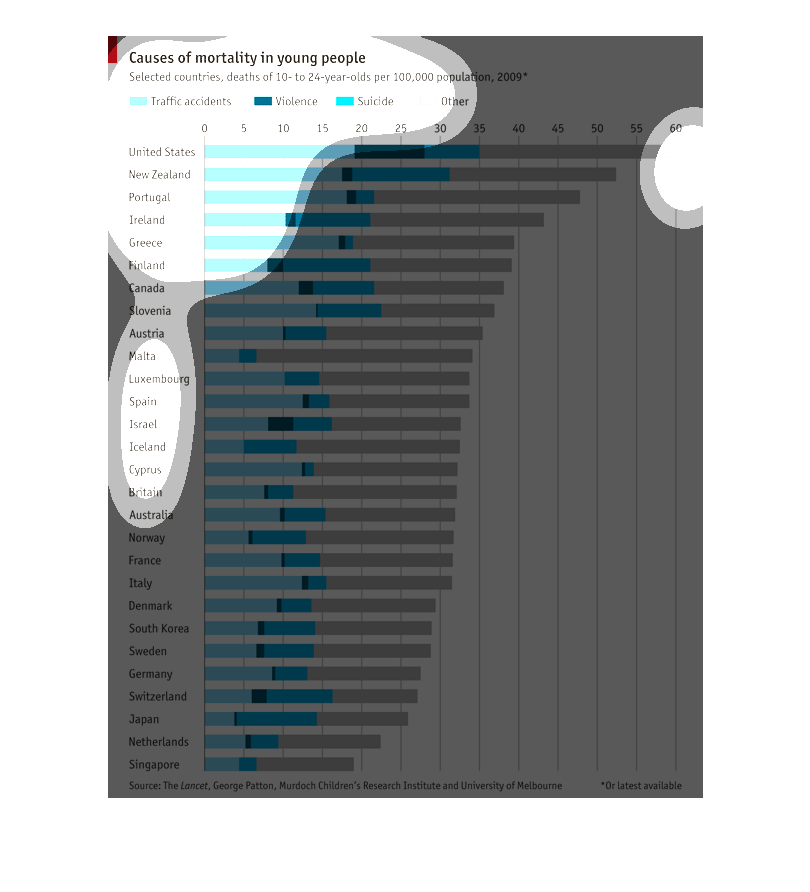
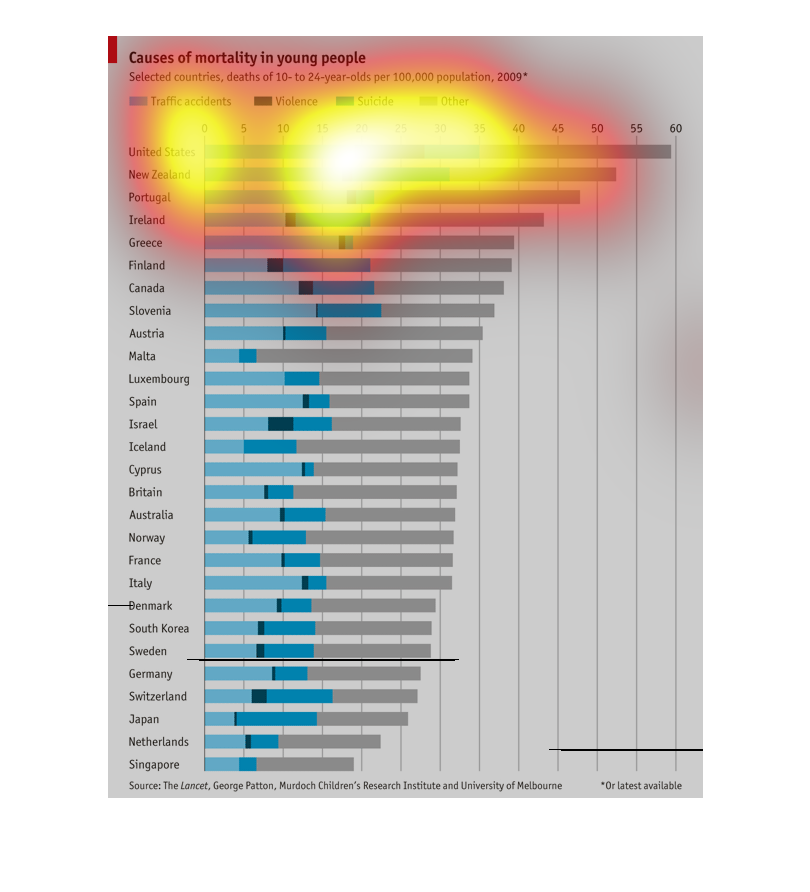
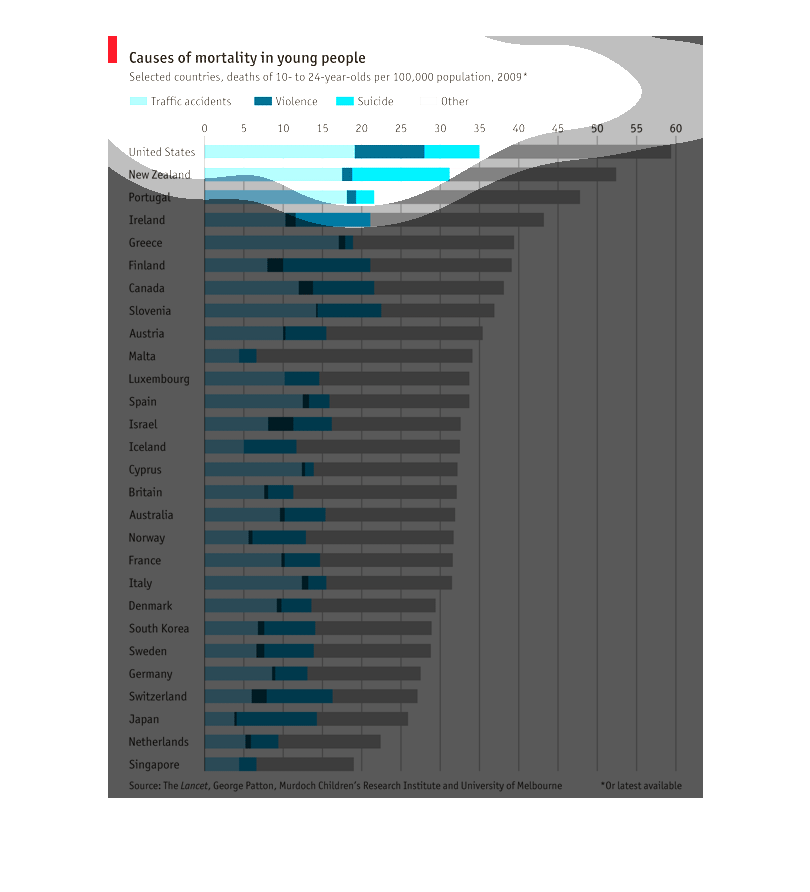
This is a graph of the mortality causes of young people. The United States and New Zealand
top the list with Traffic Accidents as the biggest cause, followed by violence and suicide.
The chart is finished when it comes to singapore, which has most of it's deaths caused by
"other" causes.
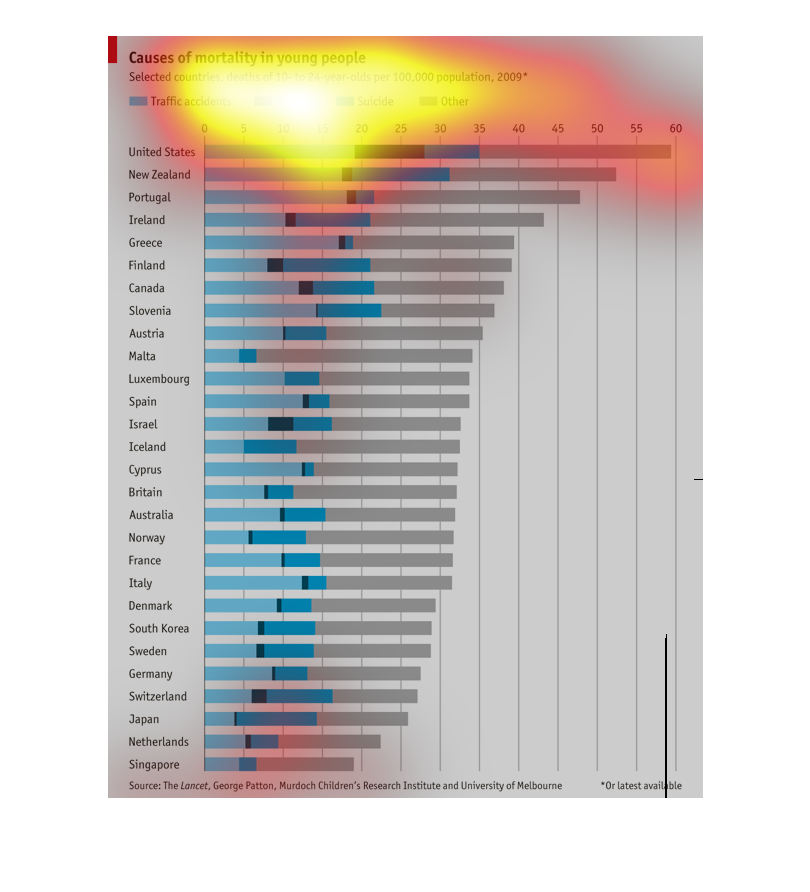
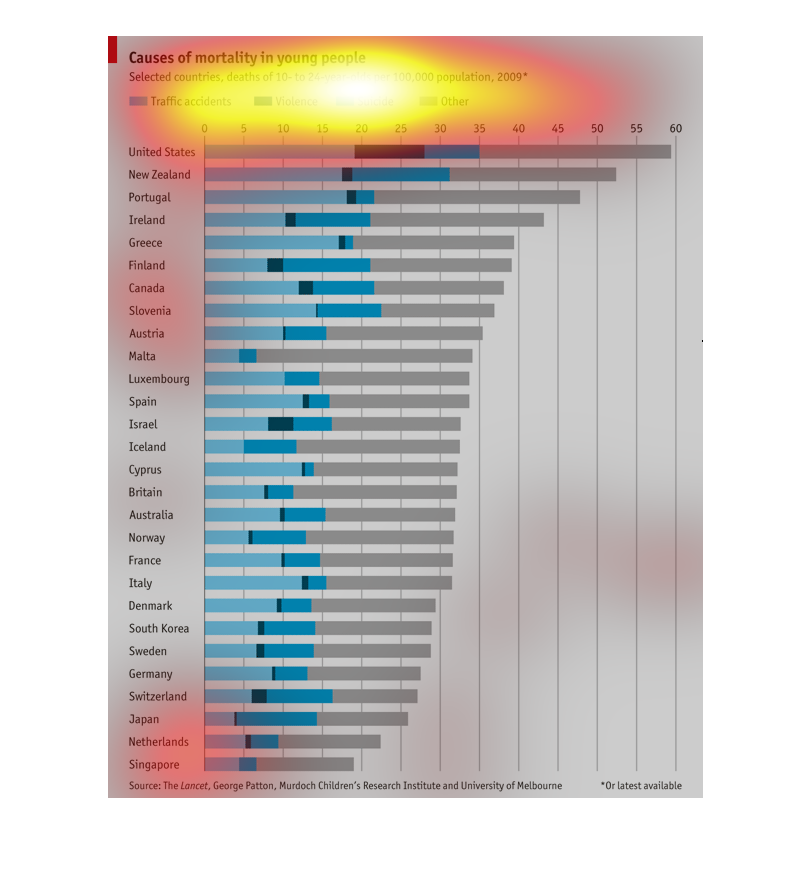
This image describes the causes of mortality in selected countries ranging from ten to twenty
four year old individuals . The leading cause of deaths in the united states for young people
is suicide.
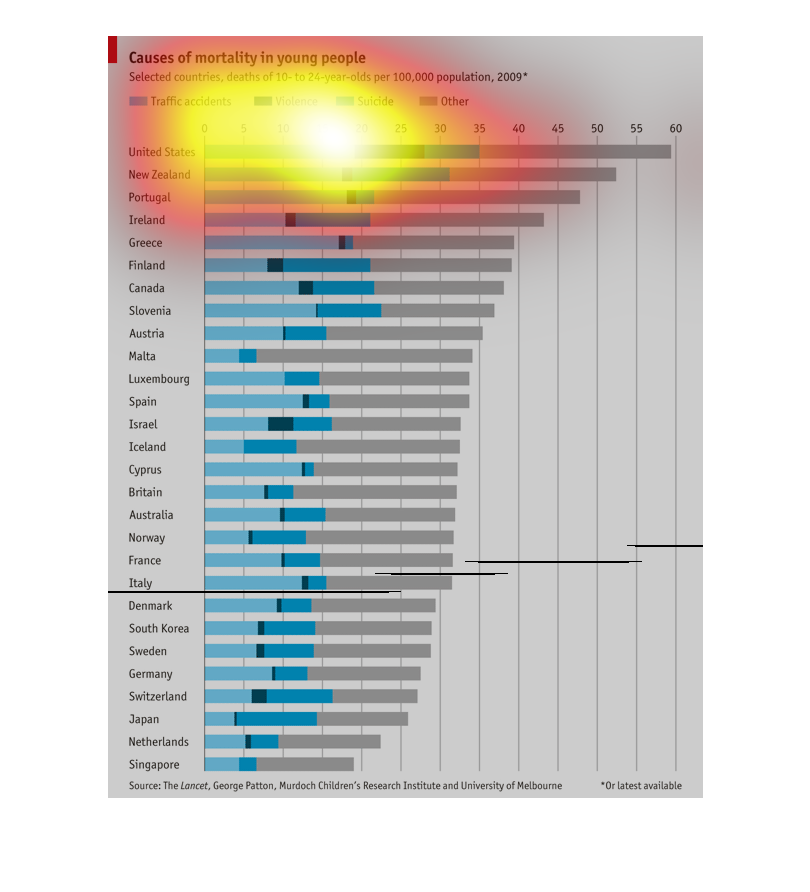
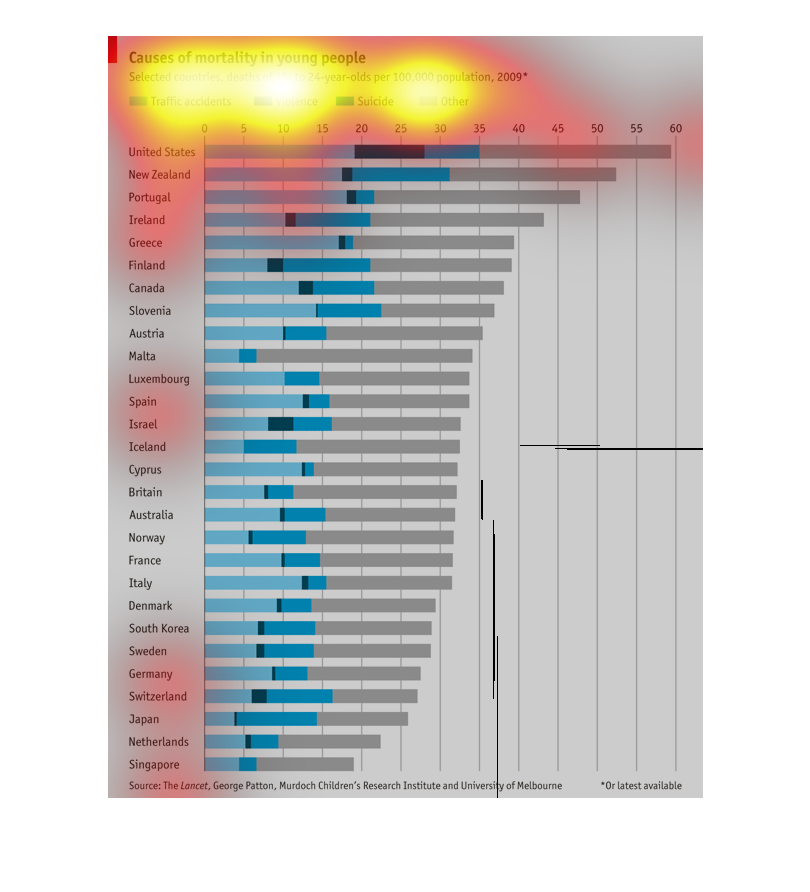
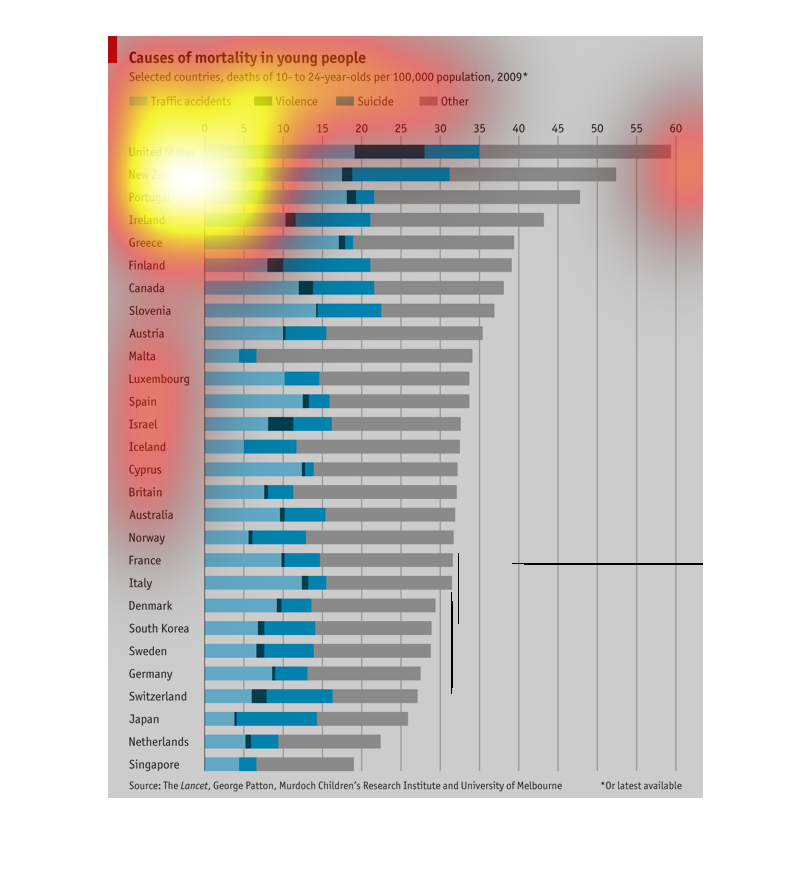
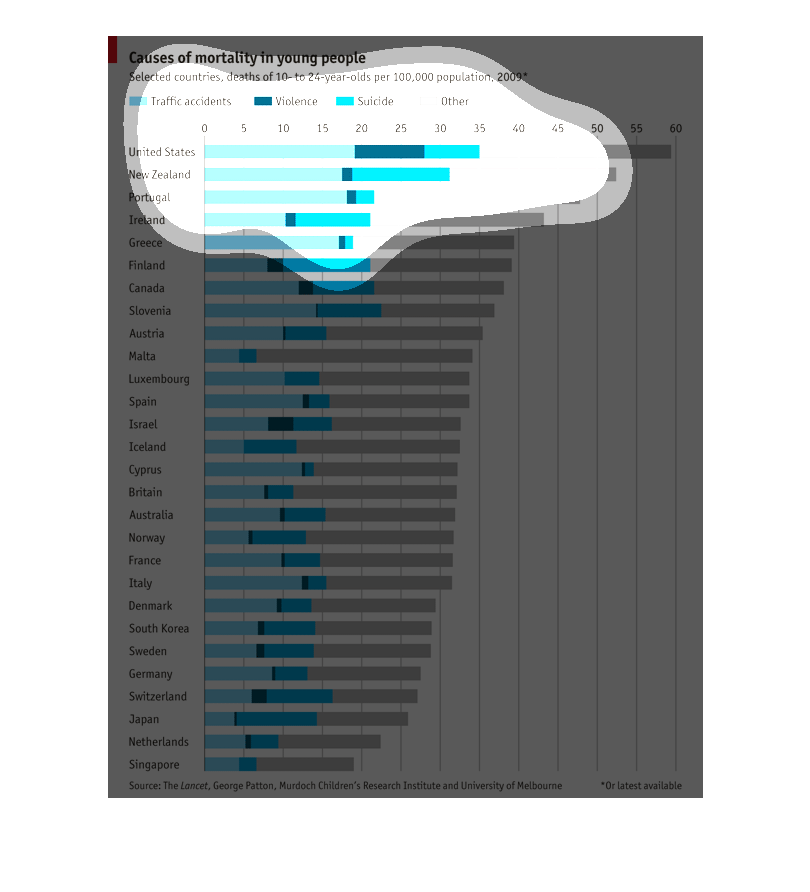
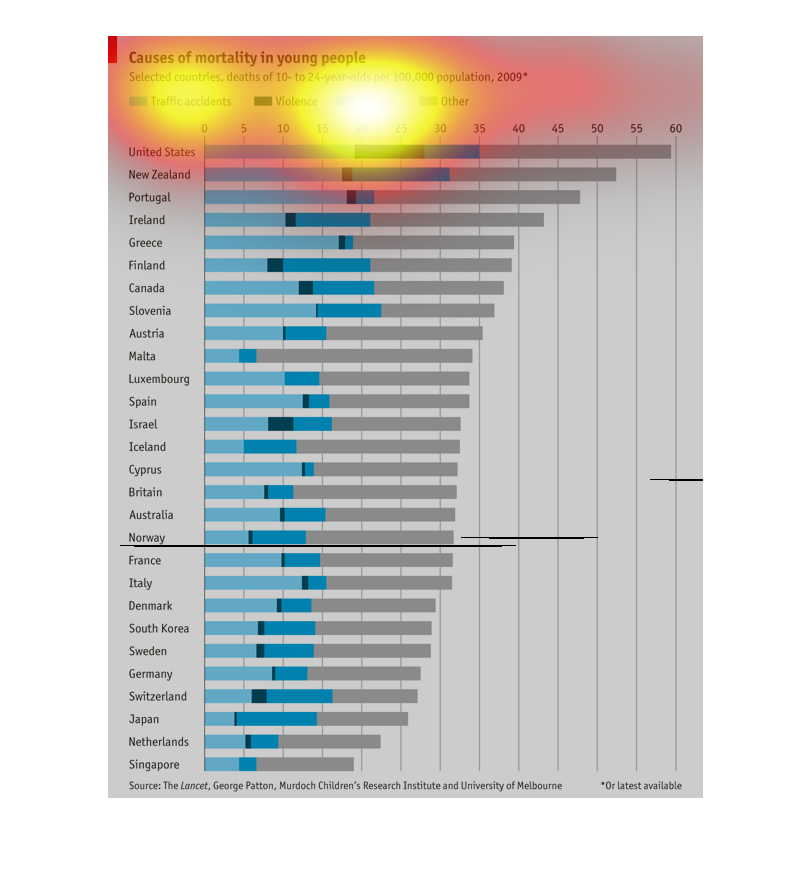
This chart details causes of mortality in young people (ages 10-24).  For each country listed,
the causes of mortality are further broken down into traffic accidents, violence, suicide,
or other. In this chart the United States had the most incidents of mortality with almost
60 per 100,000 young people.
"Causes of morality in young people" the deaths of people between 10-24 per 100,000 of the
population. It has selected countries, but there are quite a few chosen with the Us leading
the pack at 60 per 100,000.
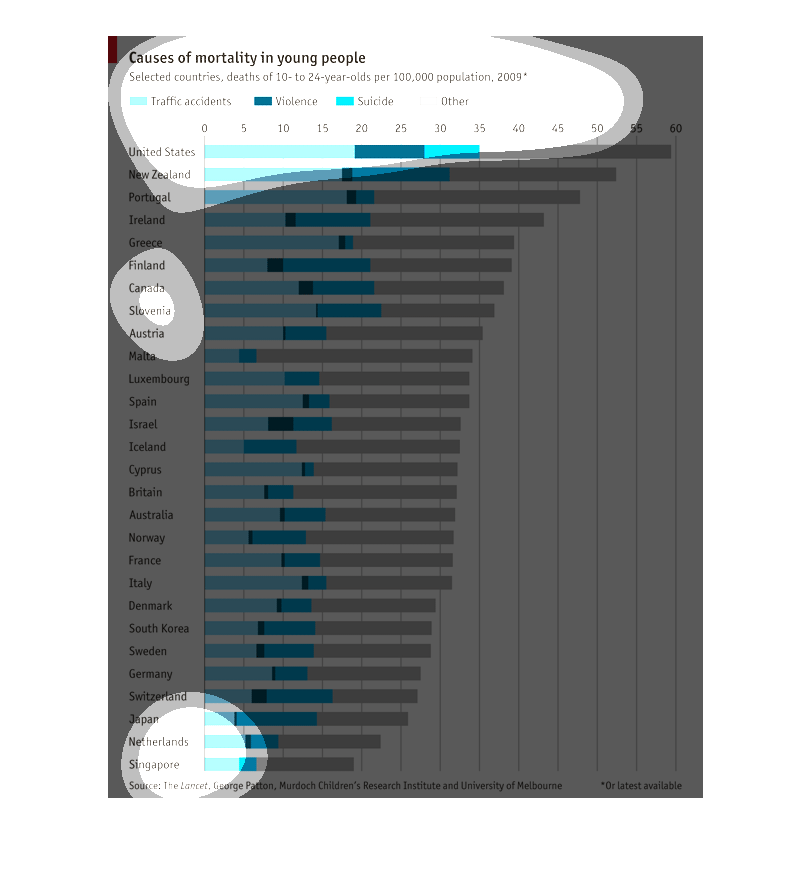
This image is a bar graph containing information for the Causes or mortality in young people
that are ages 10-24. The year of the information is 2009, and the reason of mortality is broken
down by country.
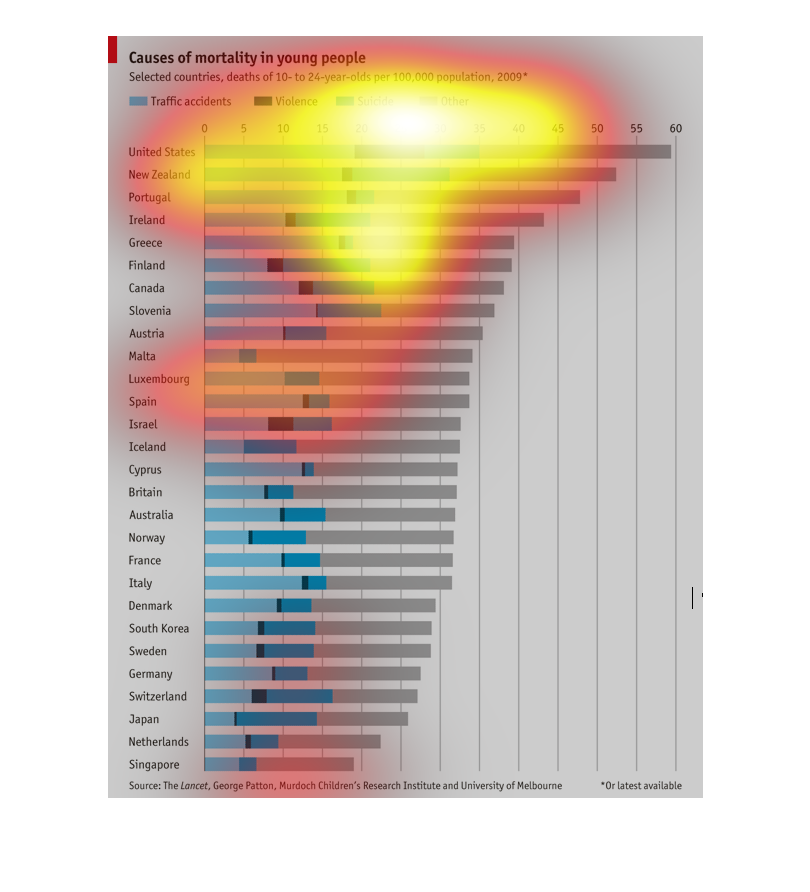
This is a bar graph of mortality rates in young people by cause and country. Traffic accidents
lead the pack, followed by suicide, then violence, and assorted other causes comprise the
rest.
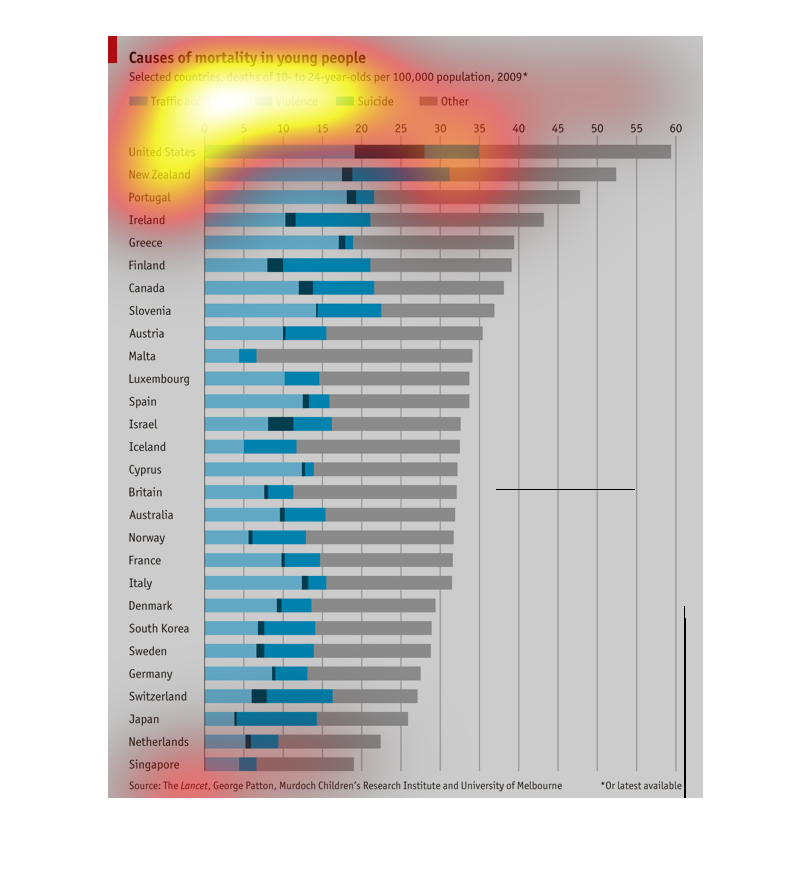
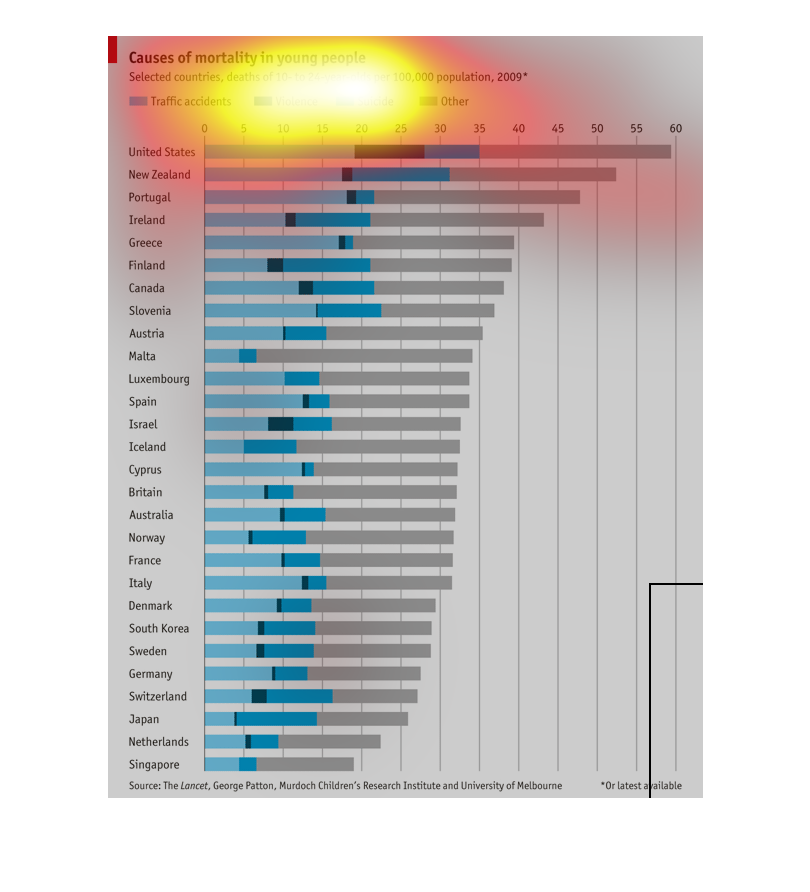
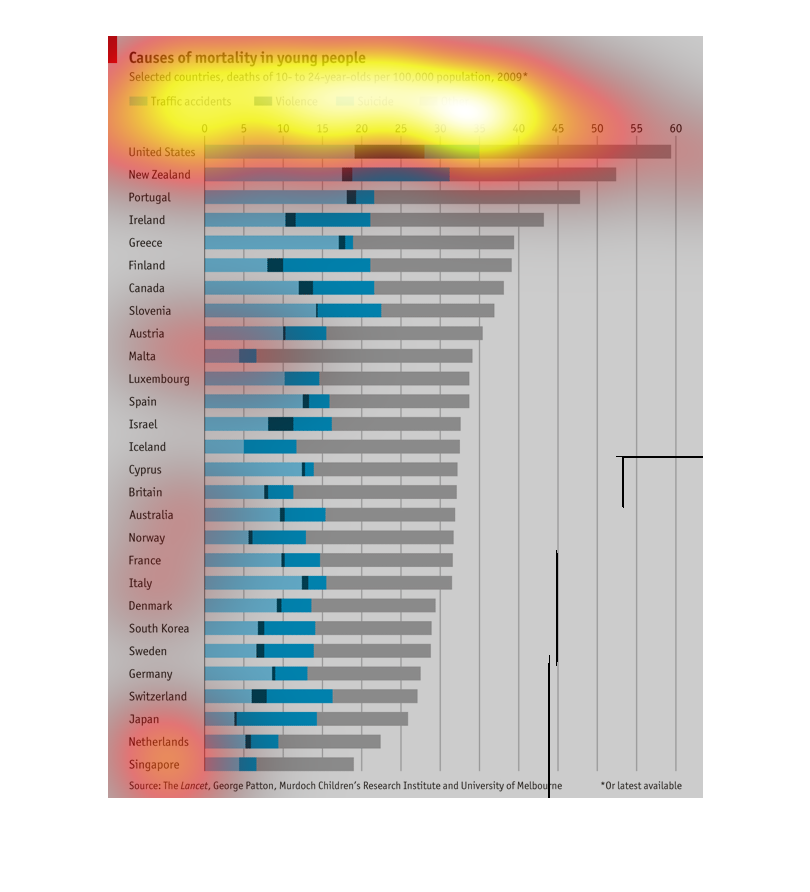
The bar chart breaks down the causes of death in young people 10-24 per population of 100,000
for 2009.  Each bar is broken down by traffic accidents, violence, suicide and Other.
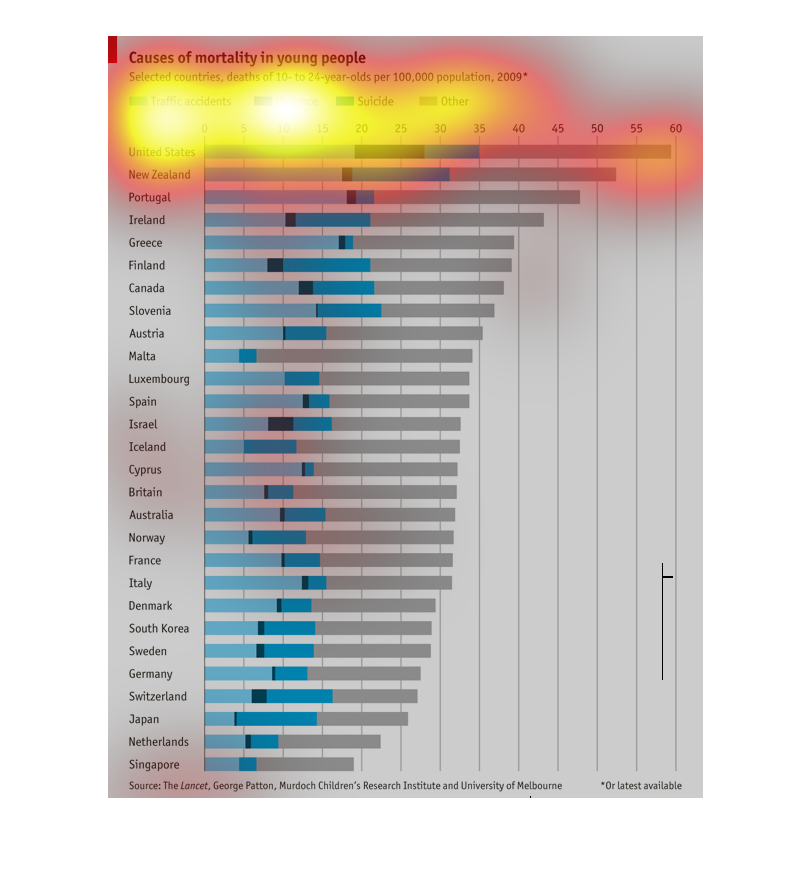
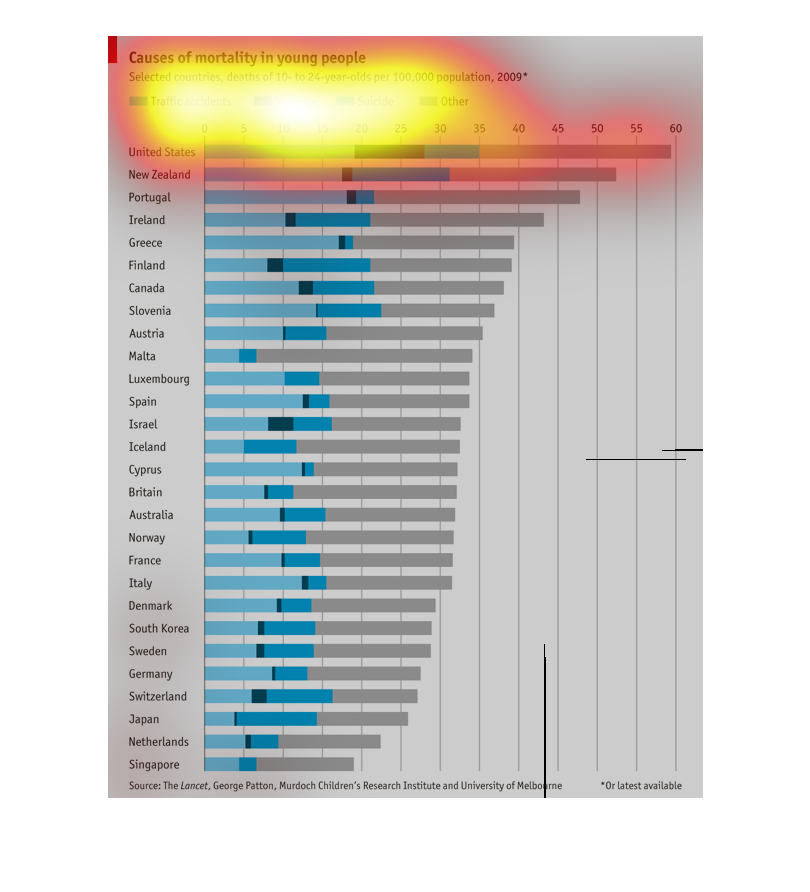
This chart displays the various causes of death for young people ages 10 to 24. It displays
this information by country in thousands, and from highest mortality rates to lowest.
In the United States, young people tend to die more often from suicide over violence and other
causes. The same can be said for New Zealand and a majority of other first world countries.
Violence is often the least likely killer of youths, where other causes vies for first in
many other countries.
This graph shows the causes of deaths of young people (ages 10 - 24) among a list of countries.
It uses a scale that shows the number of deaths per 100,000 people. The graph splits the deaths
between Traffic Accidents, Violence, Suicide, and Other. It shows the United States at the
top and Singapore at the bottom.
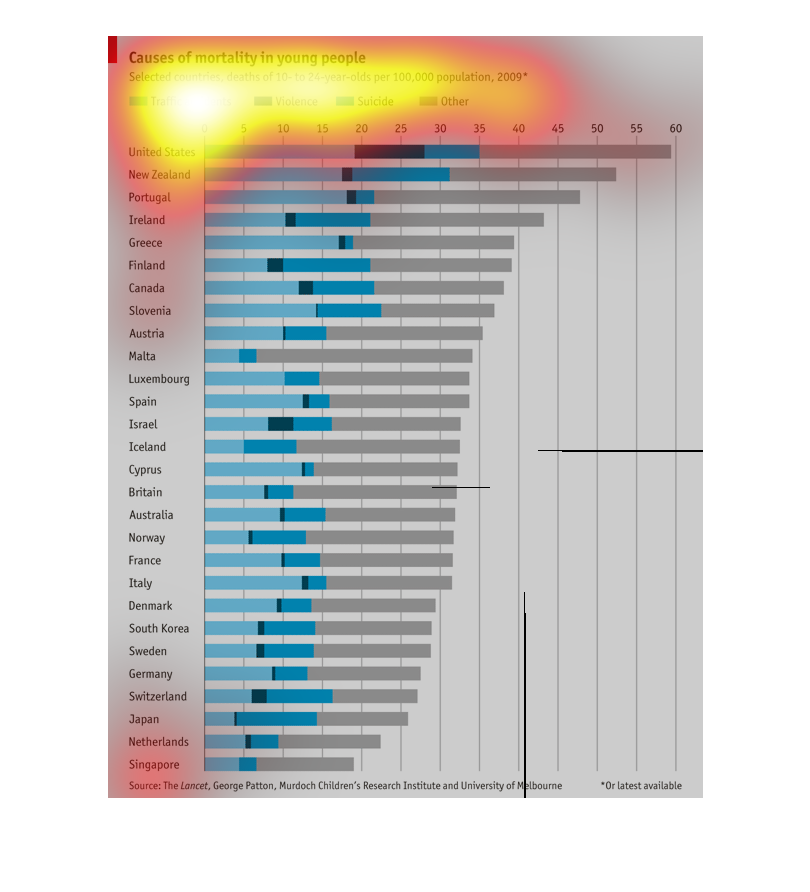
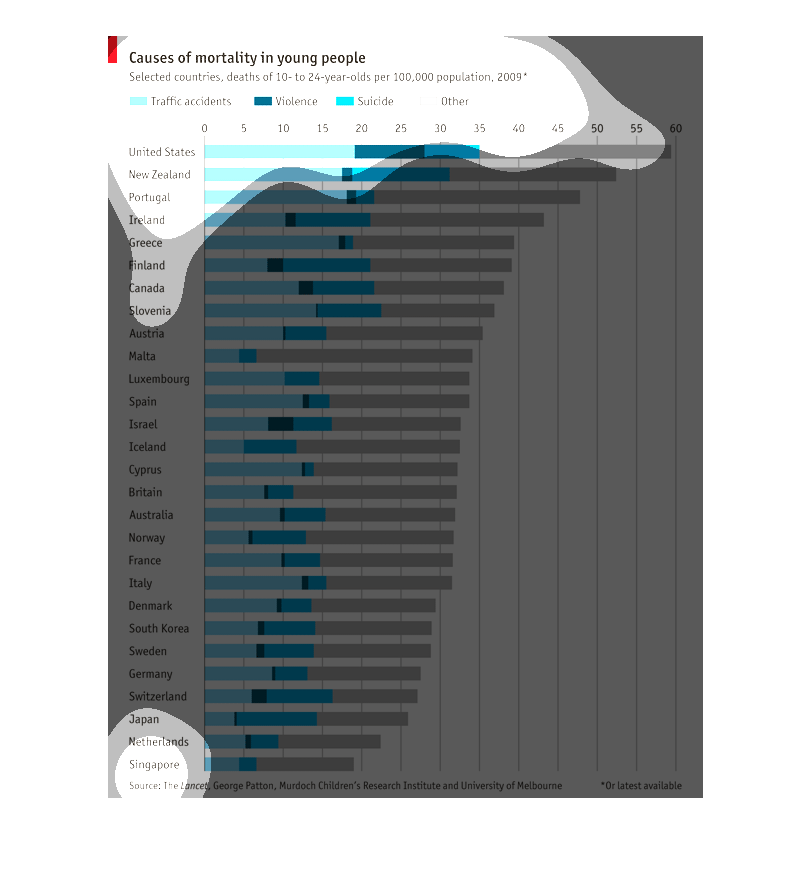
Chart shows causes of death in young people.10-24 year olds in selected countries. Broken
down by cause of death(traffic, suicide,violence, other) and by Country.
This graph provides mortality results in young people, age ranging from 10 to 24 years of
age.  The main causes of death are from traffic accidents, violence, suicide and other.  This
graph lists countries from all over the world.
This study is of causes of death in young people by country. The potential causes include
suicide, traffic accidents, violence and other. In the study the highest number of deaths
was for the United States.