This graph shows the number of people who undergo plastic surgery and out of those how many
do non-invasive and how many do invasive techniques on various parts of the body. For example,
skin, hair, breasts and face.
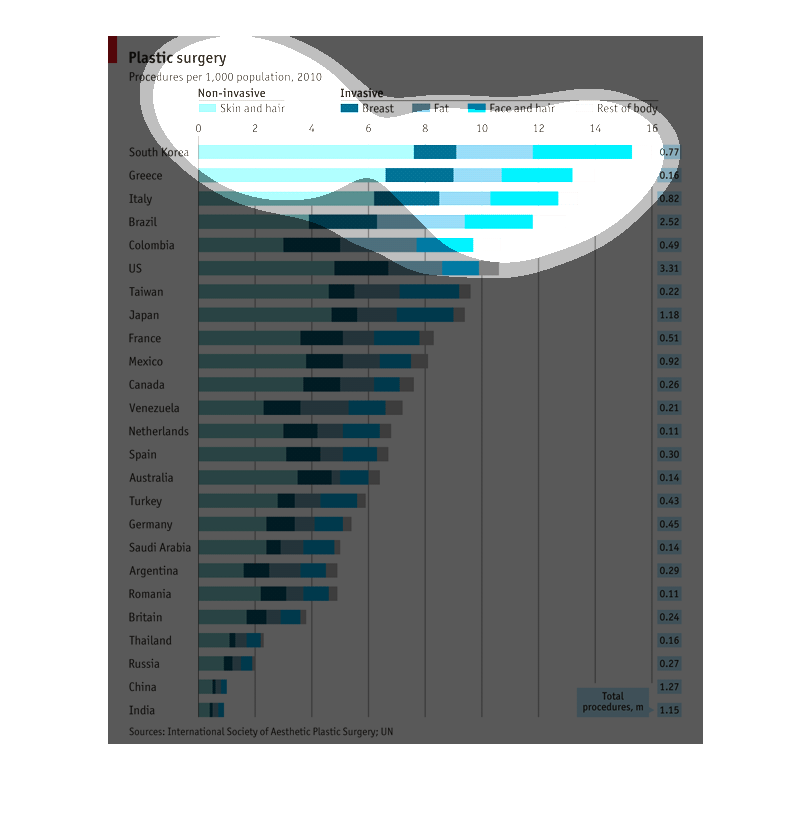
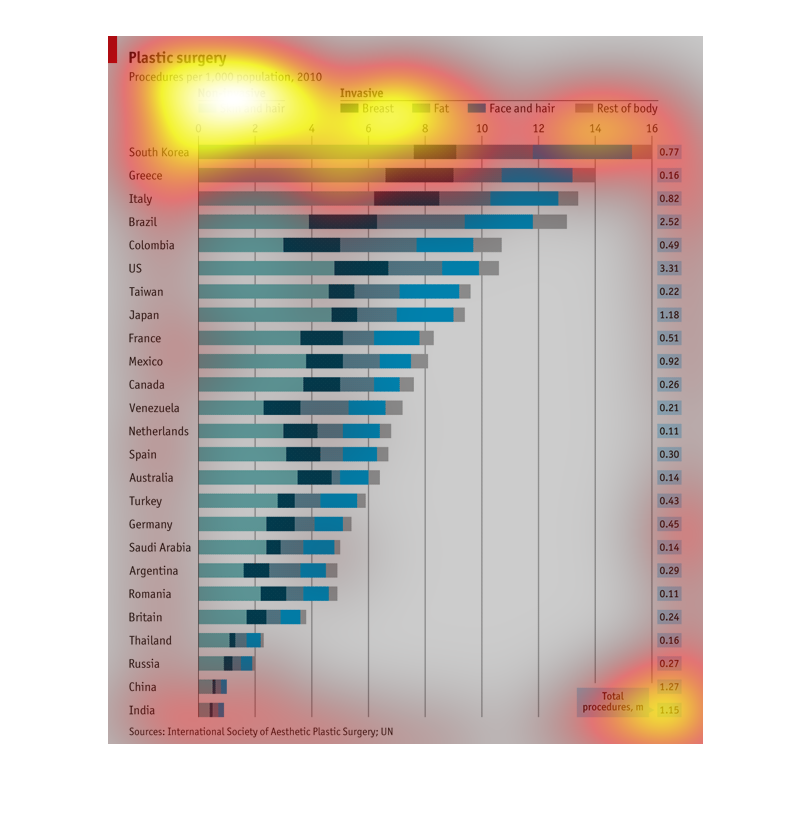
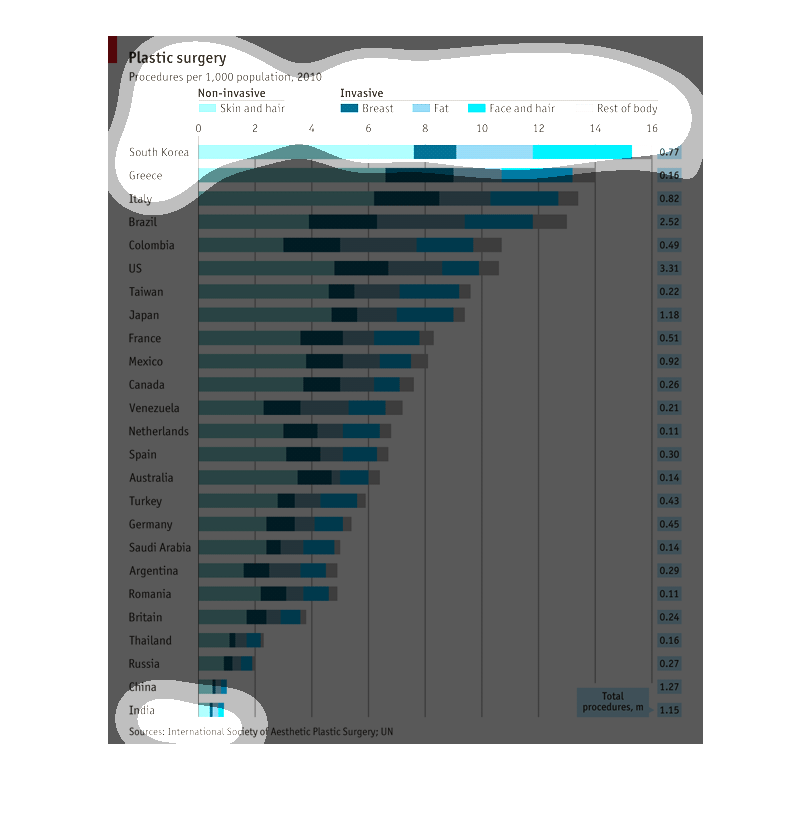
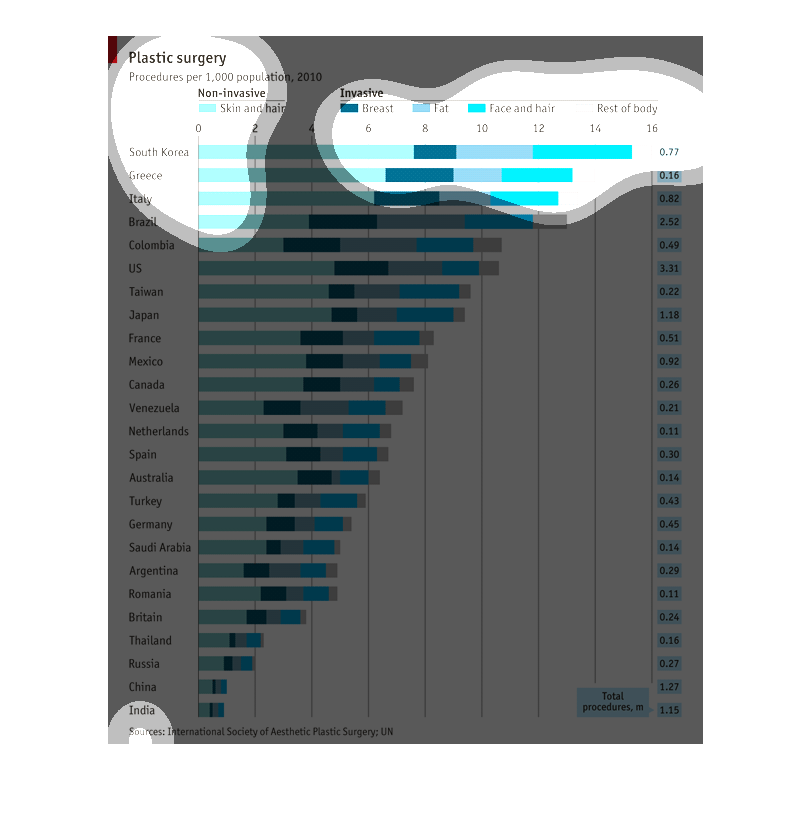
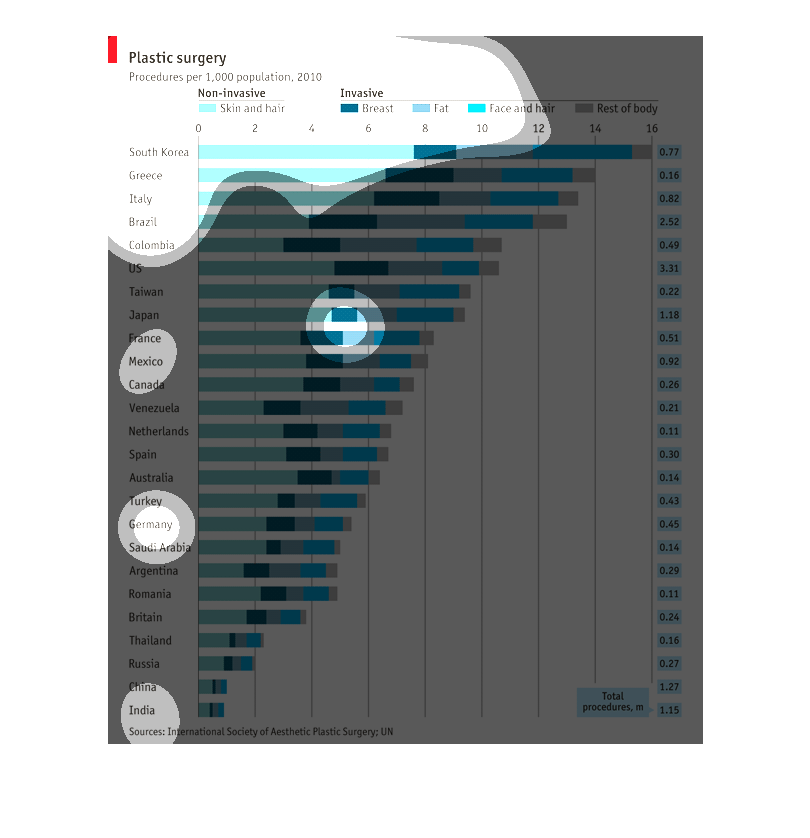
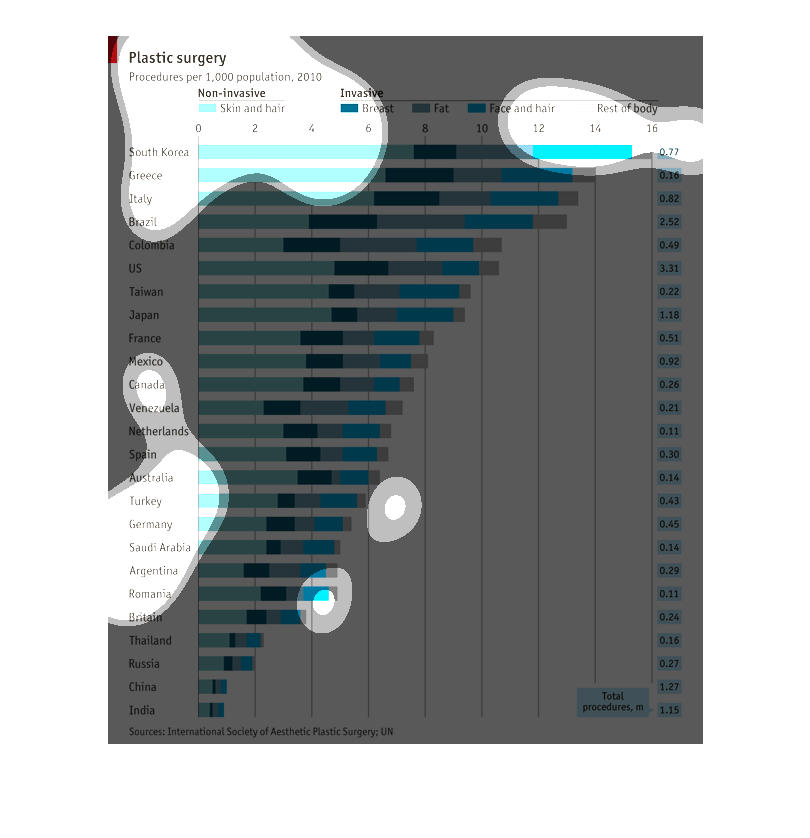
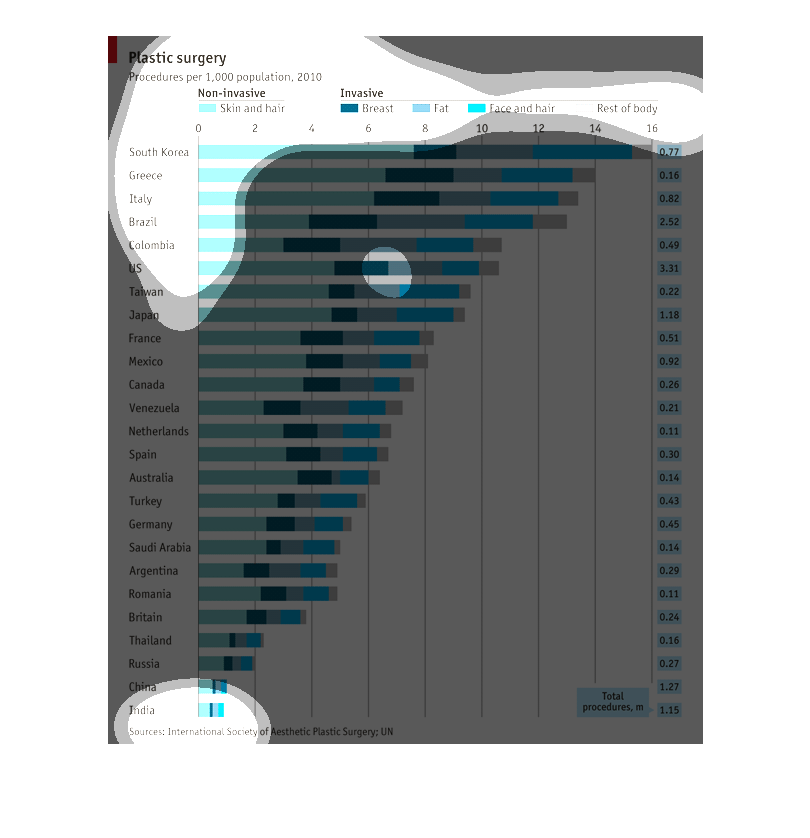
This chart measures plastic surgery procedures (both invasive and non-invasive) per 1000 people
in different countries. The chart also lists total # of procedures (m). Non-invasive includes
skin & hair, while invasive includes  breasts, fat, face & hair, and other body areas .
This shows the number of procedures of plastic surgery in various countries around the world.
It is broken down into five categories: non-invasive (skin and hair), invasive (fat), invasive
(breast), Invasive (face and hair), and other. South Korea tops the list with the most procedures,
While India is at the bottom of the list.
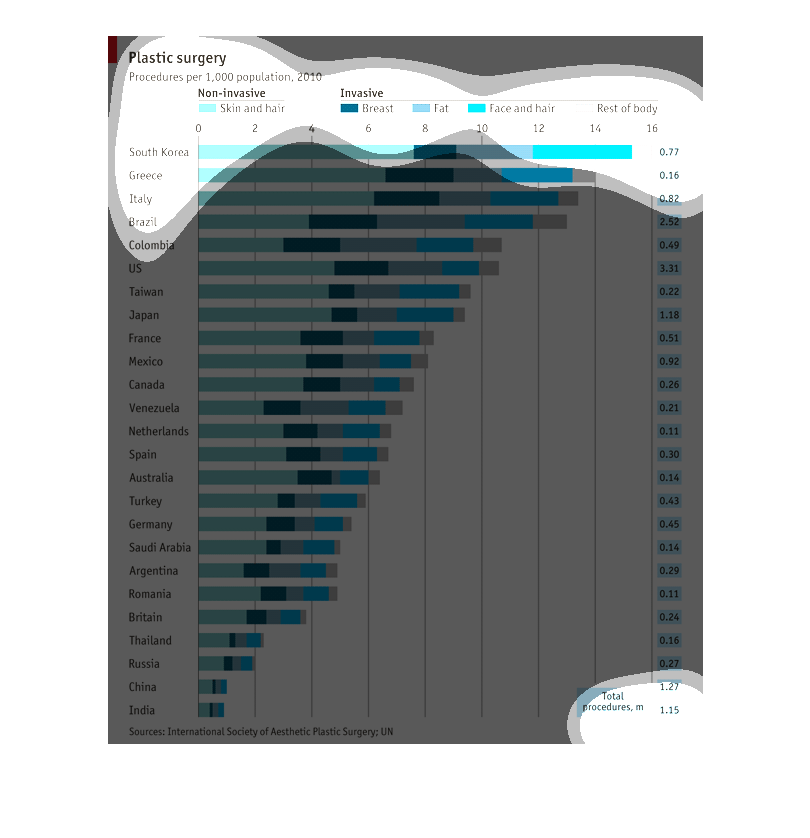
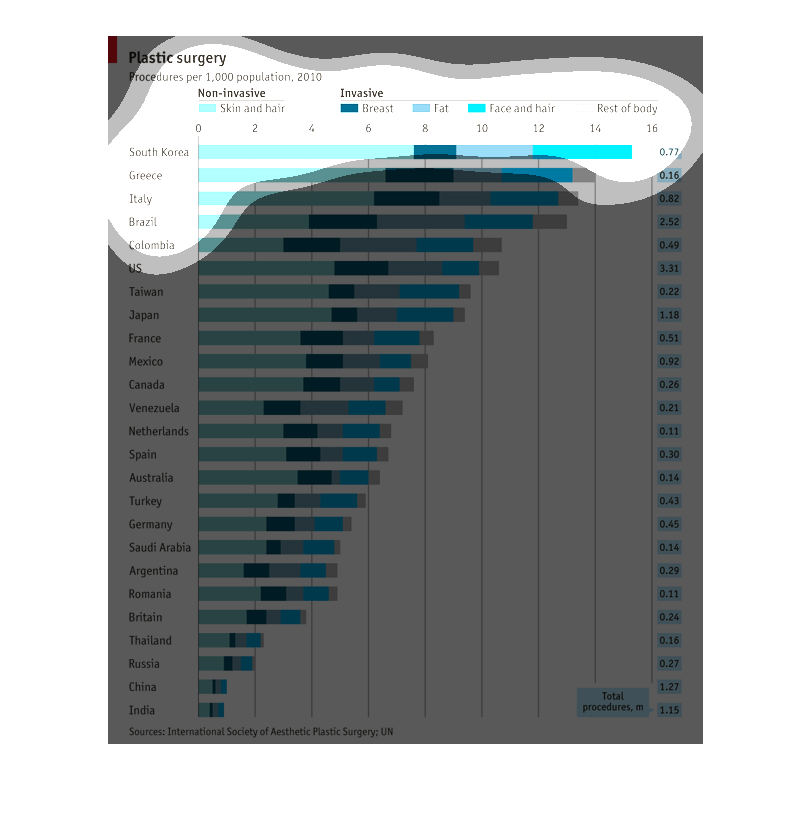
Graph showing plastic surgery patients per 1000 people in the year of 2010. To include such
non-invasive surgeries such as skin and hair. Plus invasive plastic surgery such as breast
surgery and fat surgery as well as face and hair and the rest of the body. This graph counts
surgeries through out the world
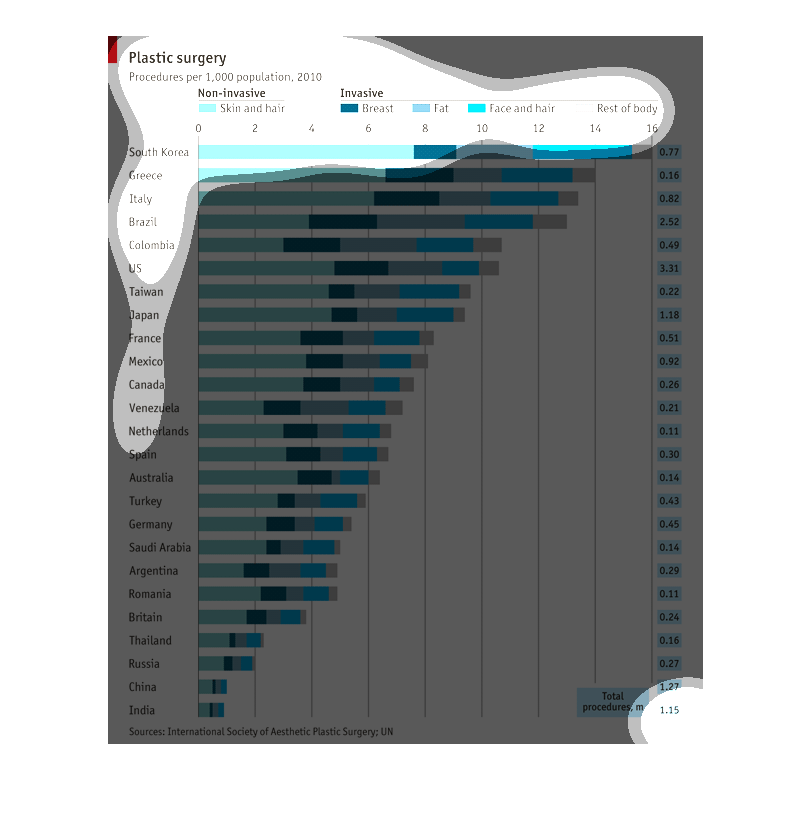
This graph shows the rate at whick citizens have been receiving plastic surgery operations.
Such operations are for many parts of the body and those surgery rates are also displayed.
This graph is regarding 2010 Plastic Surgery.  It shows most of the major countries in the
world and the procedures that were done.  There are non-invasive and invasive.
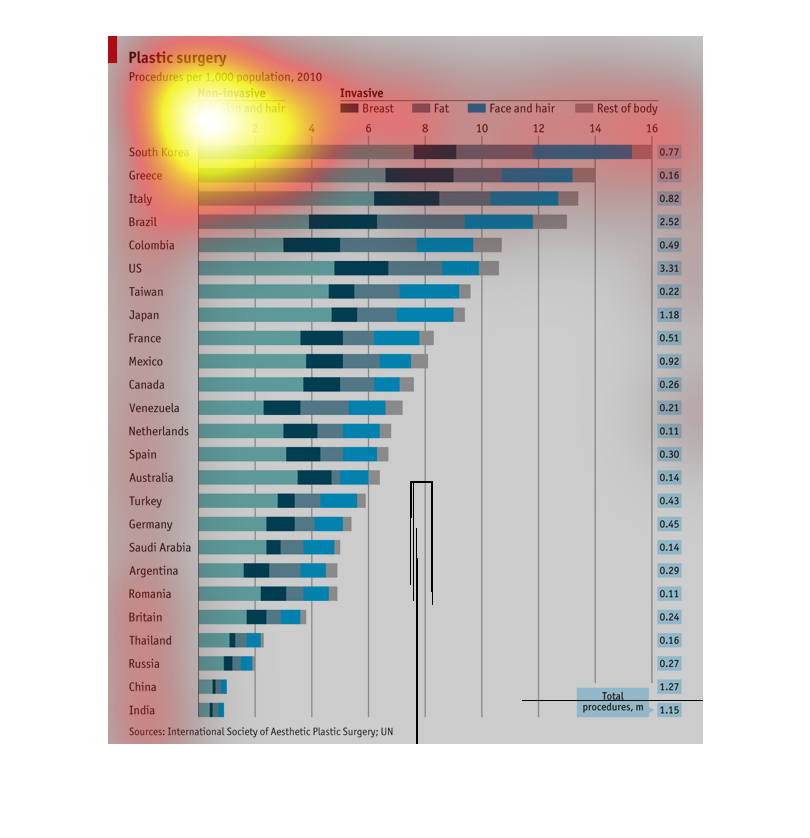
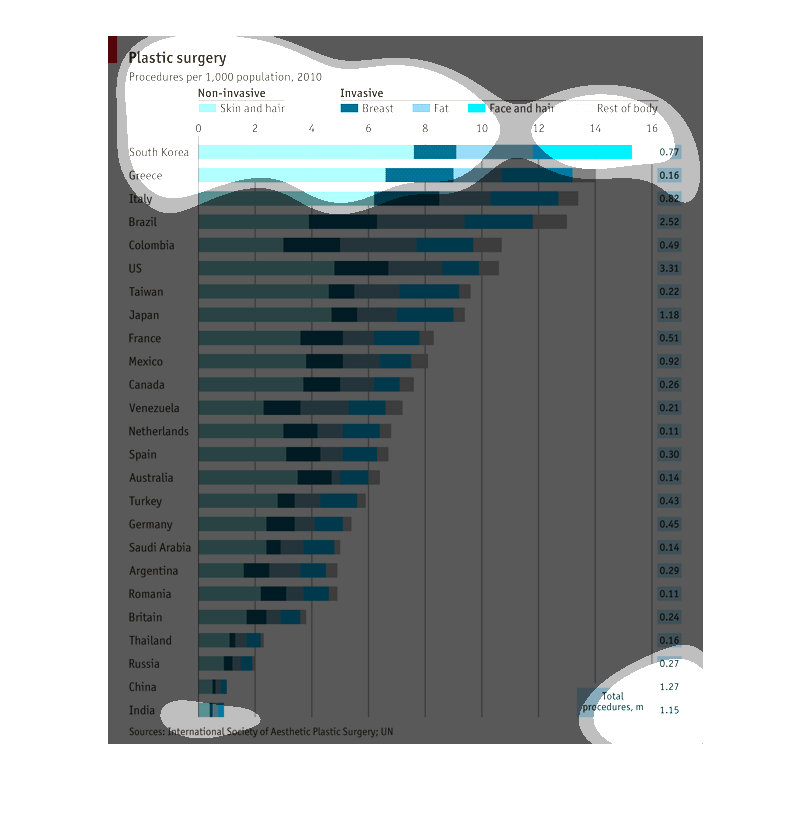
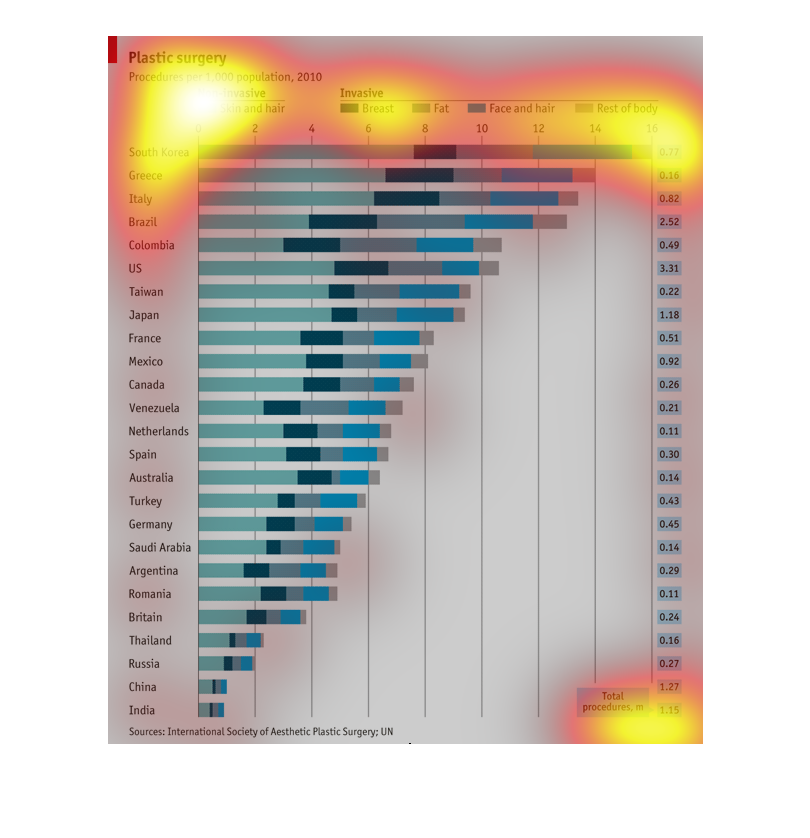
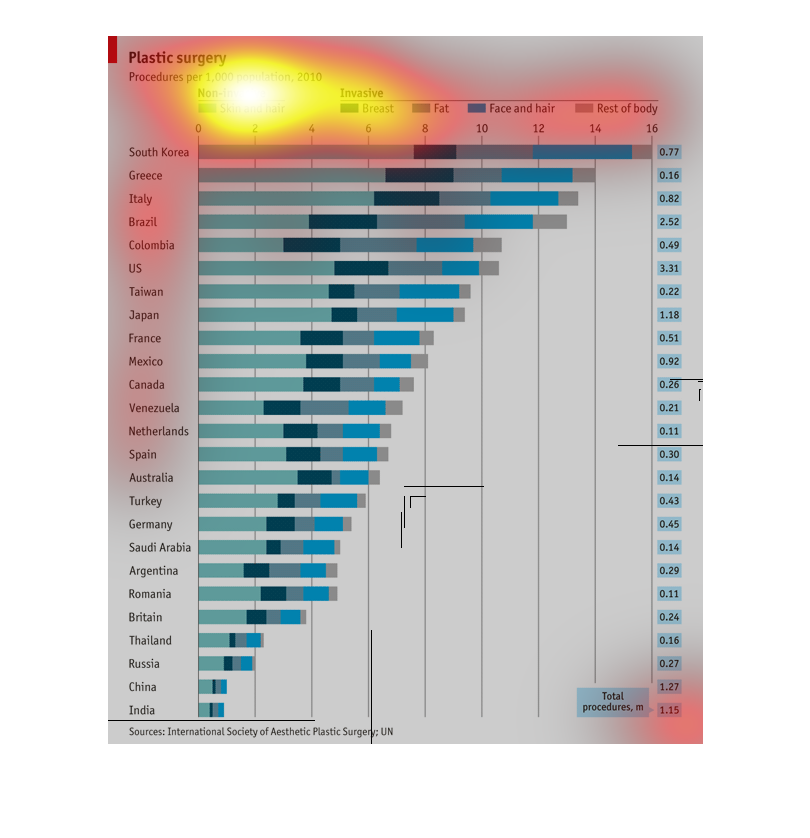
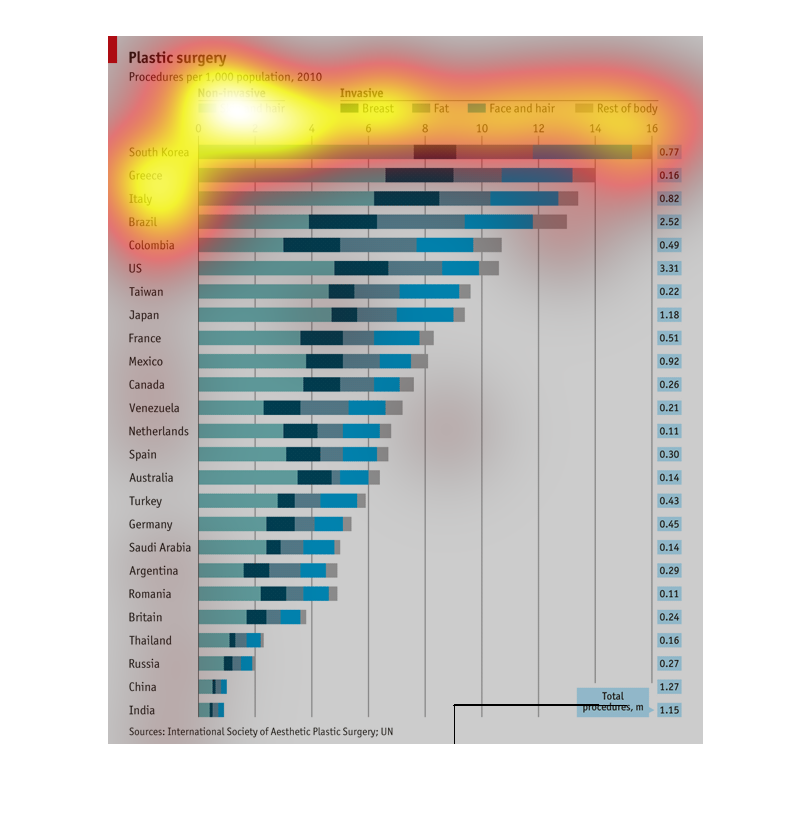
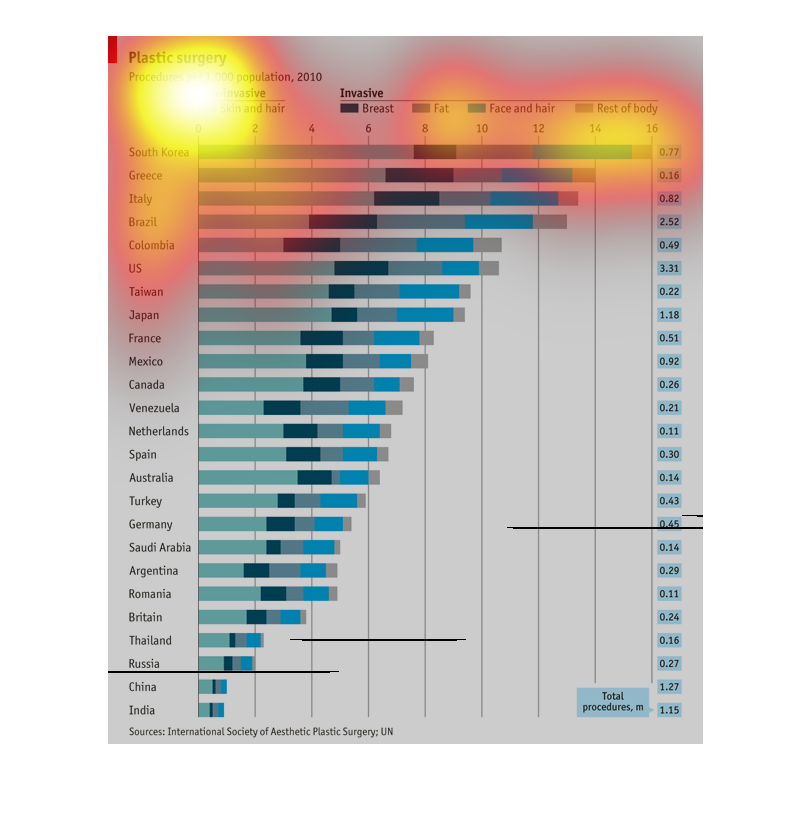
This chart describes plastic surgery across the population, by country, for different parts
of the body, per 1,000 population. South Korea is the highest; India is the lowest.
This chart is about invasive (breast, fat, face, hair, and the rest of the body) non-invasive
(skin and hair) plastic surgery procedures and how many procedures are done in different countries
in the world. South Korea, Greece and Italy round out the top.
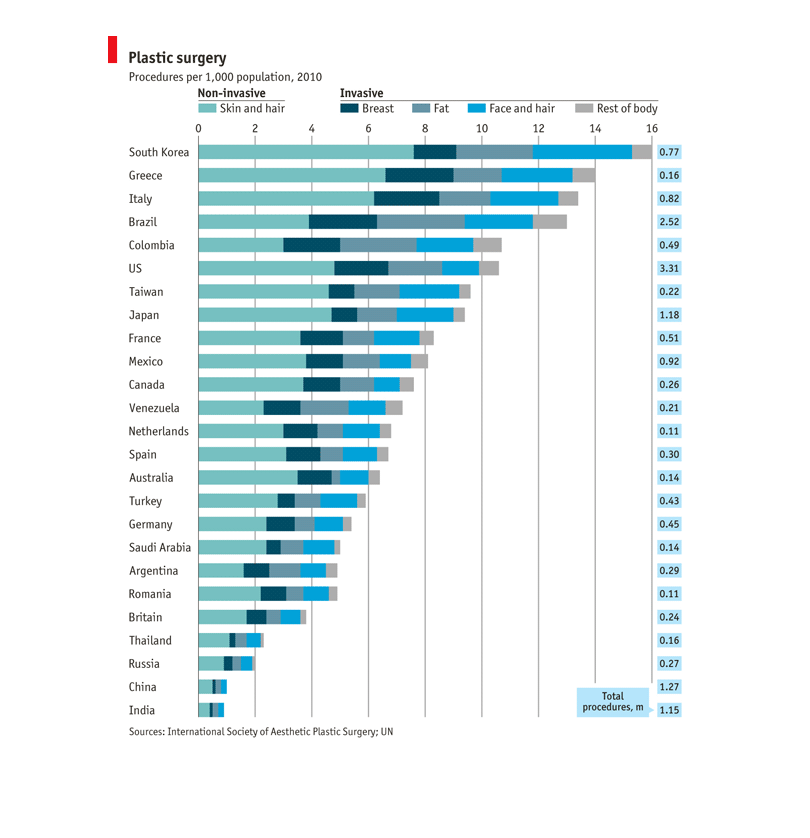
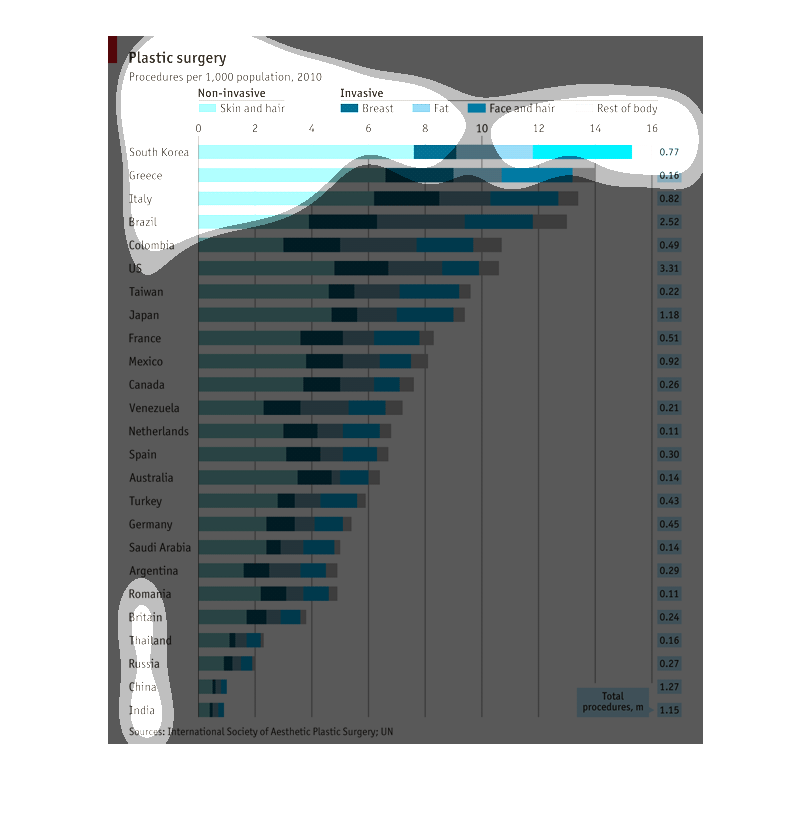
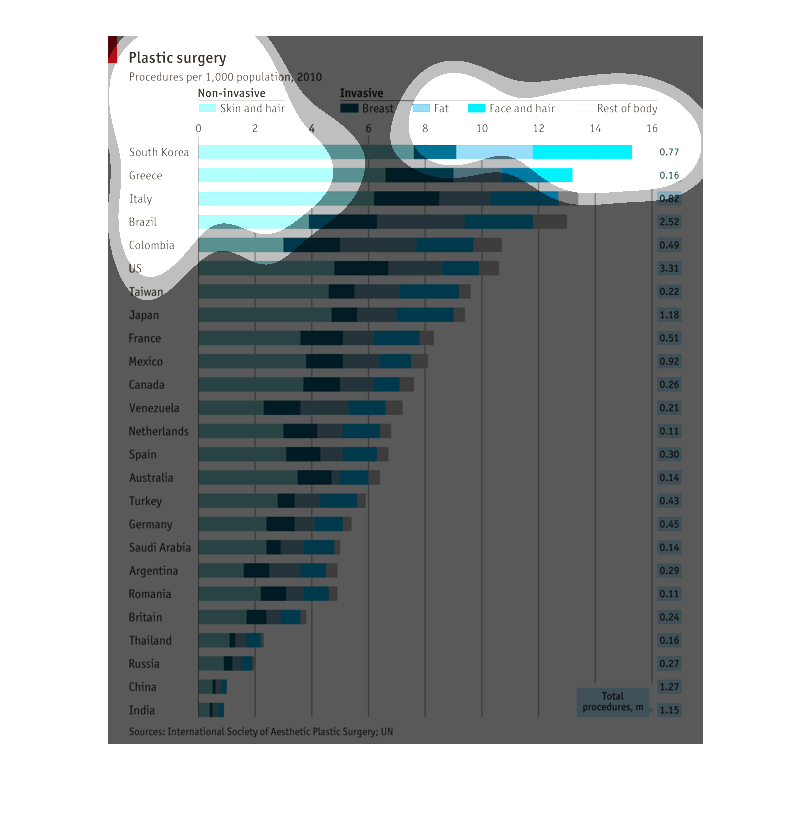
This image is a graph about the number of plastic surgeries in a particular list of countries.
The graph further breaks down the surgeries into the type of plastic surgery the patients
had done.
This chart shows the number of different types of plastic surgery performed in a number of
countries around the world, by type/category of surgery. South Korea has the most procedures
done.
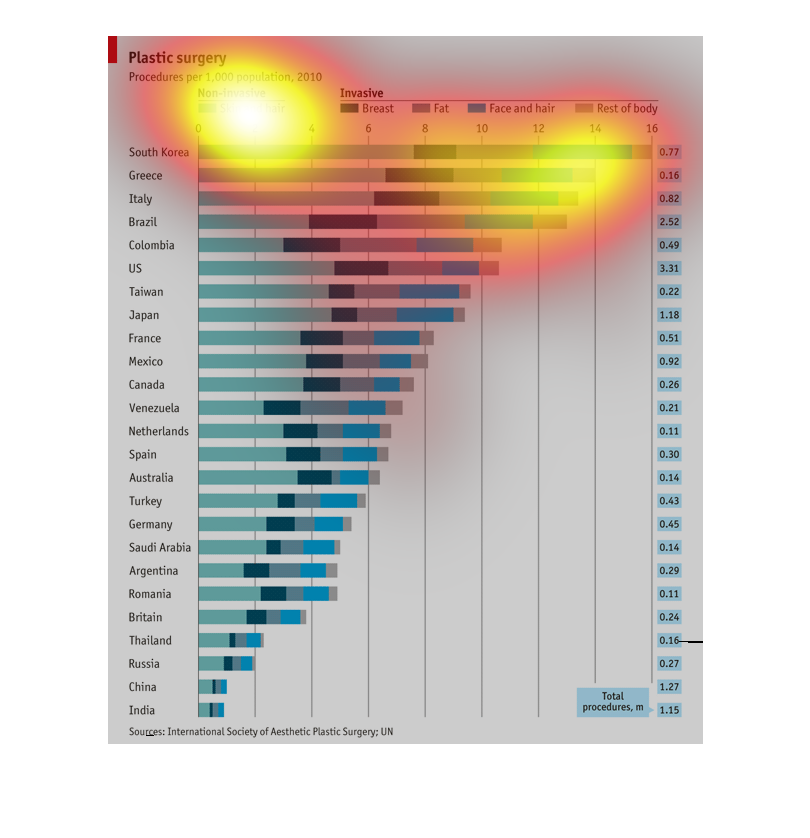
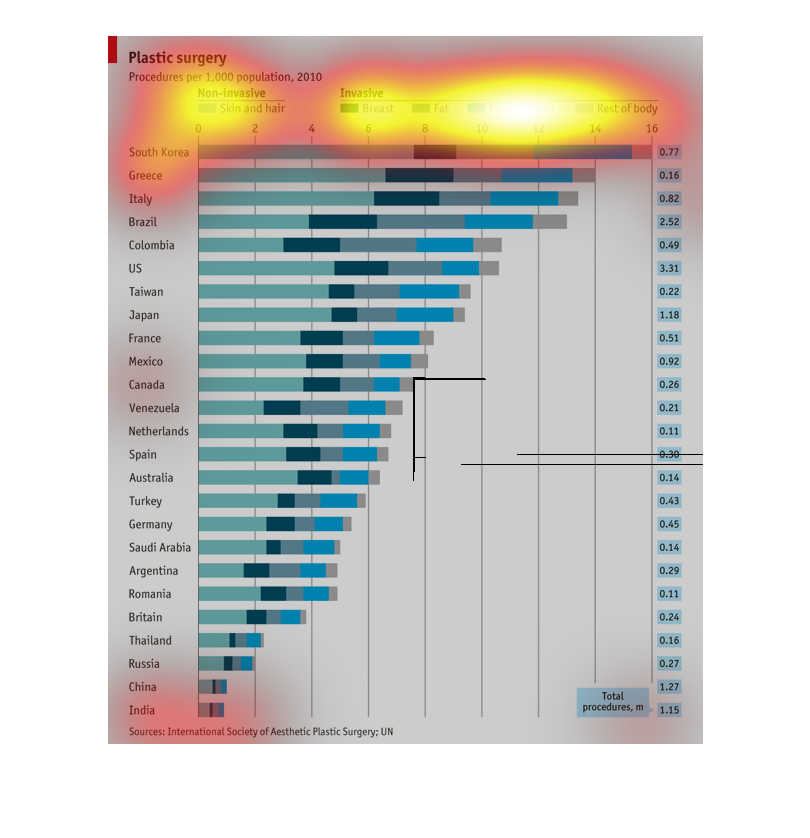
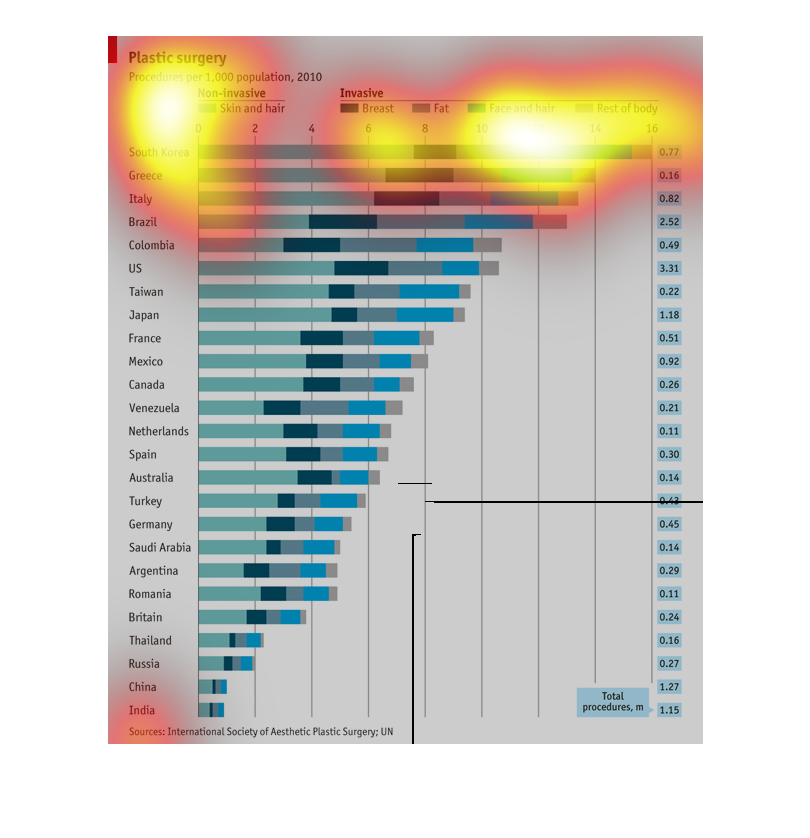
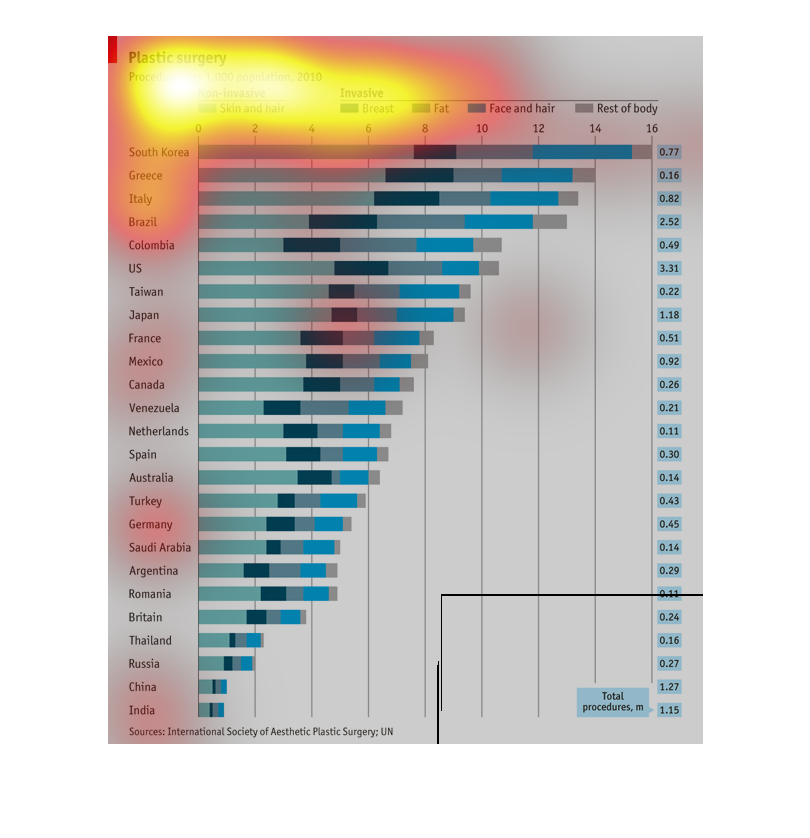
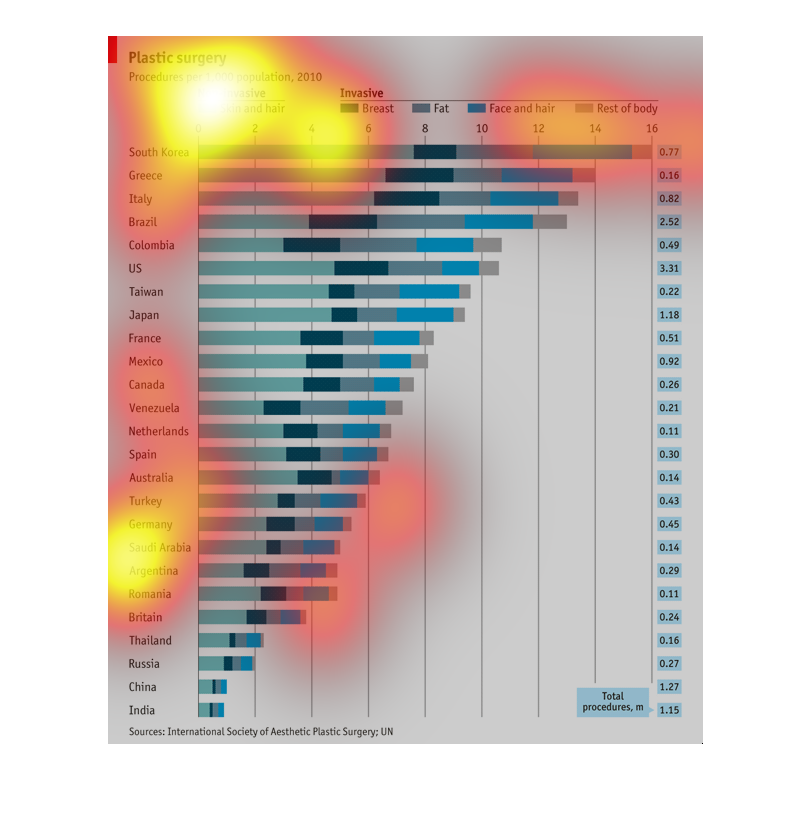
This image describes the plastic surgery procedures performed per 1000 people in 2010, by
country. Procedures assessed are skin and hair, breast, fat, face and hair, and rest of the
body. India has the lowest proportion of skin procedures, whereas South Korea has the highest.
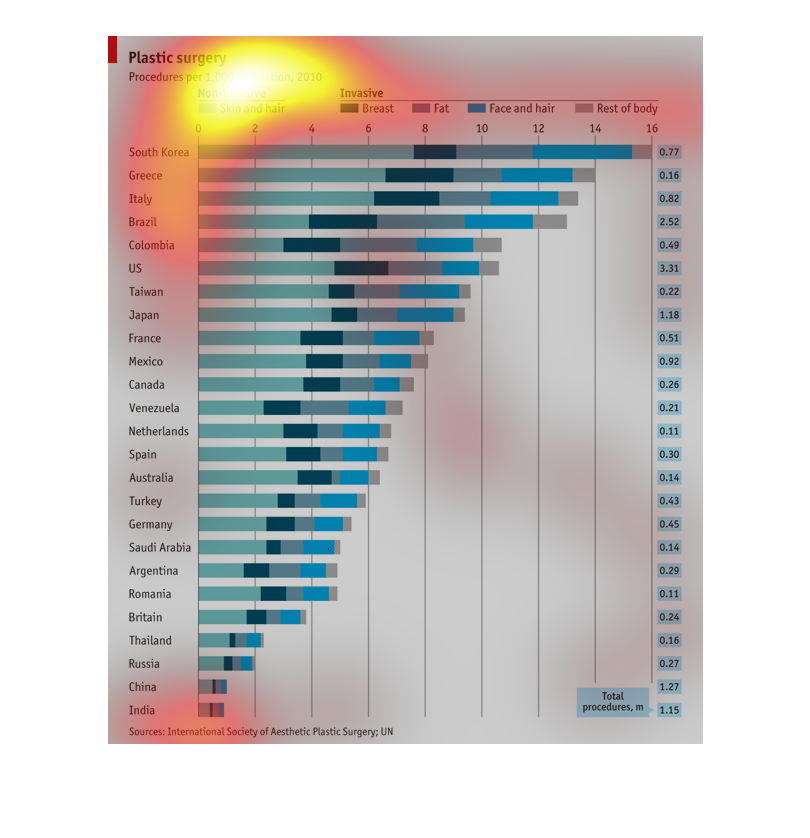
The bar chart shows the number of plastic surgery procedures per 1000 people for the given
countries.  As the number of procedures per 1000 went up the number of "Non-Invasive: skin
and hair" procedures tended to increase by a greater percentage than the other types of plastic
surgery.