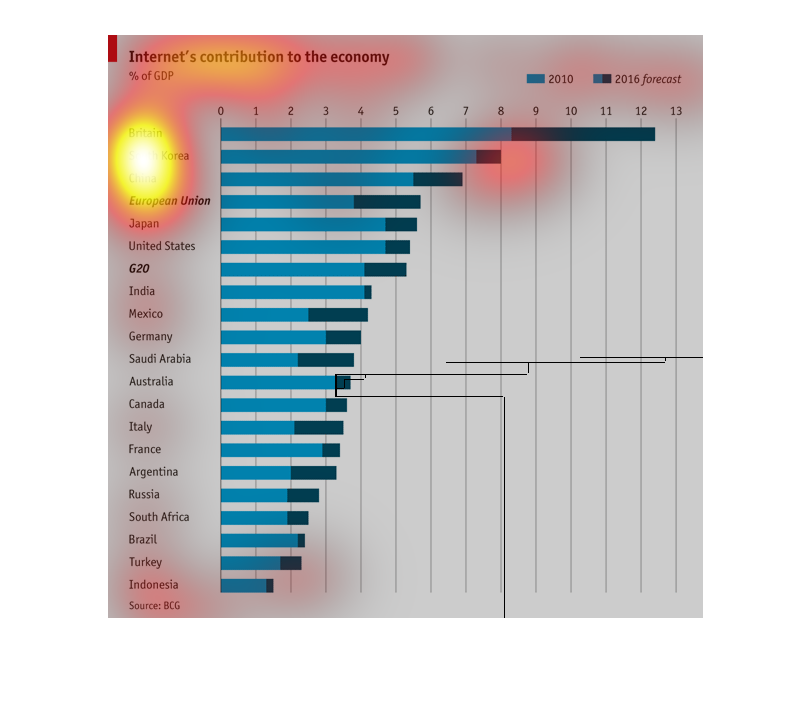
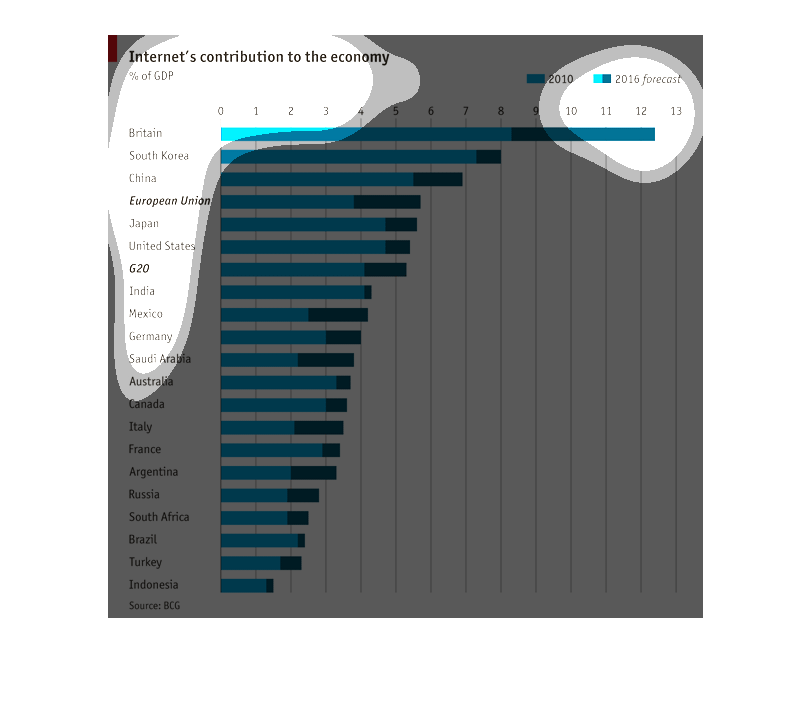
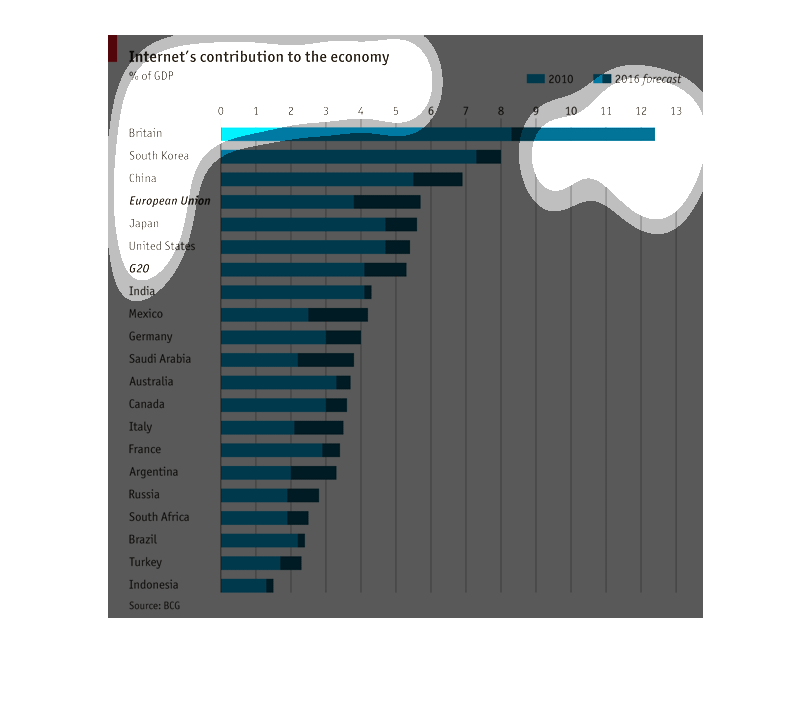
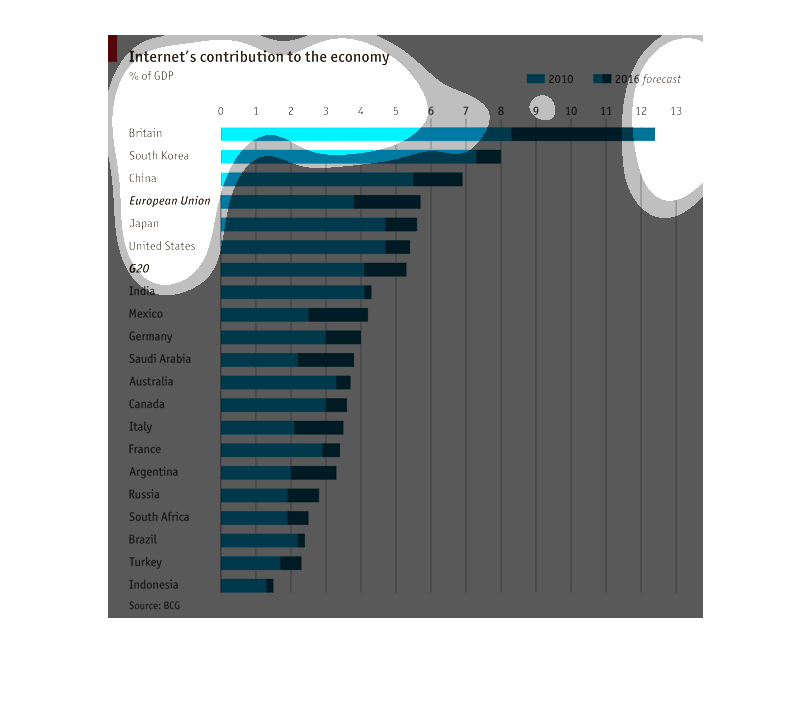
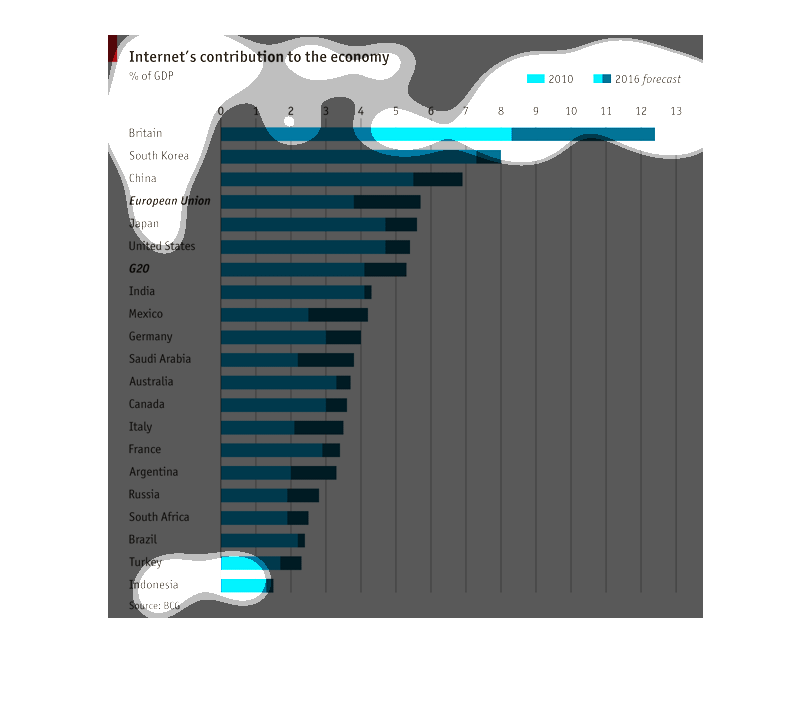
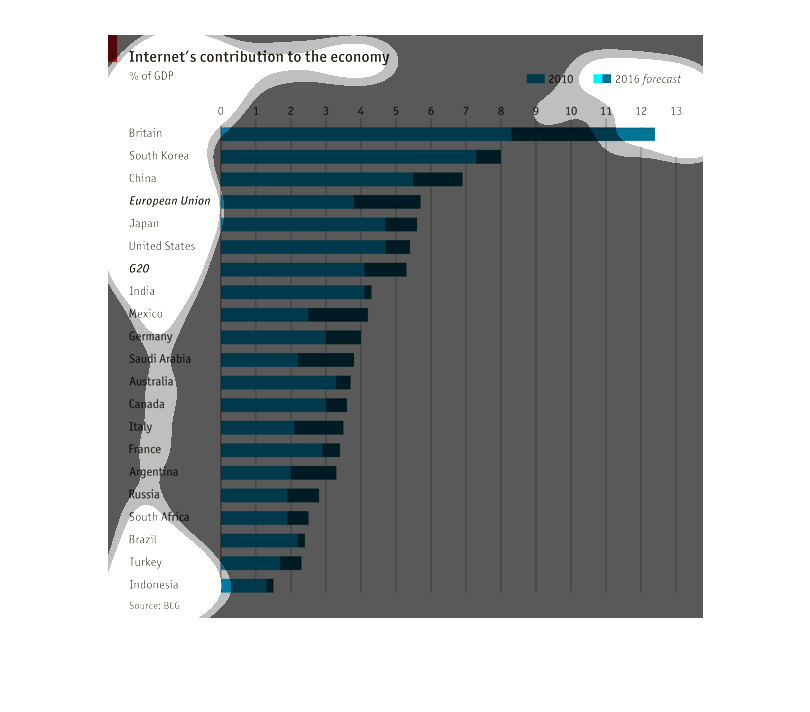
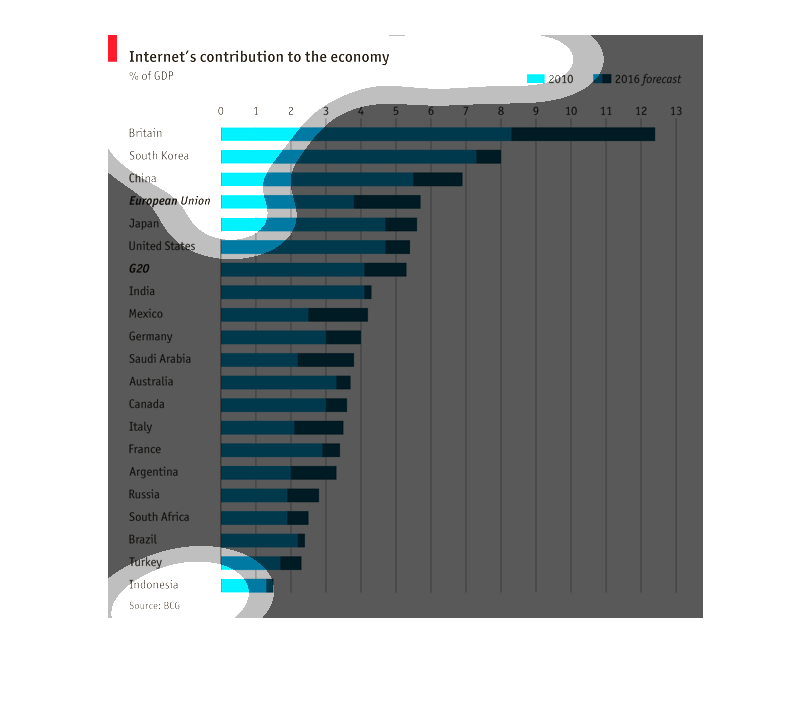
The internet is contributing to the economy of many countries with Great Britain being at
the top and the United States coming in at number eight.  Indonesia is coming in last.
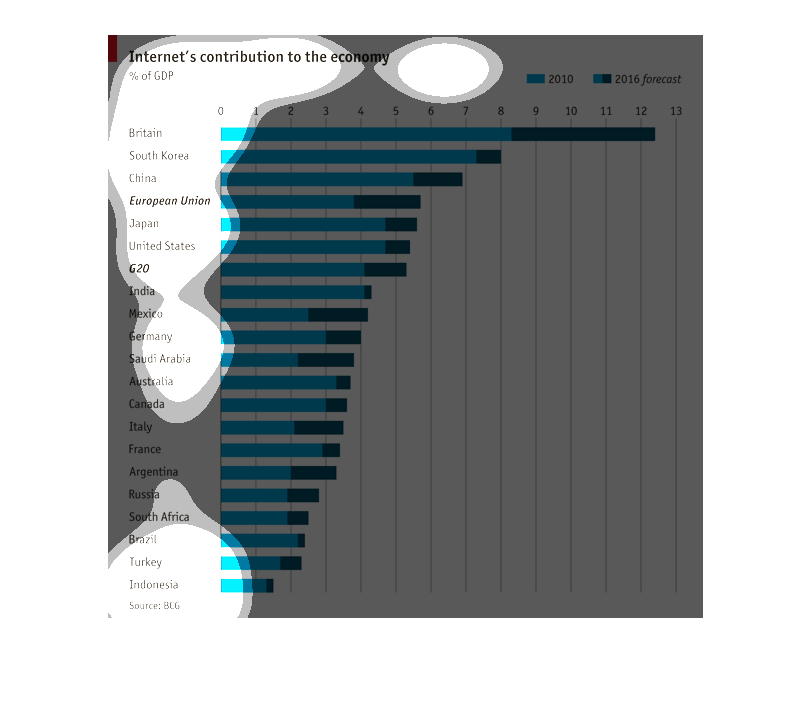
Title of the bar is "Internets contribution to the economy".  The represented numbers are
the % of the GDP of represented nations.  The blue portions of the bars on the graph represent
the % of the GDP in 2010.  The darker portion of the bars represents the forecast of the GDP
in 2016.  The nations represented are in order from highest to lowest % of GDP; Britain, South
Korea, China, the European Union as a whole, Japan, The United States, G20 as a whole, India,
Mexico, Germany, Saudi Arabia, Australia, Canada, Italy, France, Argentina, Russia, South
Africa, Brazil, Turkey, and Indonesia.  The source cited is BCG.
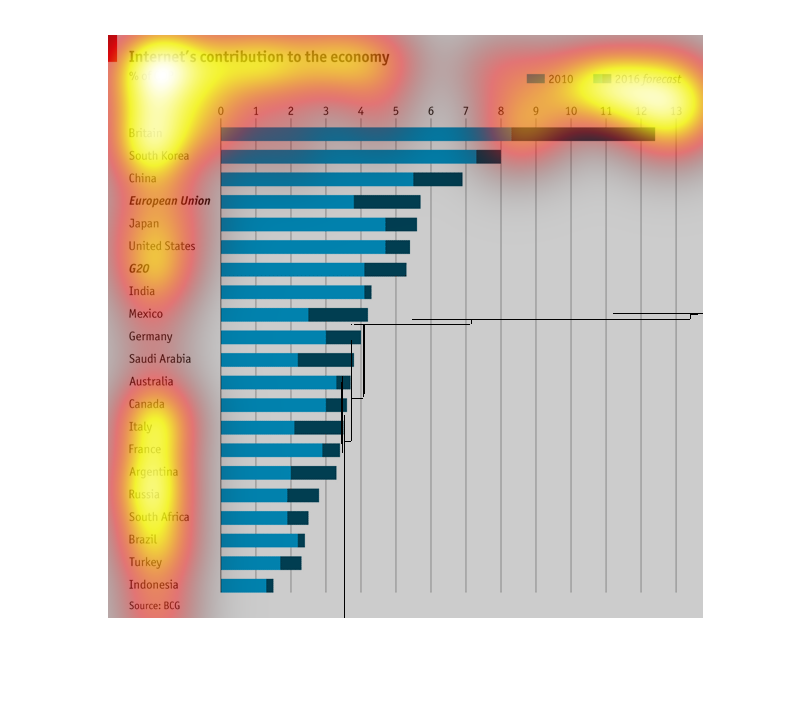
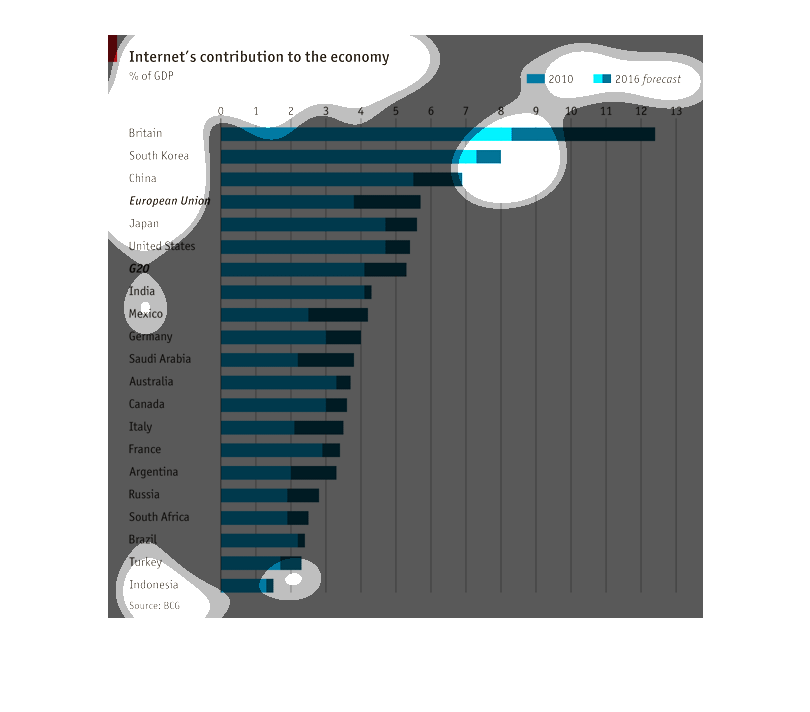
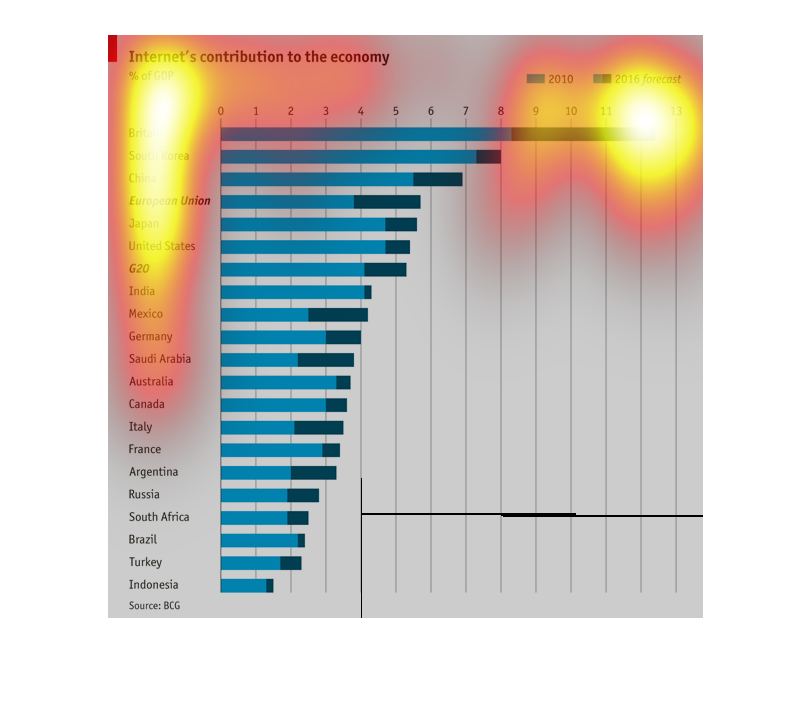
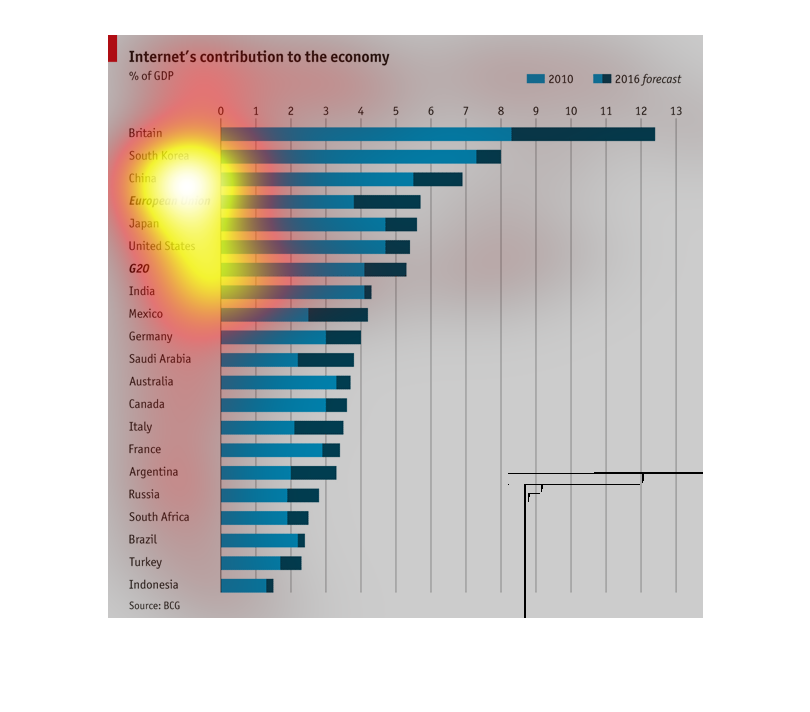
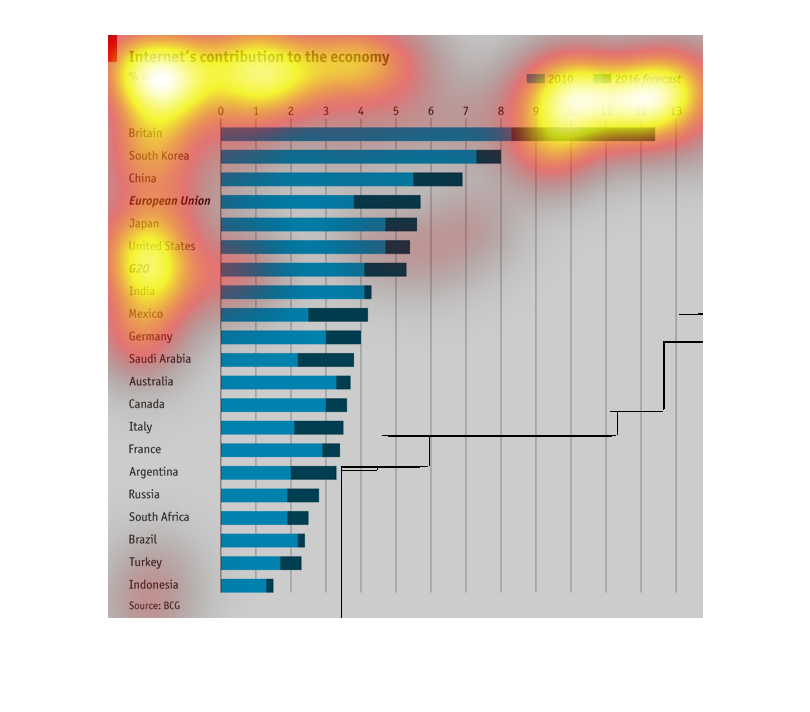
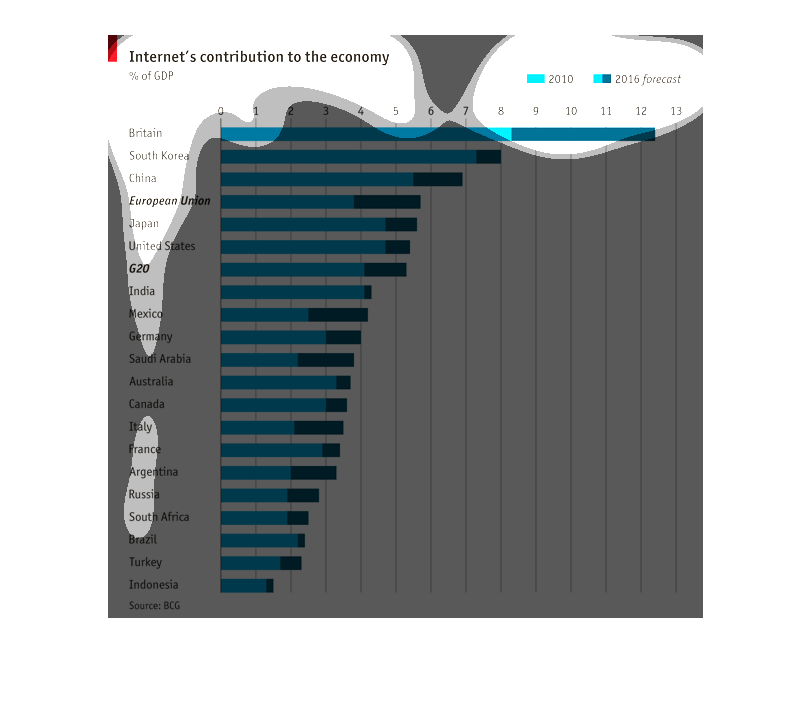
This graph shows the amount of GDP that the internet contributes to, as a percentage, in different
countries around the world. Britain, South Korea and China round out the top three most heavily
reliant countries on the internet.
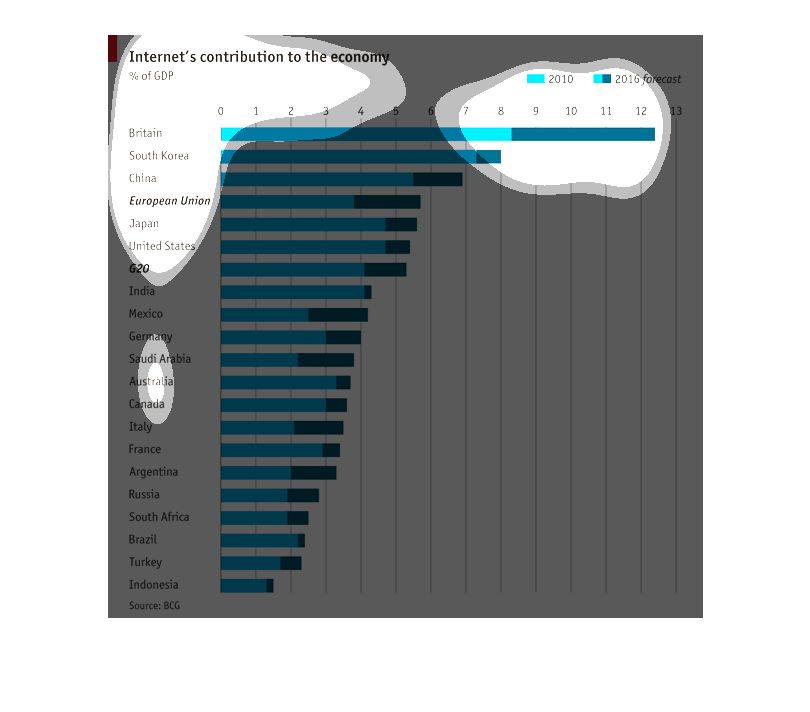
This is a graph showing how much the internet contributed towards a country's economy. The
light blue bar shows how much the internet contributed towards that country in 2010, the darker
blue bar shows how much more is expected in the year 2016.
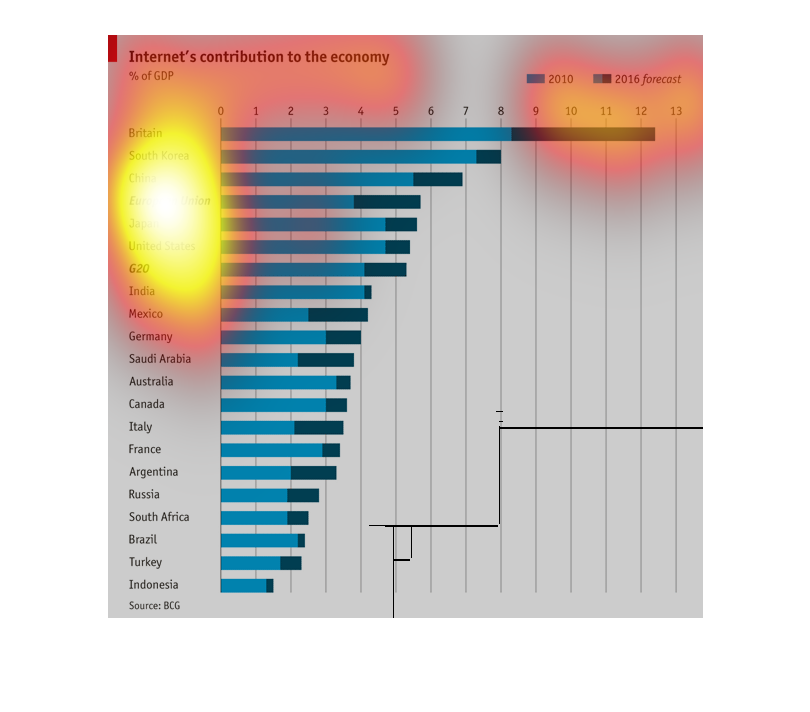
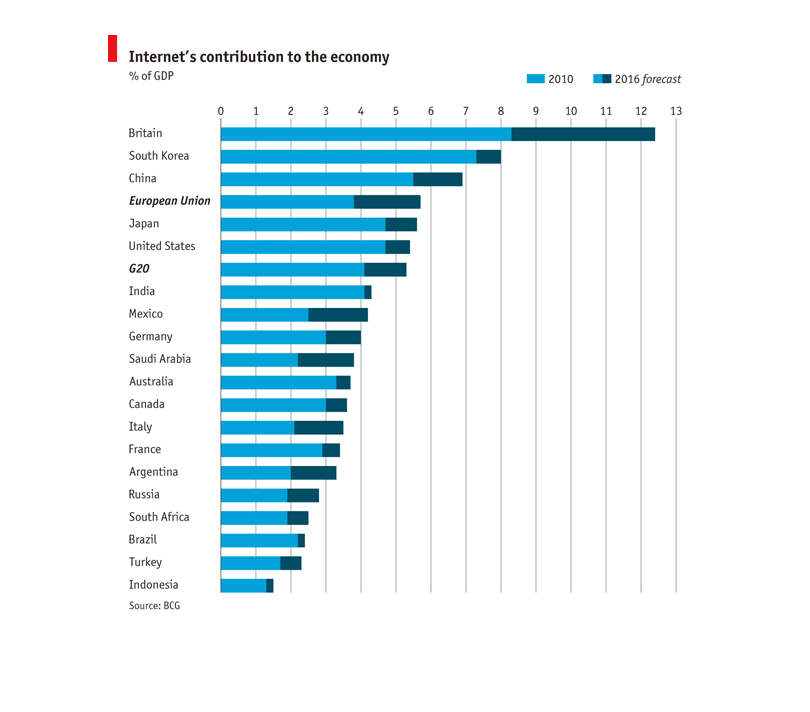
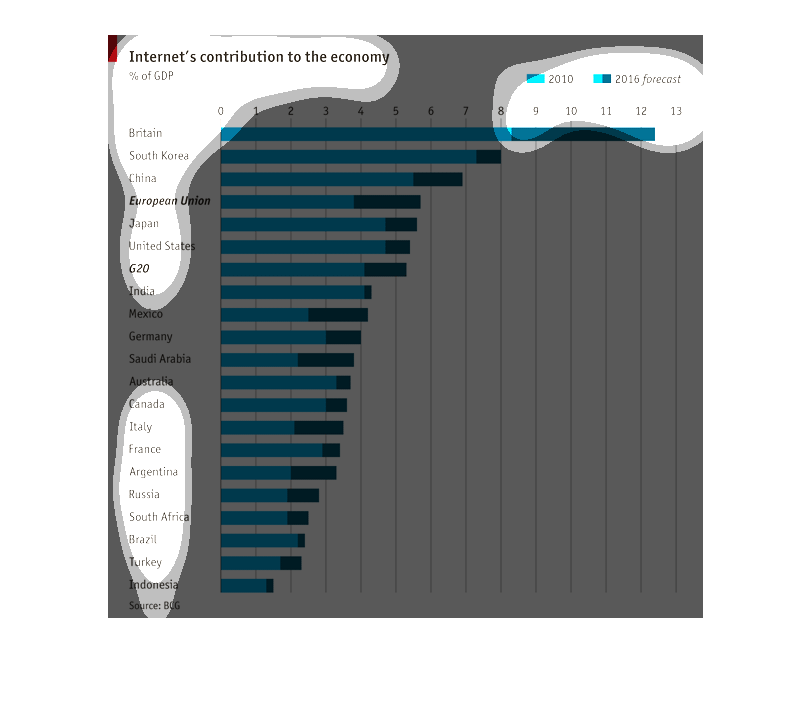
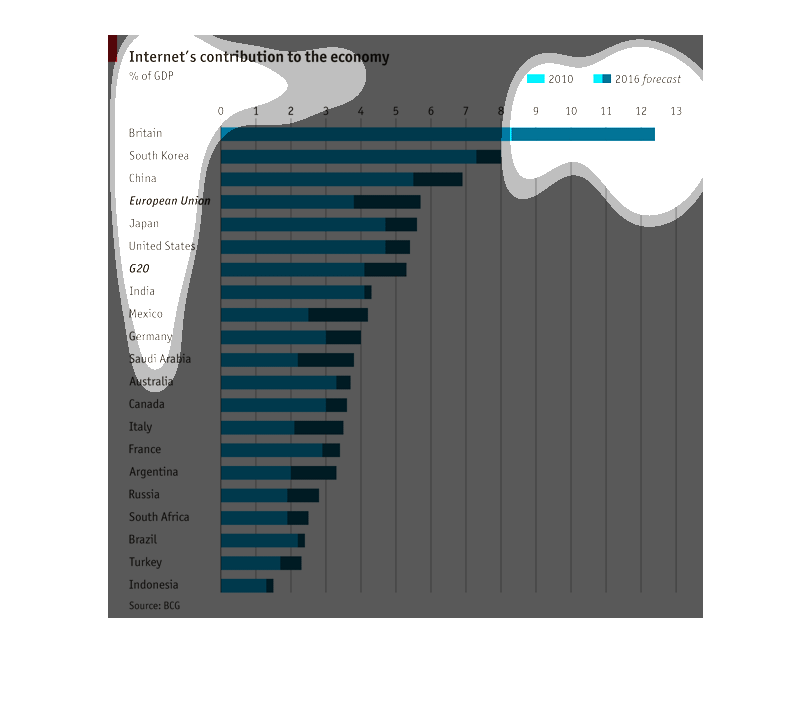
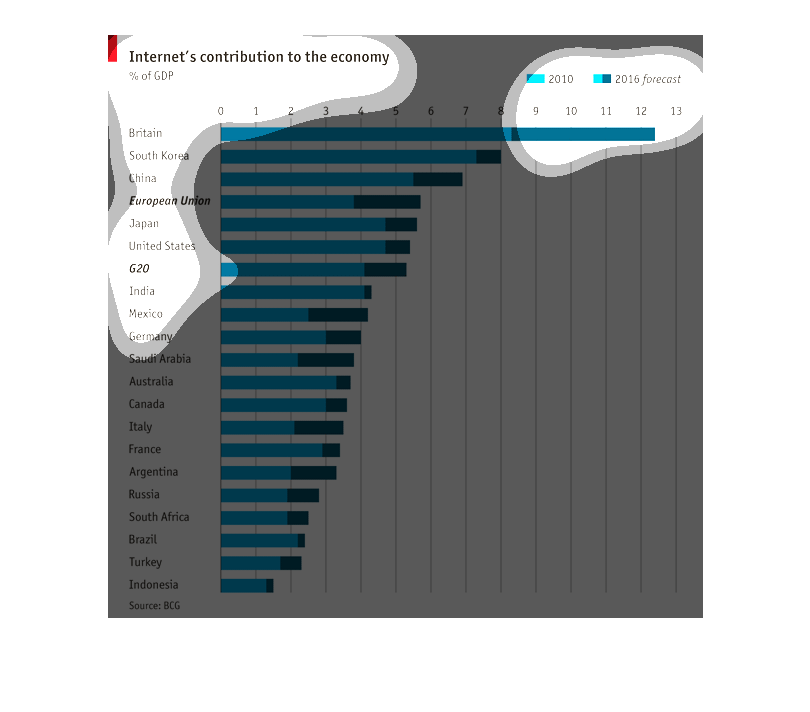
This bar graph compares the internet's contribution to the economy. It shows the trend for
2010 and the forecast for 2016. Leading the contribution is Great Britain.
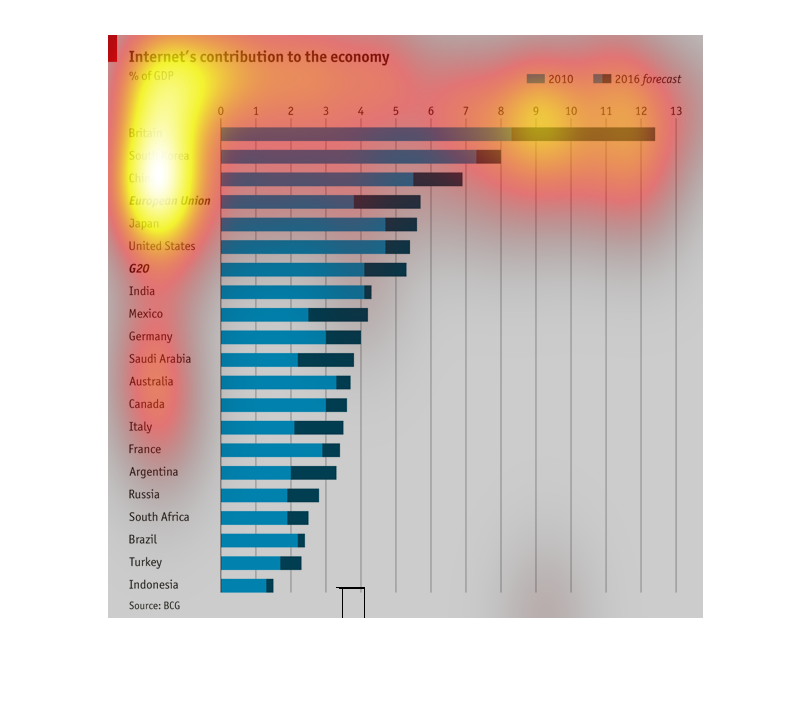
This graph represents the internet's contribution to the economy as a percentage of GDP over
a wide spread of countries. The latest data represented on the graph is from 2010, with an
estimated projection for 2016. Britain leads in share of internet contribution to GDP at more
than 8% and a forecast of more than 12% in 2016. South Korea , China, the EU, and Japan are
also ahead of the United States in this market according to projections.
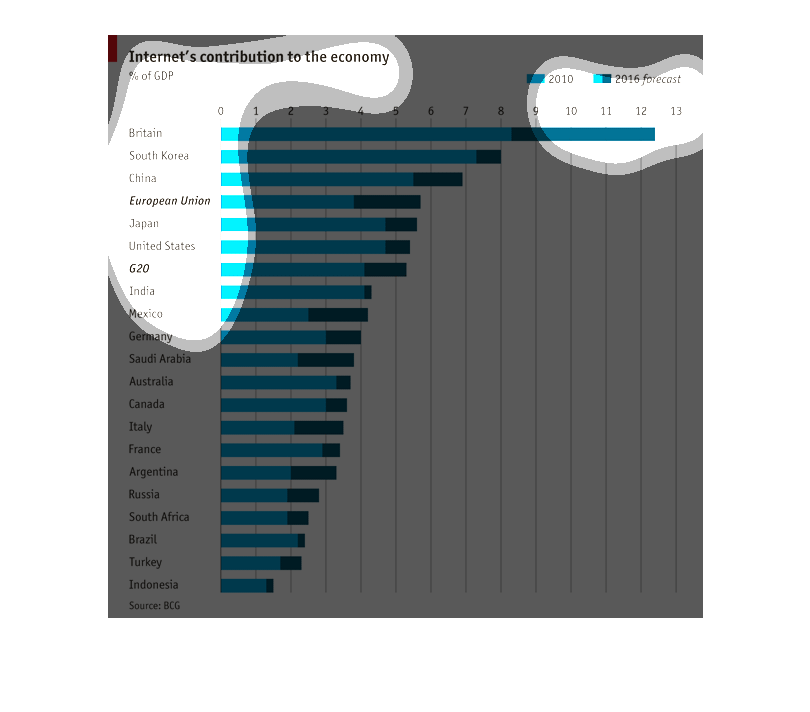
This chart graphs the amount of GDP contribution that the social networking site "Facebook"
has made to several different countries across the world.
Here is a chart that measures the internet's contribution to the economy as a percent of GDP.
Individual countries as well as governing bodies such as the European Union are taken into
consideration.
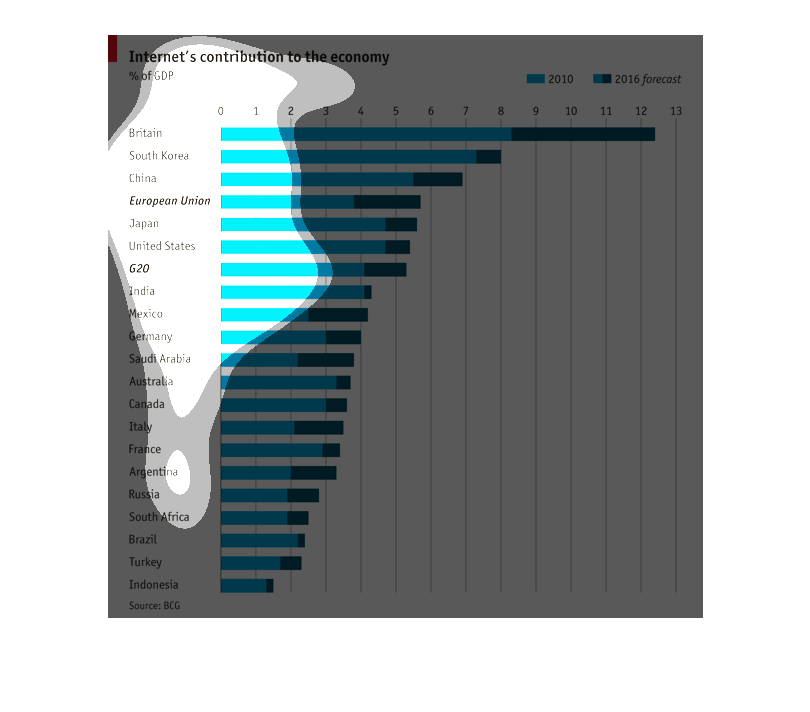
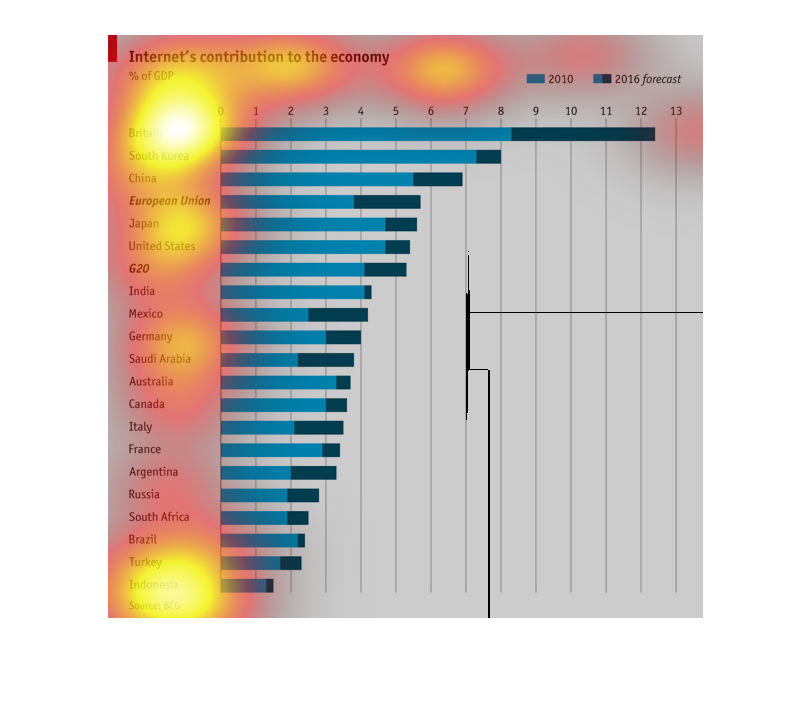
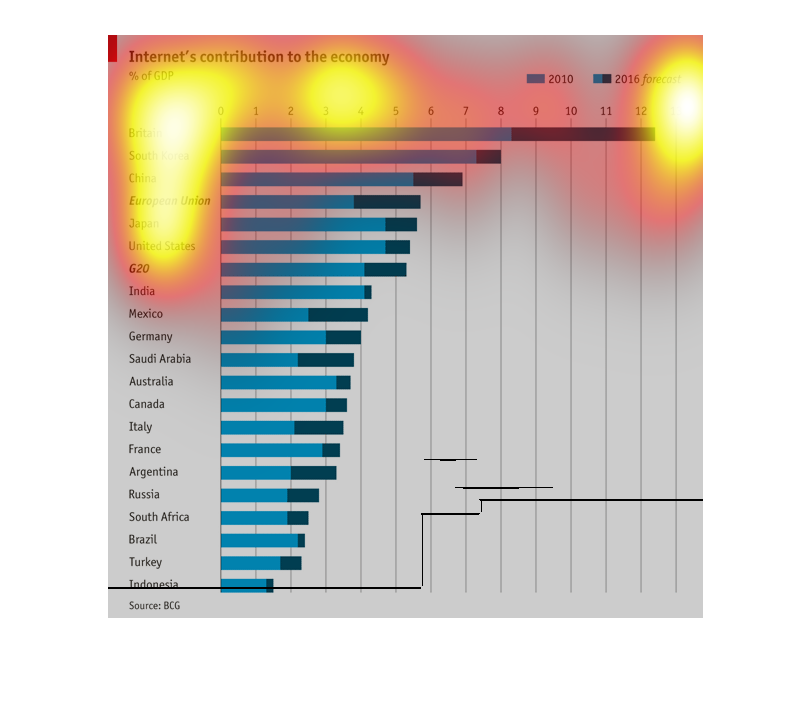
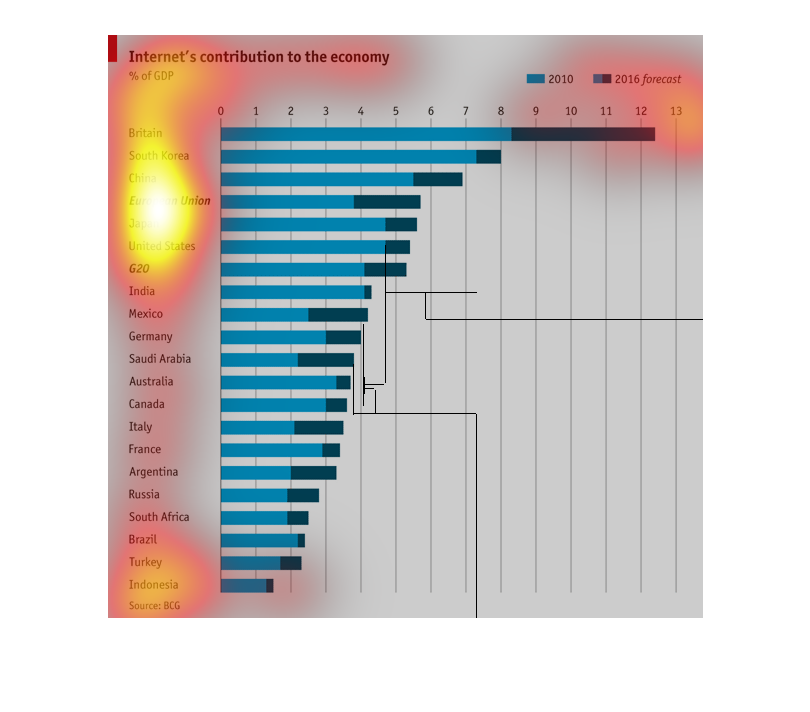
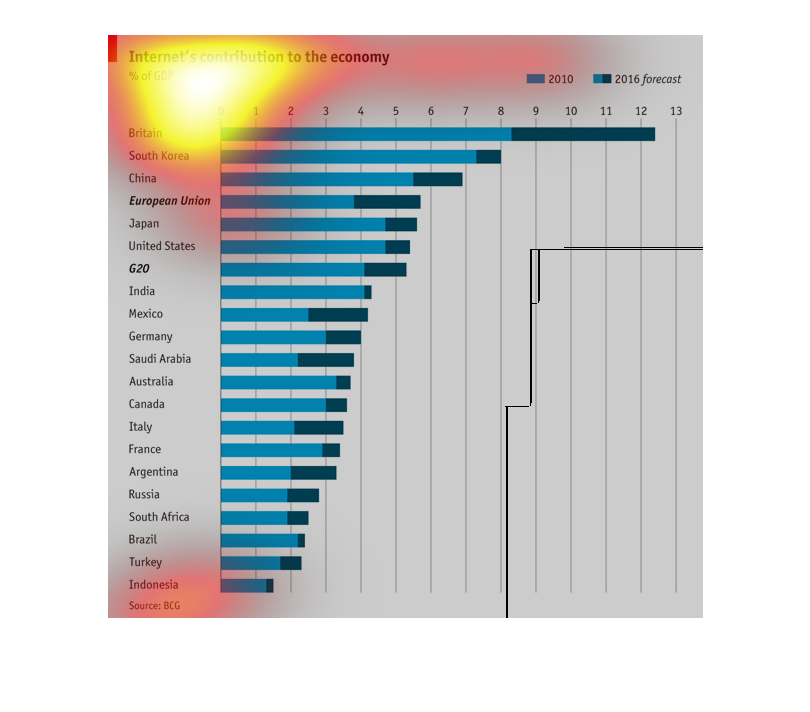
This graph describes the internet's contribution to a nation's economy as a percent of GDP
in 2010 and 2016 (forecasted). Britain ranks the highest at over 8% in 2010 and over 12% in
2016. Indonesia ranks the lowest at just over 1% in 2010 and 2016.
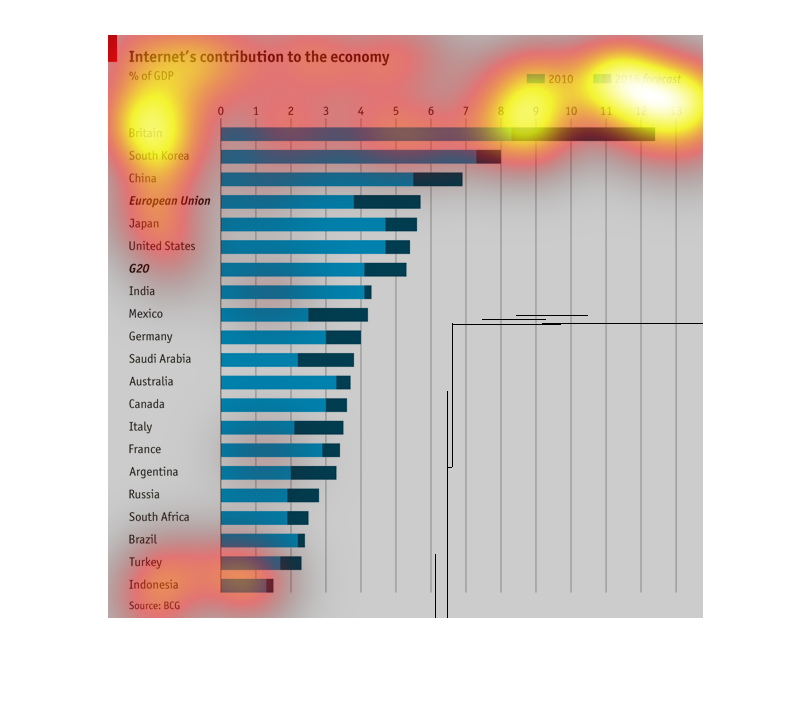
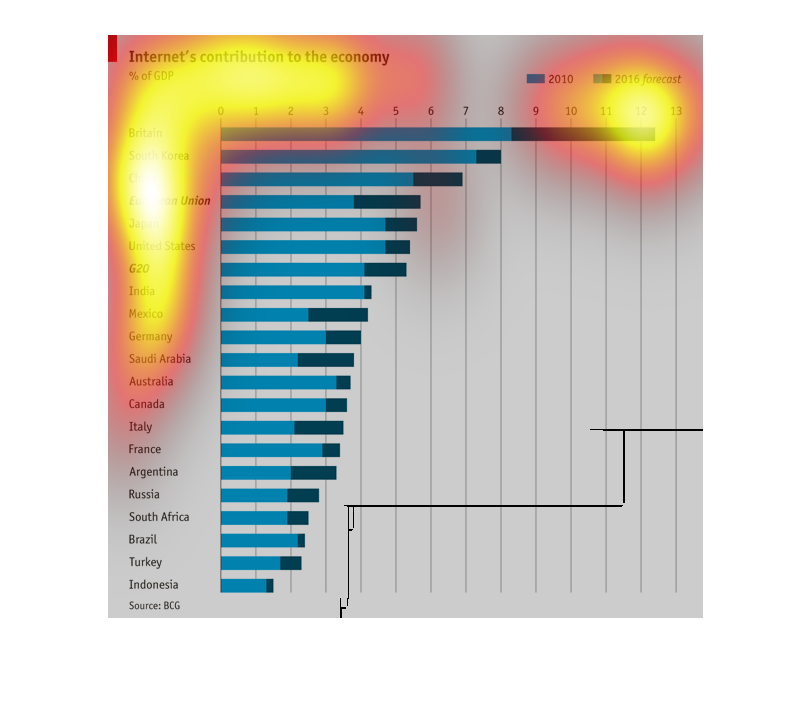
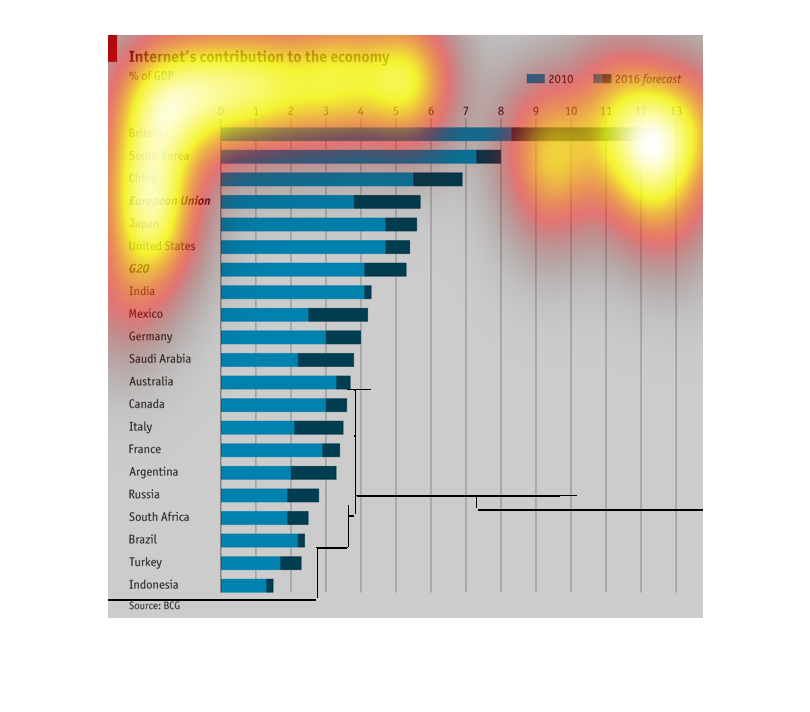
This graph provides information about the internet and it's contribution to the economy in
percentage of GDP by country.  The left hand column of the graph lists countries, where as
the bars corresponding to each country expands towards the right according to it's numbers.
This chart shows the Internet's contribution to the economy of various countries around the
world in 2001 compared to the expected in 2016. This is measured as a percentage of the GDP.
Britain has the highest both in 2001 and a prediction for 2016. Indonesia is the lowest for
both.
This chart described the Internet's general contribution to the economy in various countries
around the world, in terms of % of GNP. Actual numbers are provided for some years and 2016
contribution is forecast.
This chart depicts the internets contribution to the economy as reflected in percentage of
GDP in different countries. The highest contribution was in Britain and the lowest was in
Indonesia.
The following graph shows the economic impact the internet has on major countries worldwide
as a percentage of GDP. The light blue bar represents the 2010 economic impact by country.
The dark blue bar is the forcasted economic impact for the year 2016.
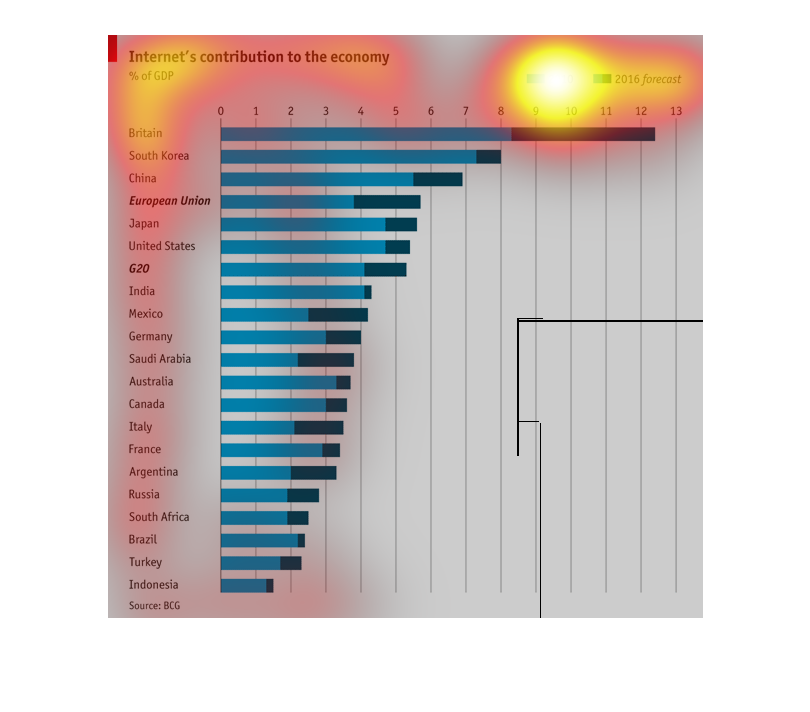
As percentage of the GDP, this maps countries internet contribution to the economy in 2010
and forecasting 2016. All countries listed had a higher projection for 2016. The top three
are Britain, South Korea, and China, all of whom eclipse the entire EU. The lowest polled
is Indonesia at just over 1%.