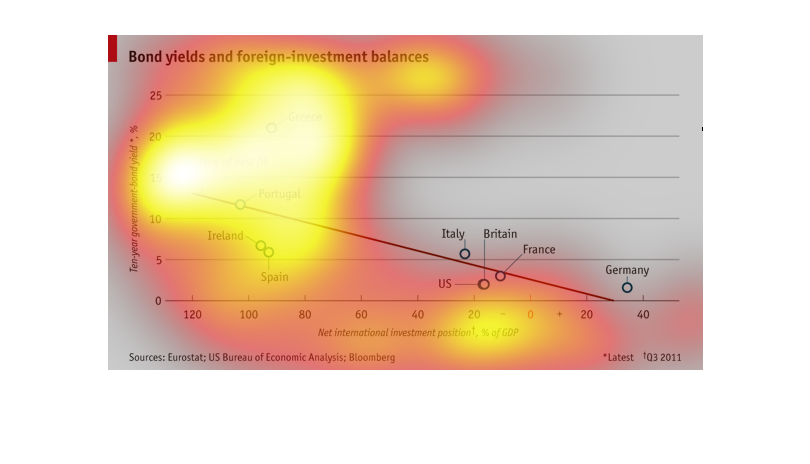
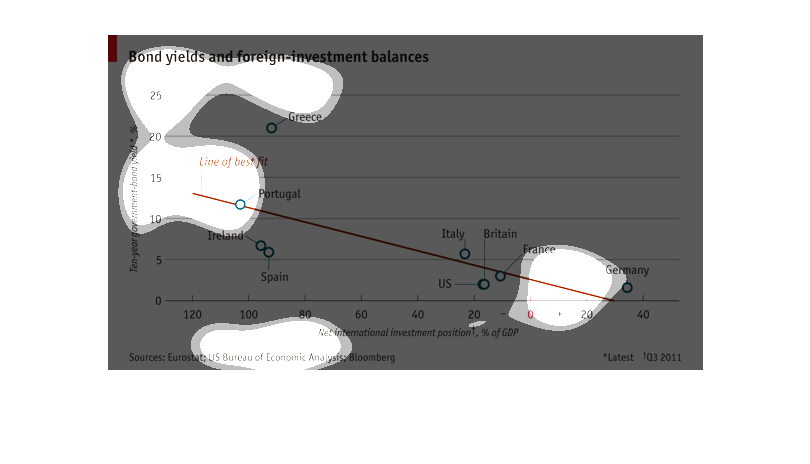
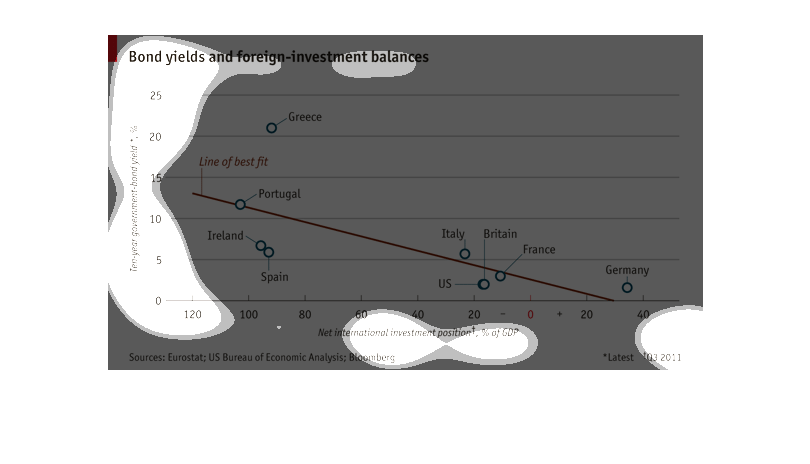
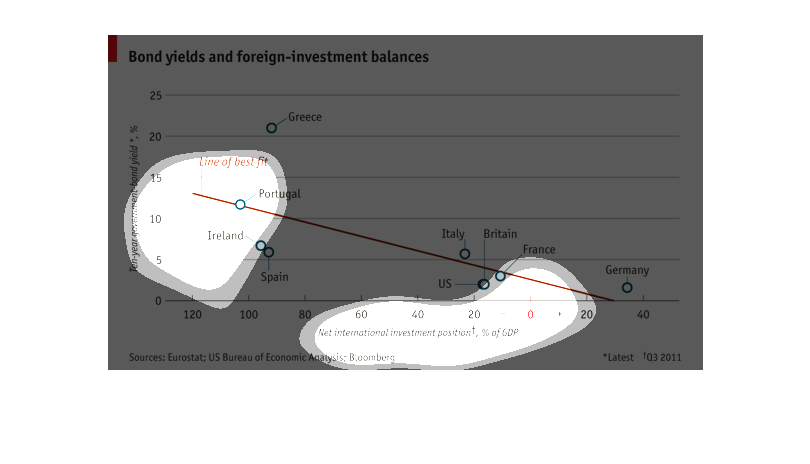
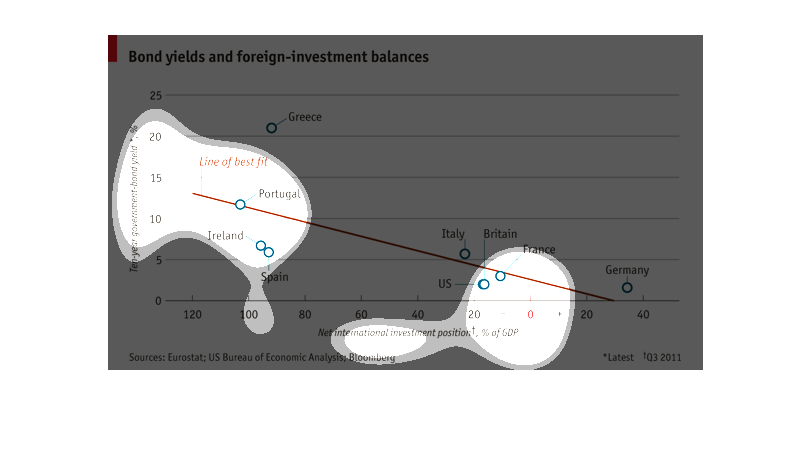
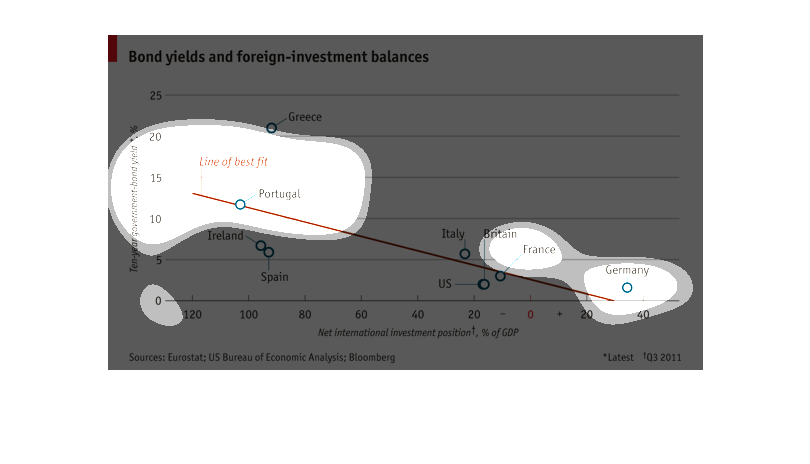
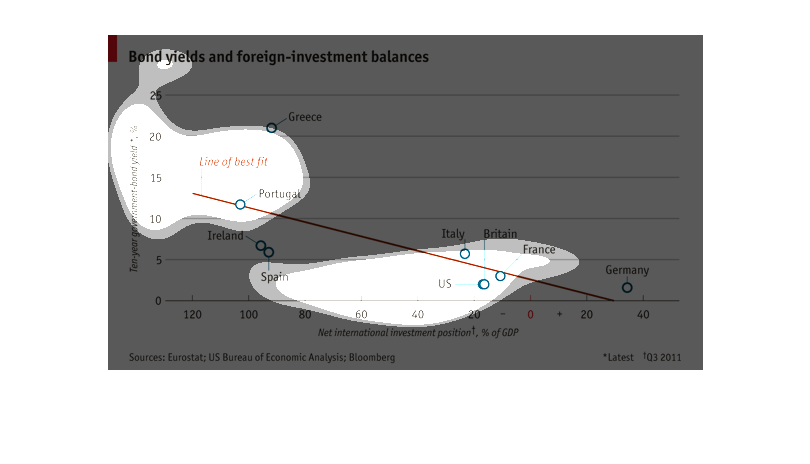
The chart shows a line of best fit and compares the bond yields between several countries.
These countries include Portugal, Ireland, Spain, Italy, Britain, US, France, and Germany.
It compares the top year government bond yield to the international investment position as
a % of GDP.
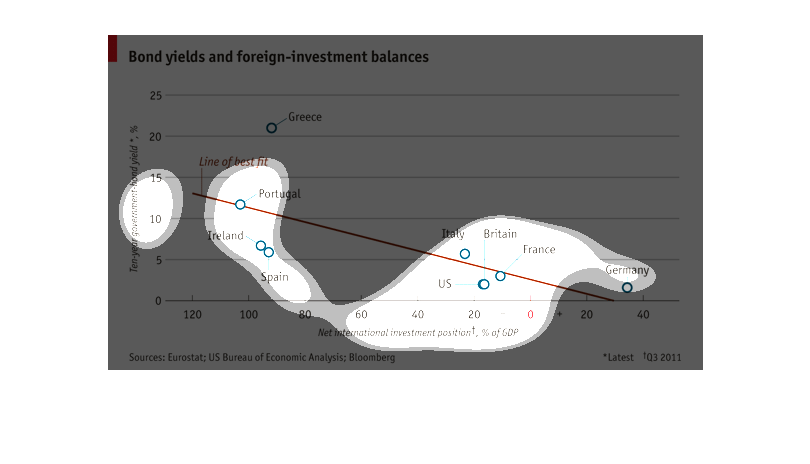
This scatter plot outlines the bond investment and foreign investment from other countries.
 Greece has a high return, Germany and Spain have a lower return on investment.
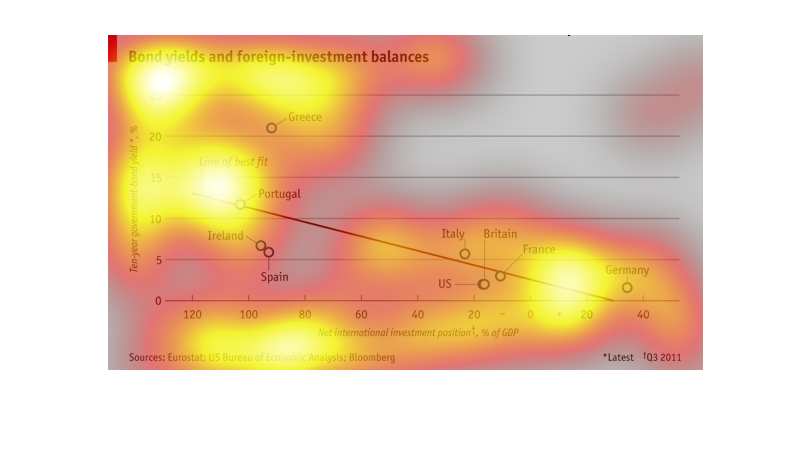
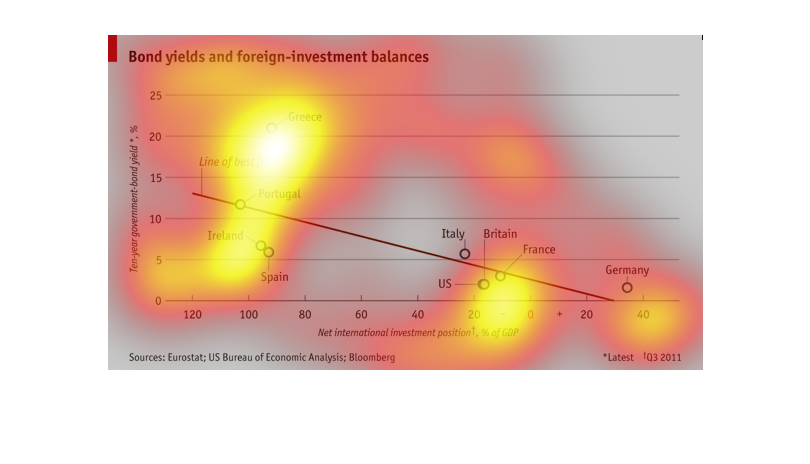
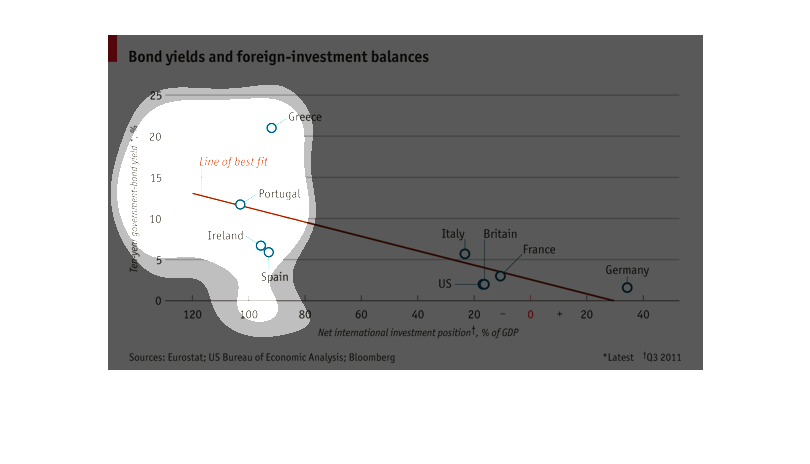
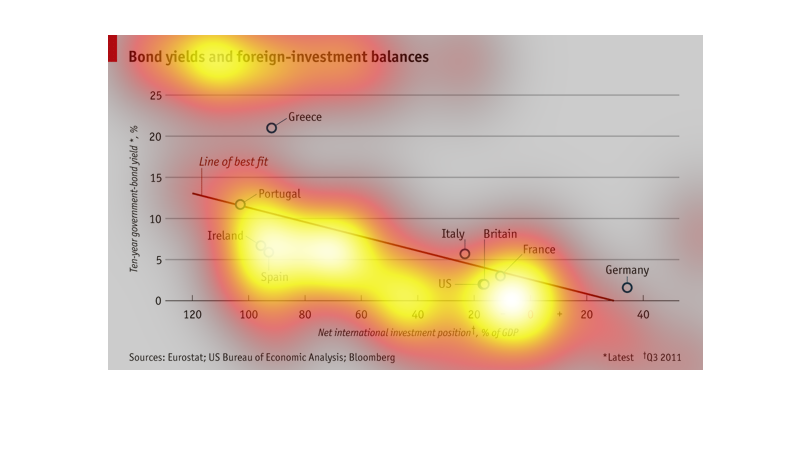
Bond yields and foreign investment balances broken down by countries:  Greece, Ireland, Spain,
Italy, US, Great Britain, France, Germany.  The countries are listed from least GDP to greatest,
left to right.
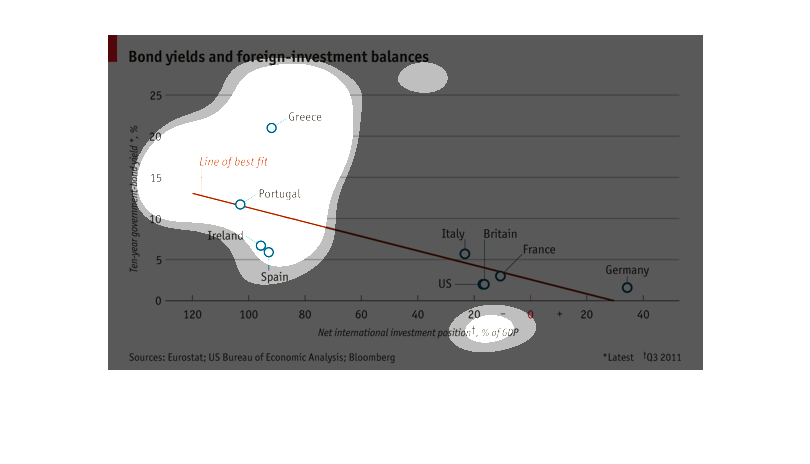
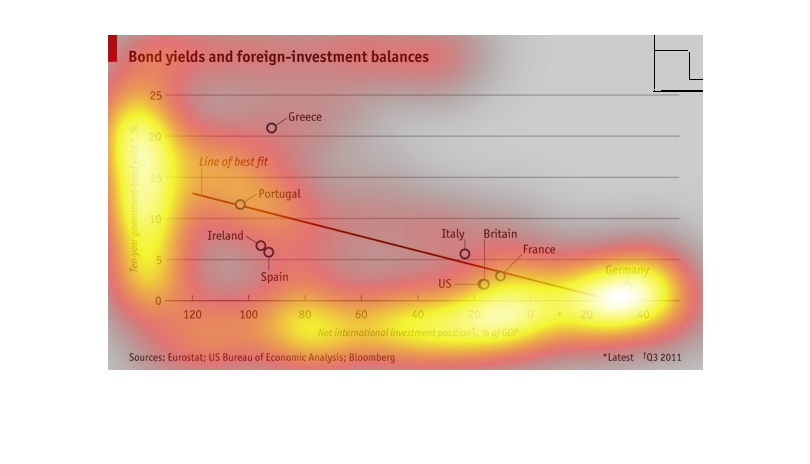
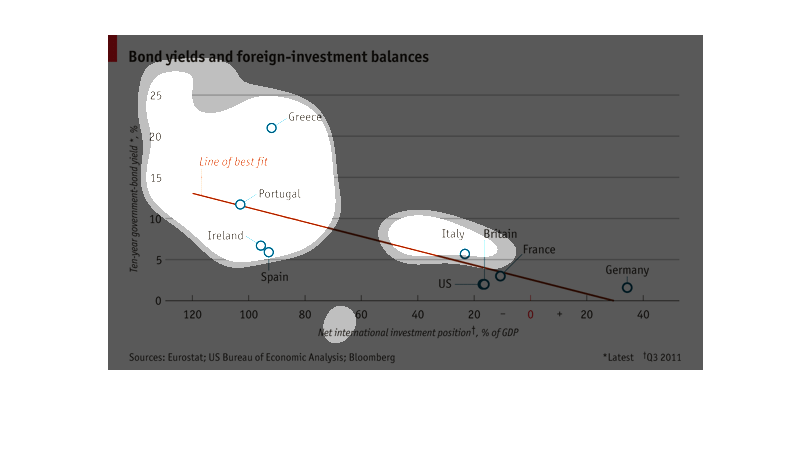
This graph shows bond yields and foreign-investment yields. There are a few outliers such
as Greece, Ireland and Spain. But overall, most countries loosely follow the line of best
fit in a downward trend.
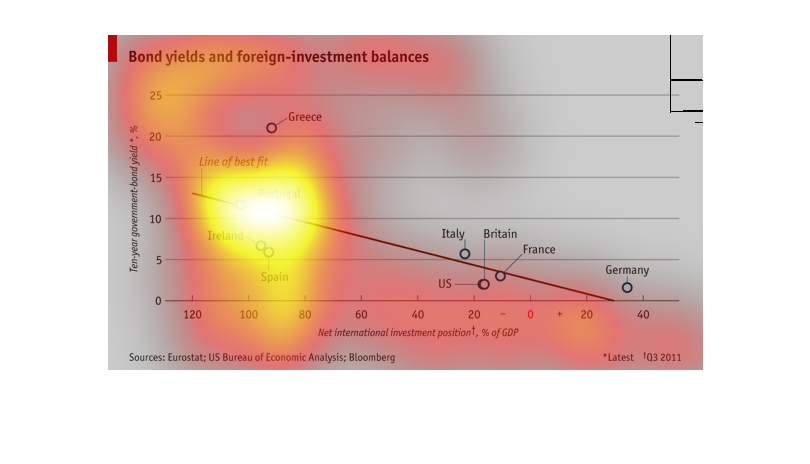
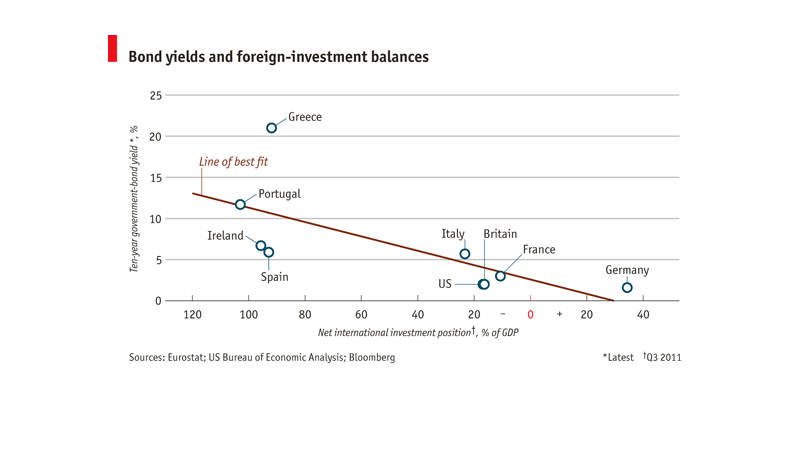
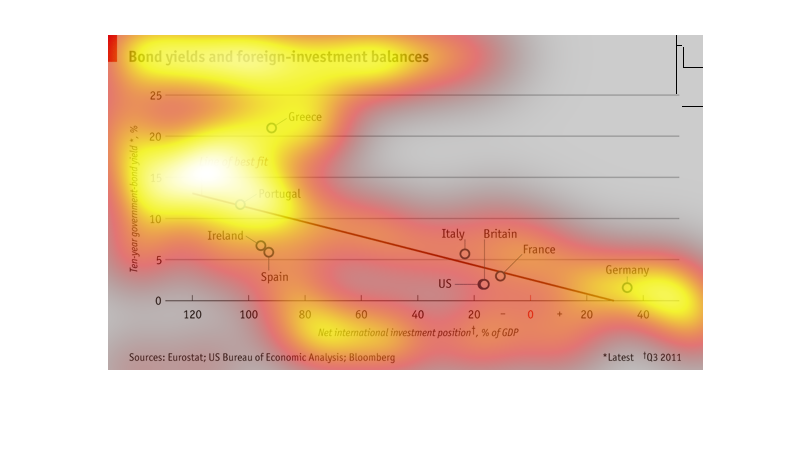
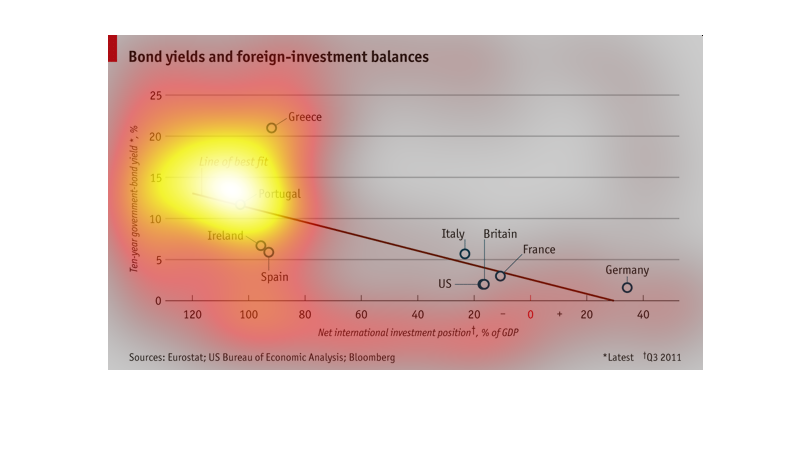
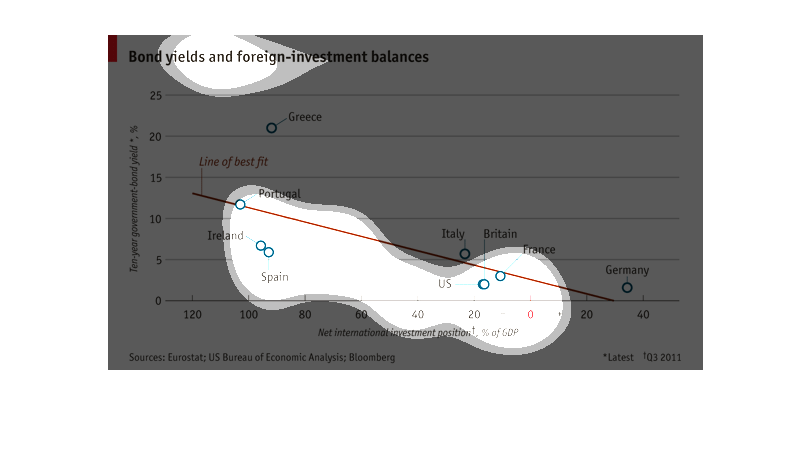
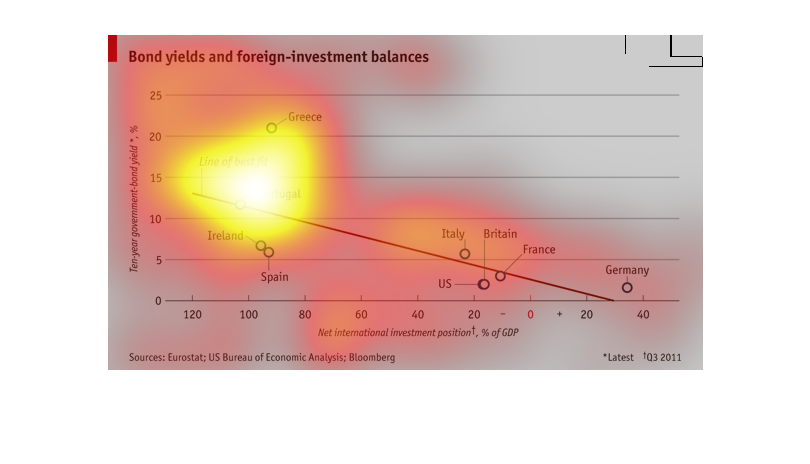
This is a chart showing Bond Yields and foreign investment balance. It also states "Ten year
government bond yield, and they are ranked from 0-25% as of 2011.
This figure is for Bond yields and foreign investment balances. It appears that Greece has
the highest 10 year bond yield. Many countries are around 5% while Greece is around 20%.
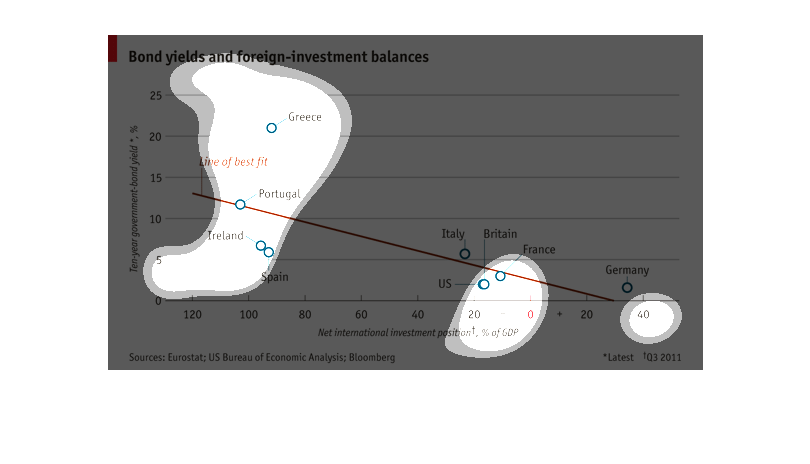
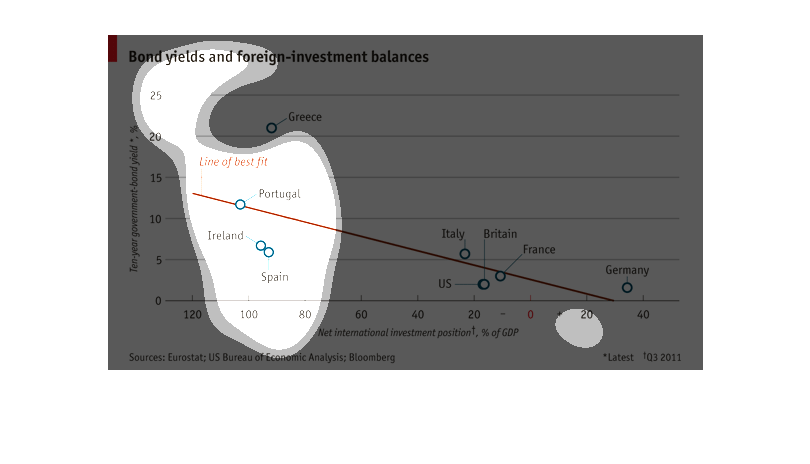
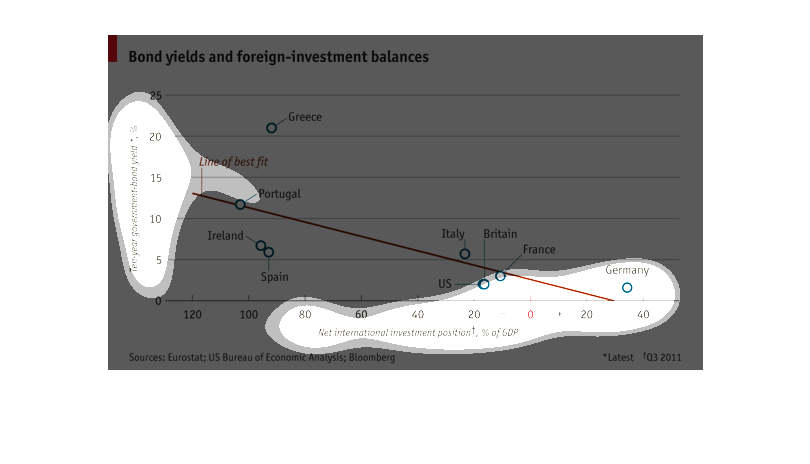
The graph, from the US. Bureau of Economic Analysis, is titled "Bond yields and foreign investment
balances". It graphs the net international investment position, in % of GDP versus Ten-year
government bond yield, in %. It shows the position of various countries with a line of best
fit passing through them indicating a negative correlation coefficient.
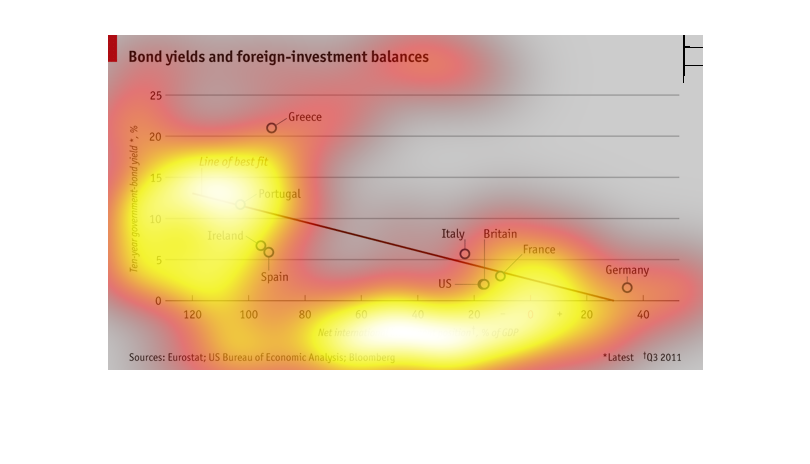
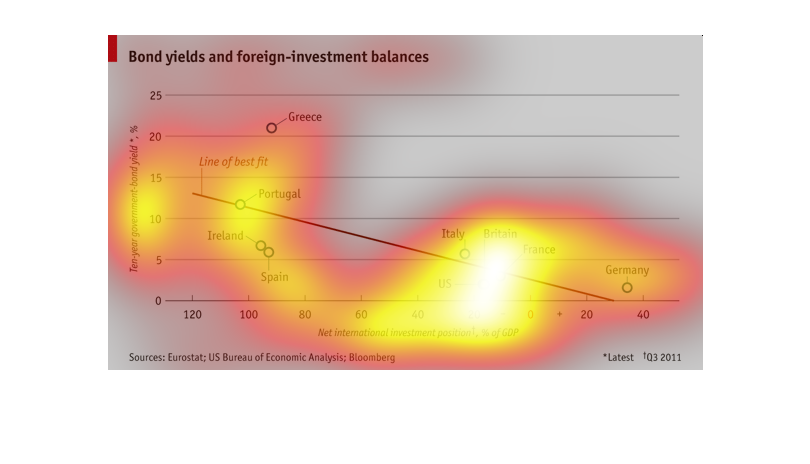
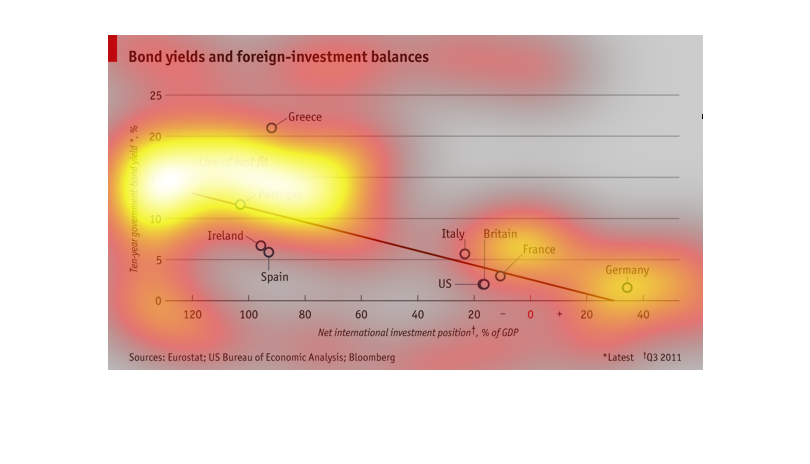
This chards describes bond yields and foriegn investment balances.  The X-axis represents
the Net International Investment position, Percent of GDP and the Y-axies represents the Ten
Year Government Bond Yield, Percent.  Greece outranks all other countries in terms of net
international investment and government bond yield.
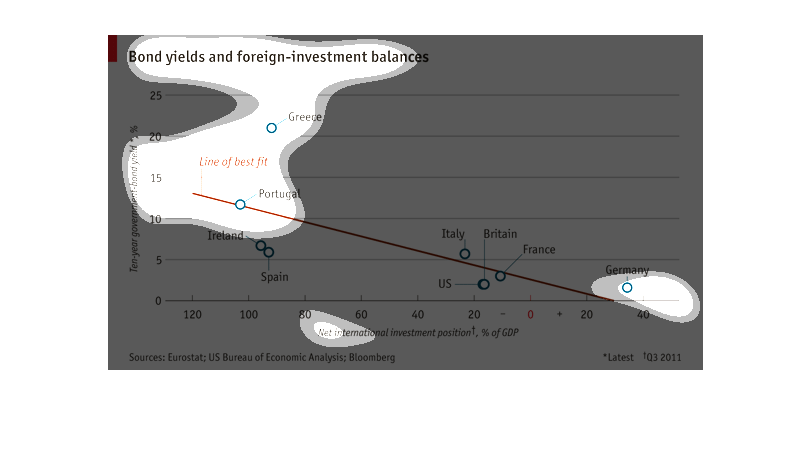
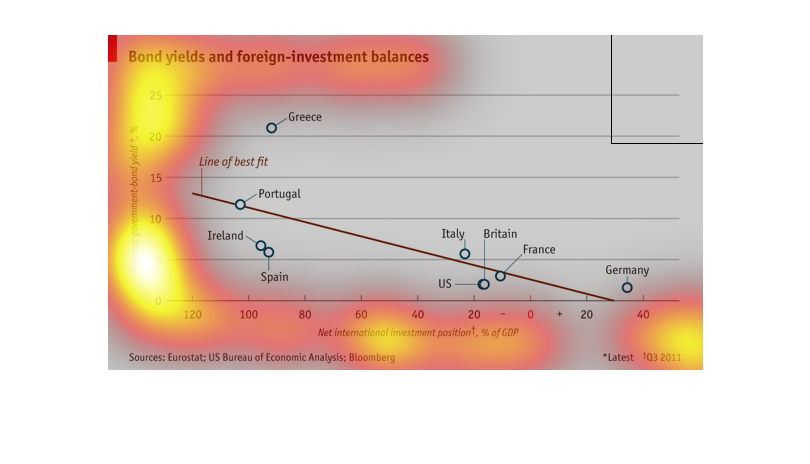
This chart shows bond yields and foreign investment balances over a ten-year government-bond
yield set against the net international investment position as a percentage of GDP. The lowest
is Germany at over 30% with France, Britain, and the US next with 20-22%. The highest is Portugal
at over 100!
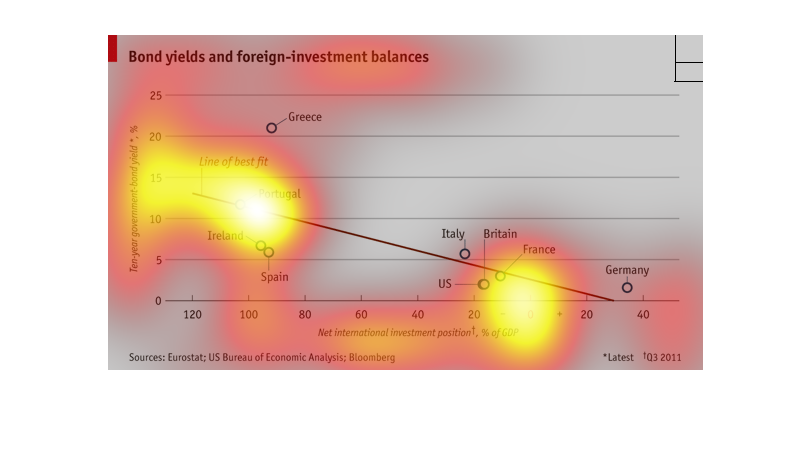
The chart depicts bond yields and foreign investment balances for different nations.  The
image focuses a large deal on Portugal, Ireland, Spain, Italy, Britain, France, as well as
Germany.
The line graph shows bond yield and foreign- investments balance best yield points of several
countries.  The downward slopes indicates a decrease in performance.
This is a line graph showing a trend of  10 year foreign government bond yield to net investment
position of each country. Germany invests the most into other other countries.
This cart shows bond yields and foreign-investment balances over ten year government bond
issues, compared to net international investment position. Portugal falls on the, line of
best fit, line.
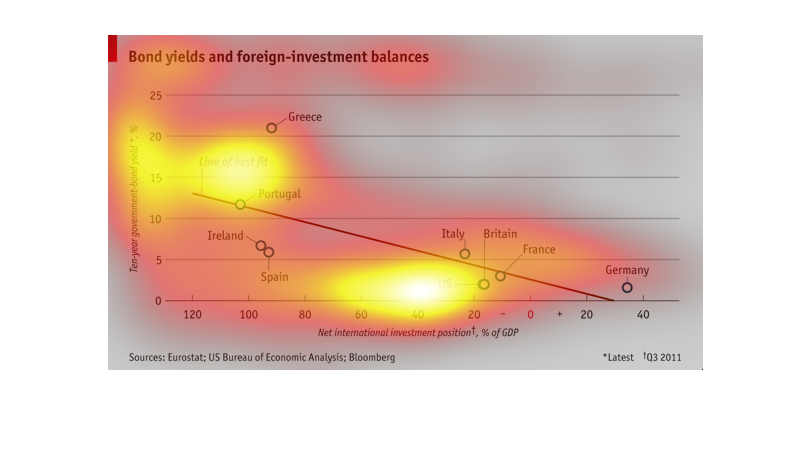
This chart shows bond yields and foreign investment balances. Countries like Portugal, the
US, Great Britain and France are very close to the line of best fit. While Greece seems to
be an outlier as they are extremely far from the line of best fit.
THe chart shows the correlation between bond yields and foreign investment balances. Data
from Greece, Portugal, Ireland, Spain, U.S., Britain, France and Germany is displayed.