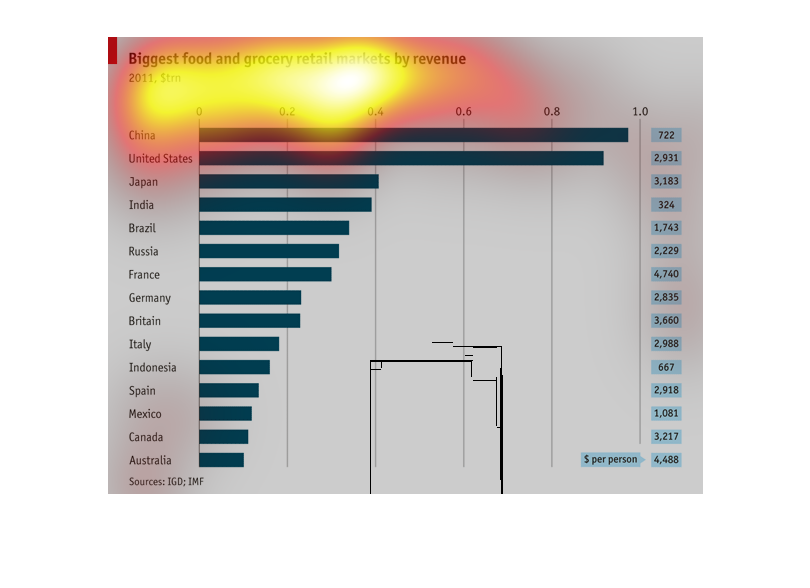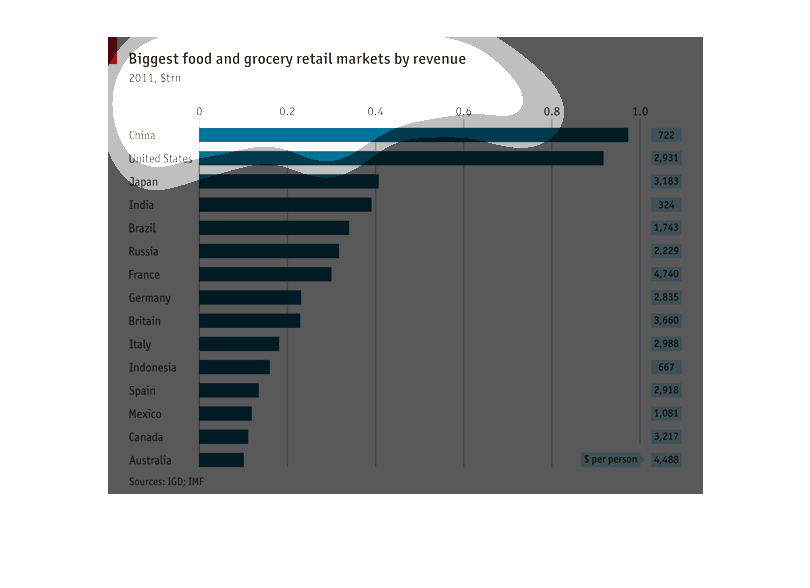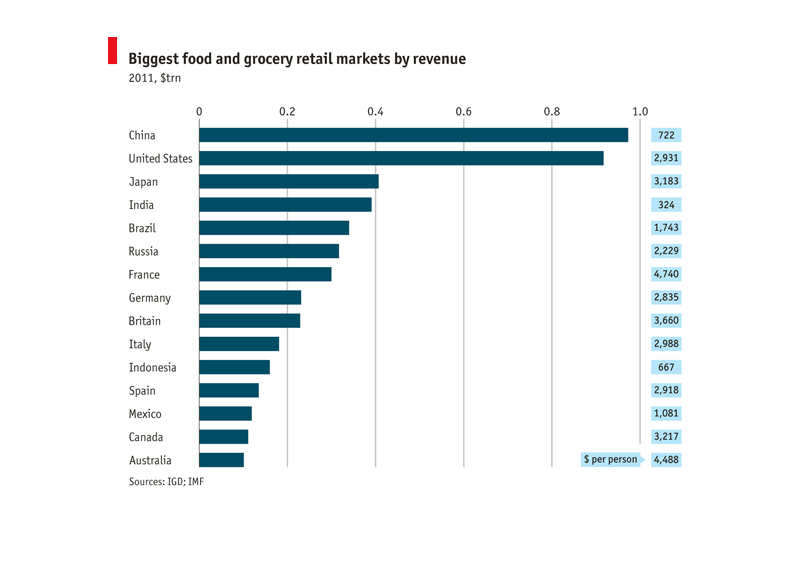
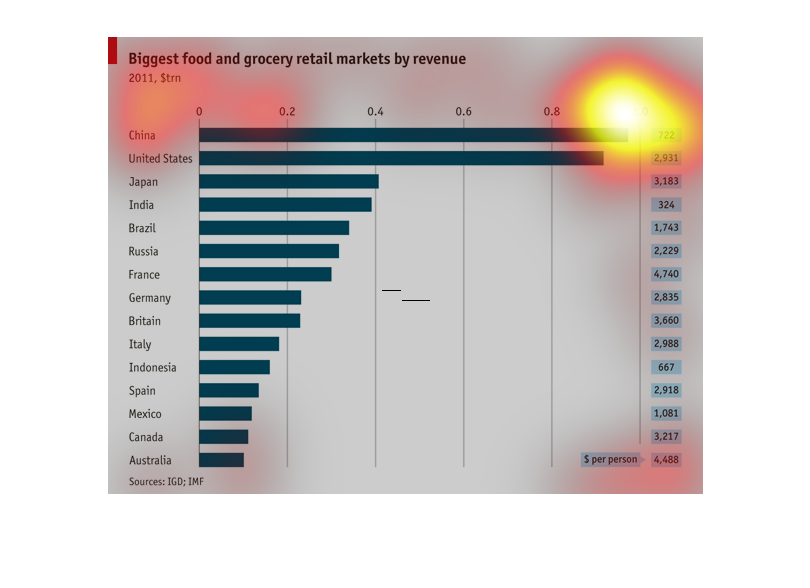
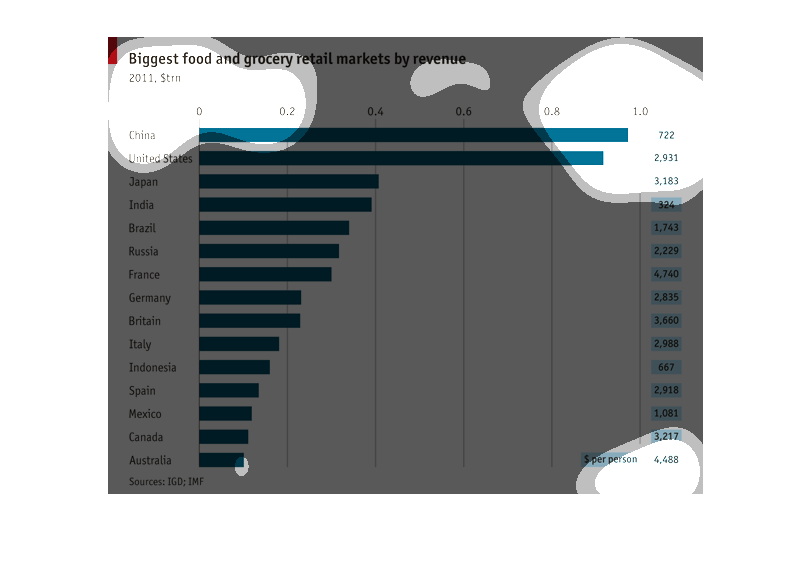
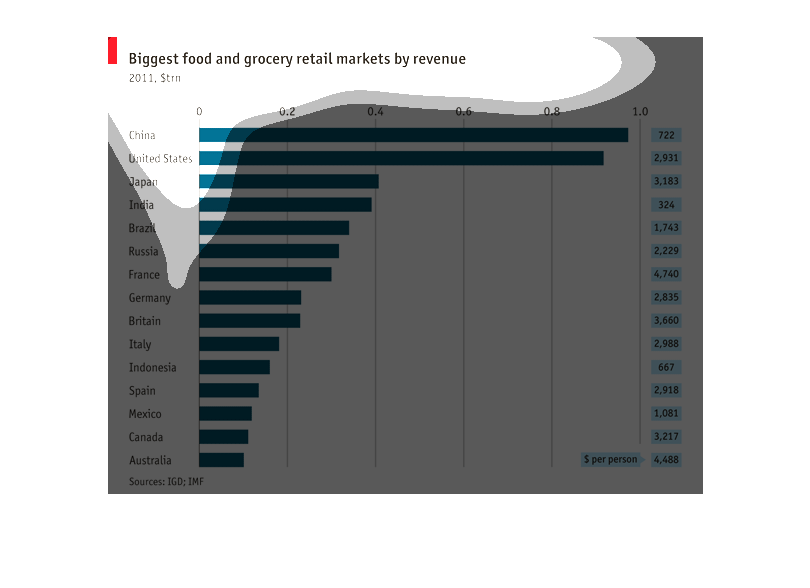
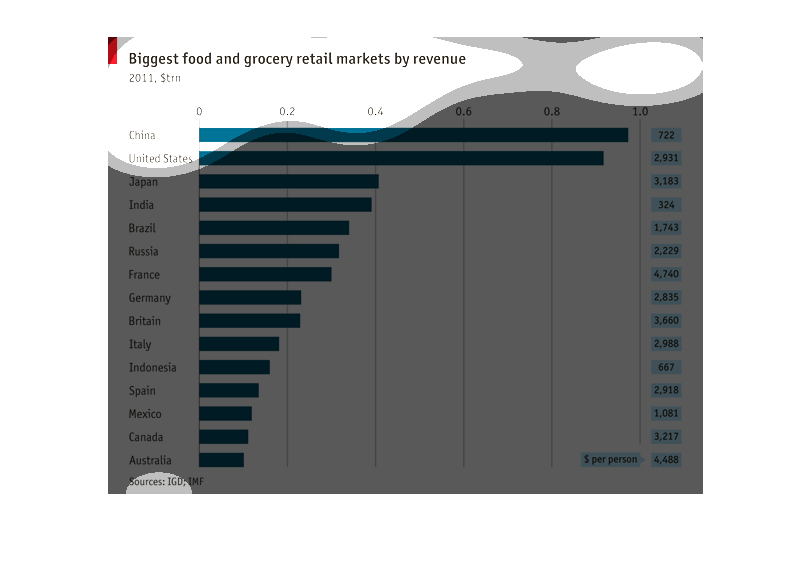
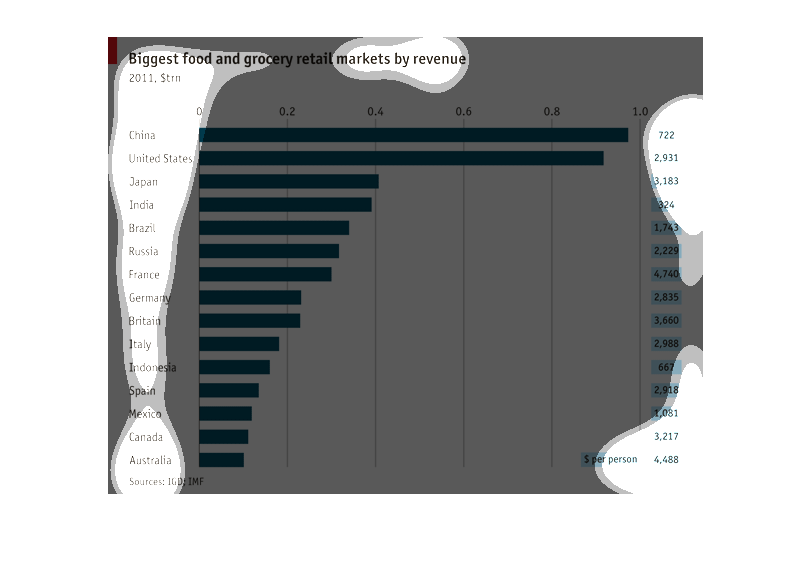
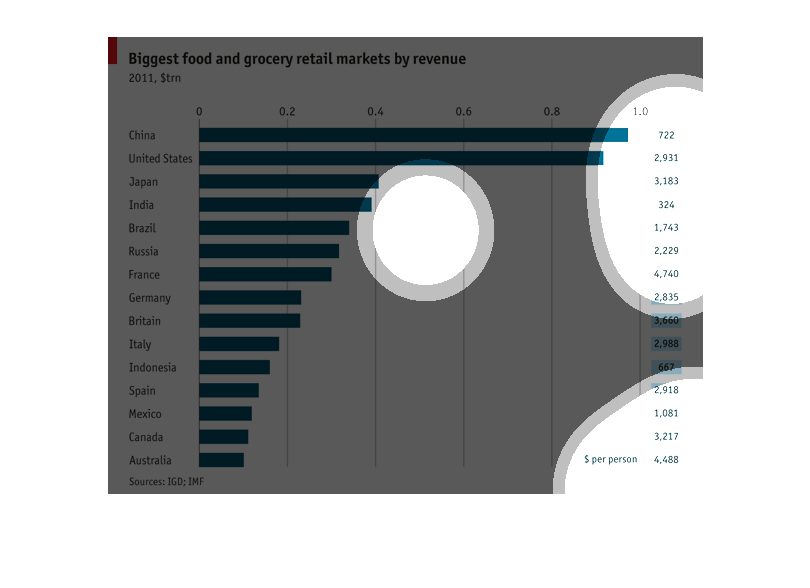
The graph shows the biggest food and grocery retail markets by revenue in 2011. China has
the largest markets at about 1 trillion dollars and 722 dollars per person. The U.S. follows
closely behind with about 0.9 trillion dollars and 2,931 dollars per person. Australia however,
has the smallest amount of money with only 0.1 trillion dollars and a whopping 4,488 dollars
per person.
This chart describes the biggest food and grocery retail markets by revenue. The chart shows
several countries including: USA, Japan, Brazil, India, and Russia.
This chart shows the countries with the largest food retail markets in 2011. The countries
are listed in descending order with China, The US, and Japan taking the top three spots. On
the right hand side, the chart also lists the corresponding amount each person in that country
spends on food in these markets.
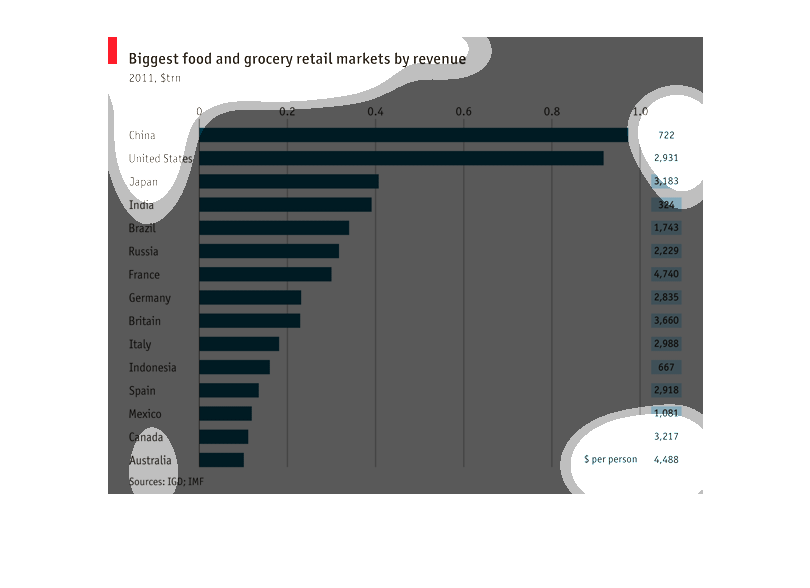
This horizontal bar graph shows the largest food and grocery retail markets among a selection
of countries. While China and United States are the highest  Canada and Australia are the
smallest. The right axis had the numerical value of the graph data.
The graph describes and shows in which countries across the face of the planet,  take in the
biggest amount of revenues by food and grocery retail markets.
tHIS IS A CHART OF THE BIGGEST FOOD AND GROCERY RETAIL MARKETS BY REVENUE.  CHINA IS ON TOP,
FOLLOWED BY THE UNITED STATES.  LAST ON THE LIST IS  AUSTRALIA.
This chart shows the biggest food and retail markets in 2011 in different countries around
the world. The largest market is shown to be China with the smallest being Australia.
This graphic is a bar chart that shows spending on food and other groceries in terms of dollars
by country around the world.  The bar chart is simple with dark blue bars.
This graphic describes how much revenue each country generates for the grocery industry. China
and the US are unsurprisingly at the top of the list. Mexico, Canada, and Australia have the
smallest revenue. The figures on the right indicate the $ per person. Japan and France are
the top of the list in most spent.
This graph shows the biggest food and grocery retail markets. It is organized by country starting
at the top would be the most revenue heading toward the bottom the least amount of revenue.
The chart is another horizontal bar chart.  The values of the axes are obscured as is the
title.  the values of the various bars are also given in numeric form on the right hand side.
The chart depicts the biggest food and grocery markets in the world by revenue in 2011. China
had the biggest share of the market followed by the United States. While Canada and Australia
were at the end of the chart.
This graph depicts the largest grocery and food markets, designated by revenue. The bars indicating
the scale are wide and deep blue. the highest scoring markets, China and the U.S, respectively,
reach almost to the far side of the grid. The rest  of the markets taper down in a markedly
gradual manner, so that the rest of the graph resembles a perfect funnel.
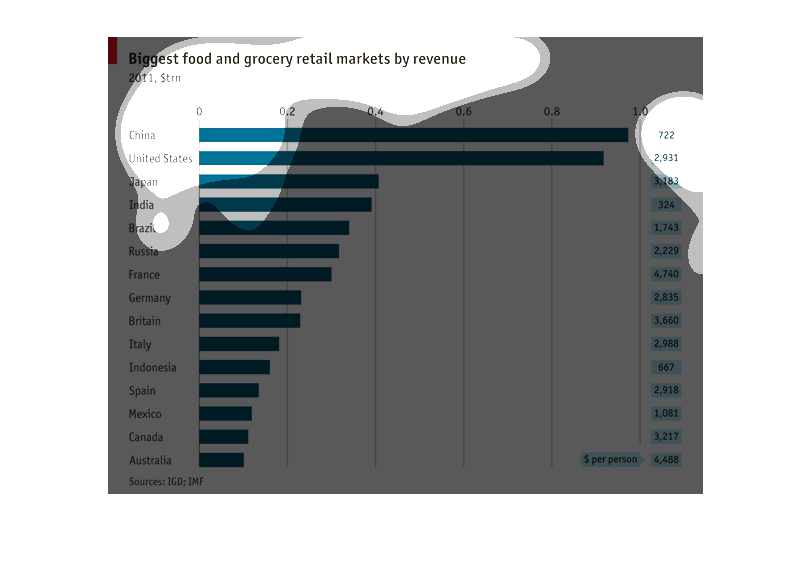
This graph represents the biggest food and grocery markets by revenue (2011).  On the left
were countries.  On the right was a bar representing a number from 0 to 1.  There was a number
representing the dollars per person.  This number did not necessary correlate to the bar.
This image is a comparison of the biggest  food and grocery retail revenue based on the revenue
of the people in different countries around the globe in the year 2011.