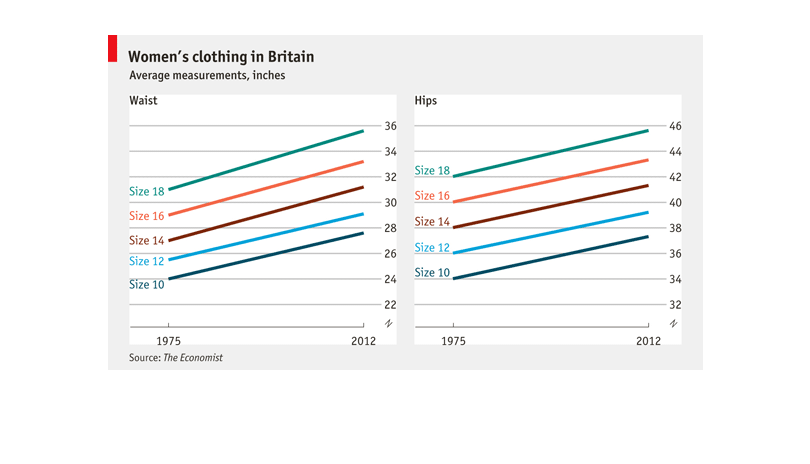
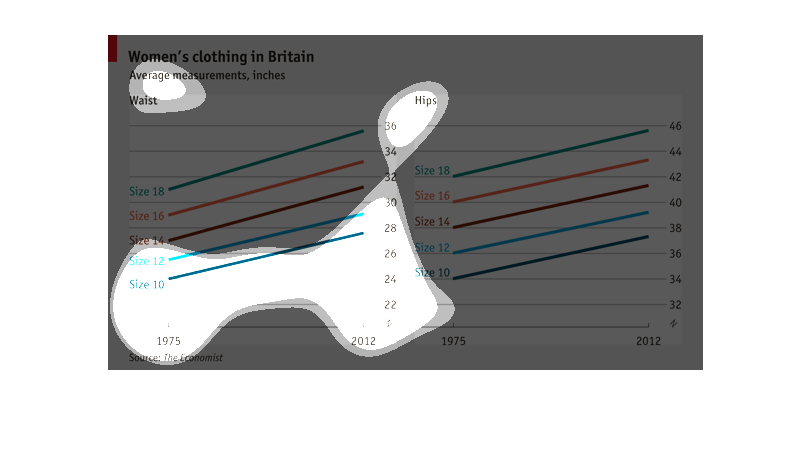
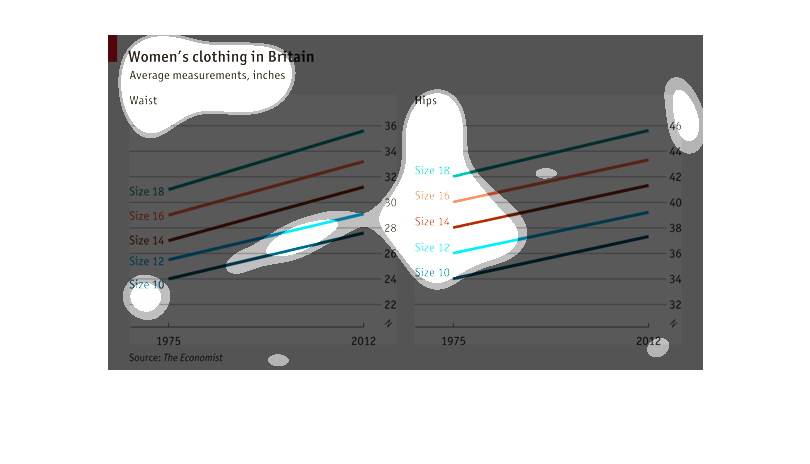
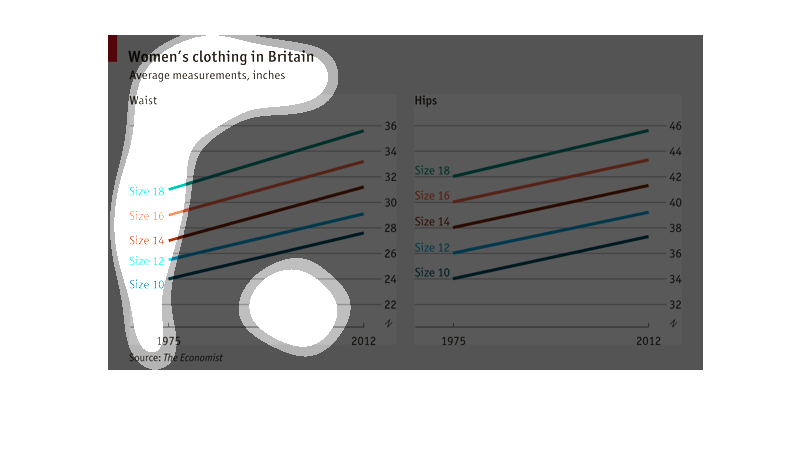
This graphs shows the average measures of women's clothing in Britain based on the size of
the women's hips and waist.   It depicts the years from 1975 to 2012 and seems to only worry
about sized that are between 10 and 20. It was compiled by the economist magazine.


This graph displays women's clothing in Britain, with the average measurement in inches. It
shows the waist size and hip size starting in 1975 to 2012.

This is a graph of the average measurement of women's clothing in Britain. The measurement
is based in inches and charts both waist and hip sizes between the years 1975 and 2012
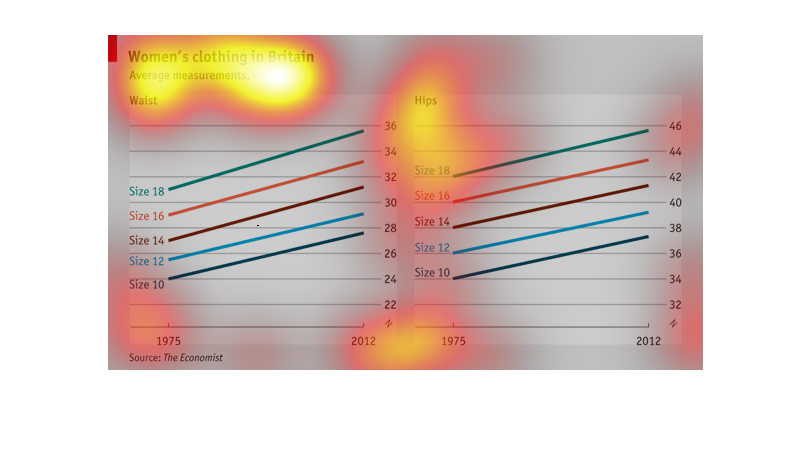
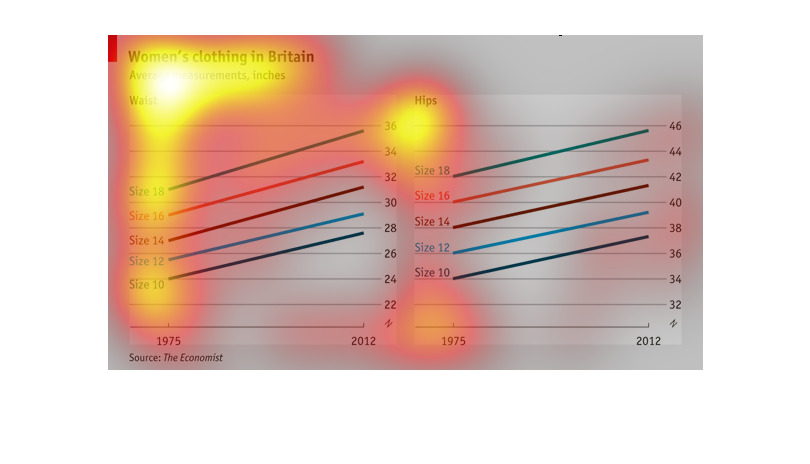
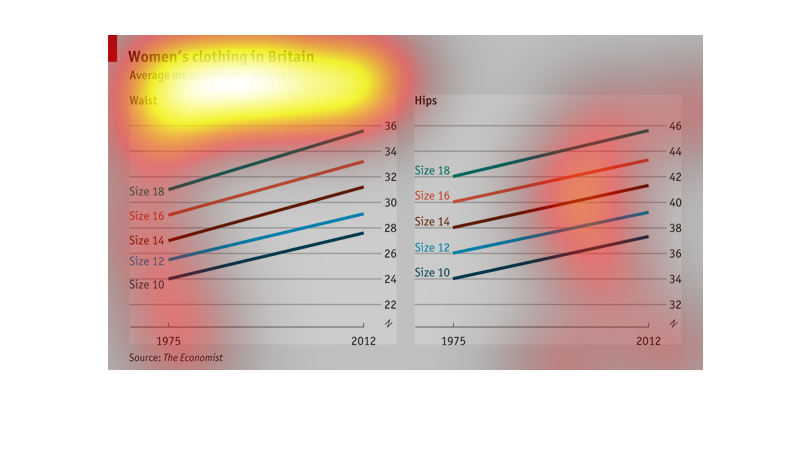
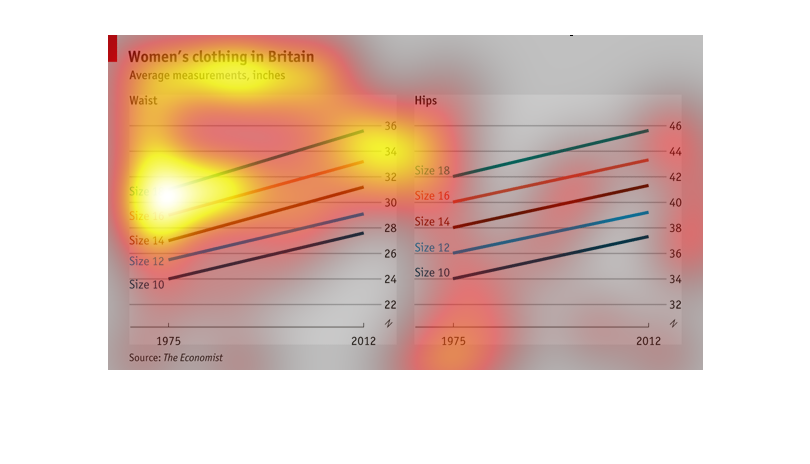
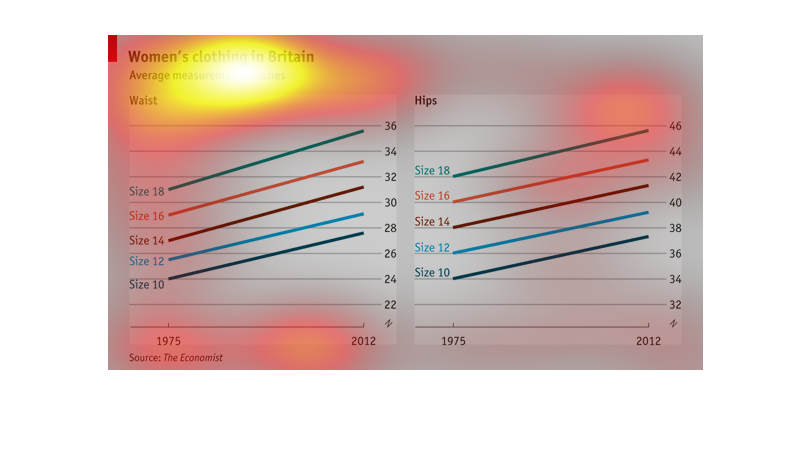
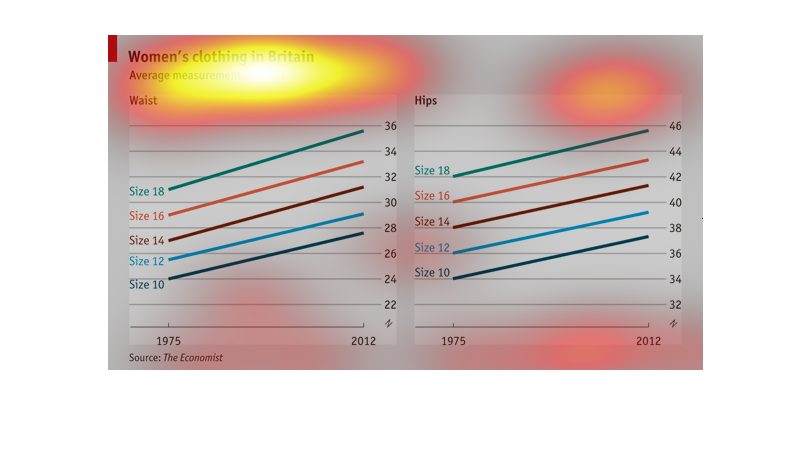
These two graphs shows trends in women's clothing sizes in Britain from 1970 to 2012. One
graph shows waist measurements while the other shows hip measurements. Overall, there seems
to be an increasing, linear trend in all sizes (10 to 18 inches for both hips and waist).


The first graph displays data indicative of waist measurements for British women's clothing
sizes being increased for the time period of 1975 to 2012. For example, the waist measurement
for a size 10 in 1975 was 24" and in 2012 a size 10 is just shy of 28".  The second graph
covers the same time period but for hip measurements.  Using a size 10 for the example again,
in 1975, the hip measurement for a size 10 was 34" and in 2012 it is approximately 37".
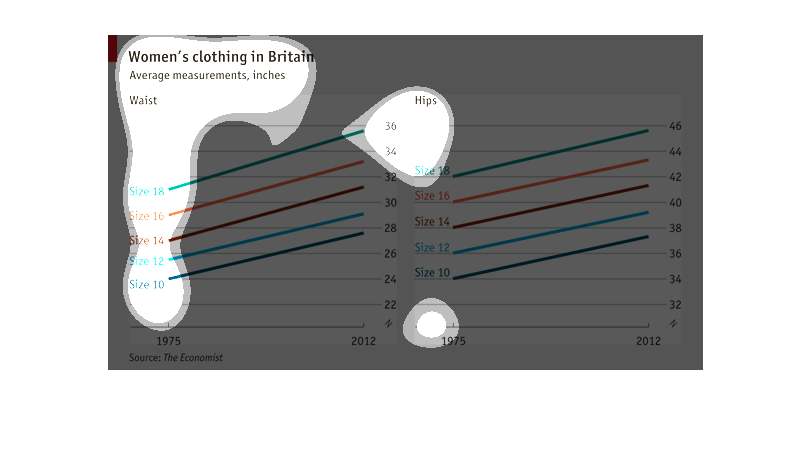
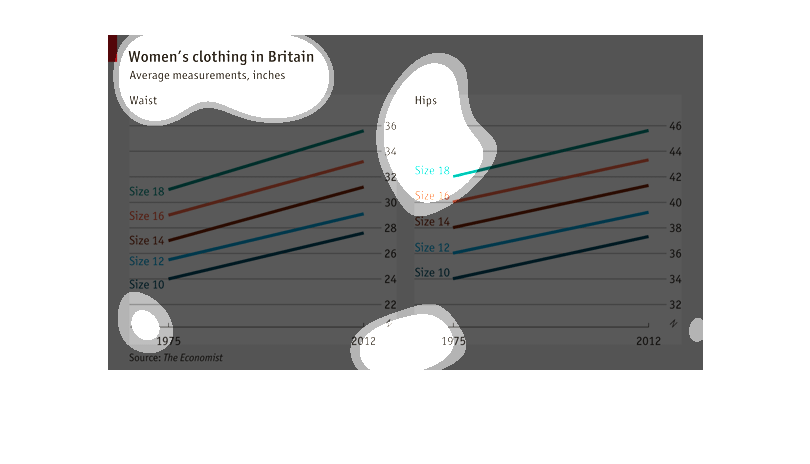
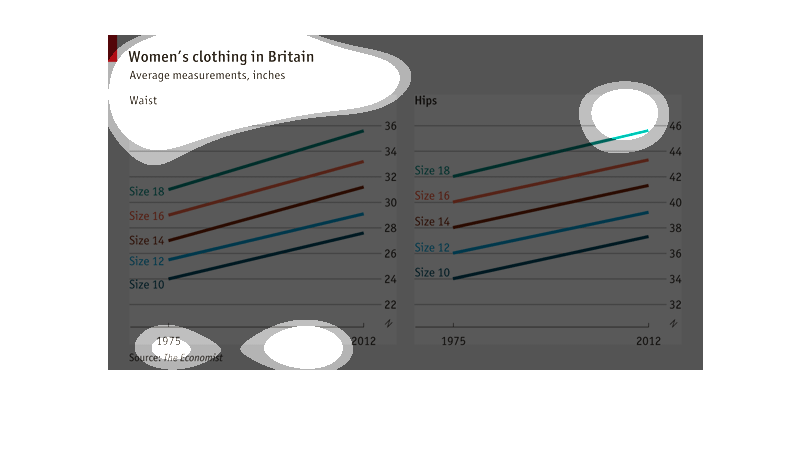
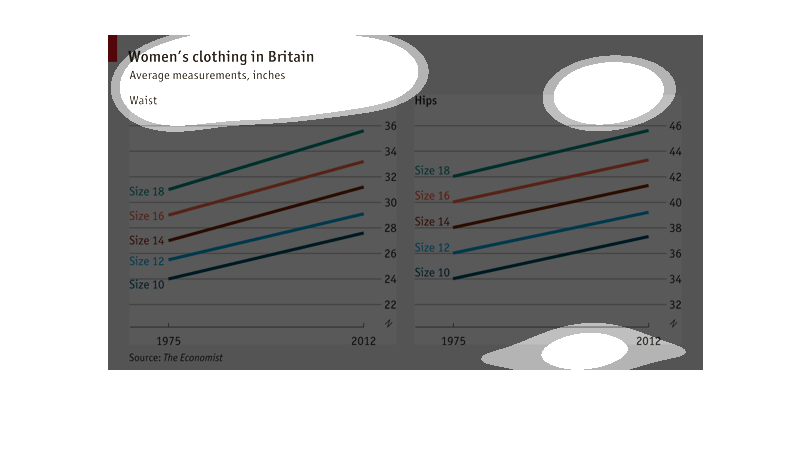
This image shows two graphs comparing the average women's clothing in Britain in inches. It
separates measurements into two, waist and hips and provides numeric values for each.
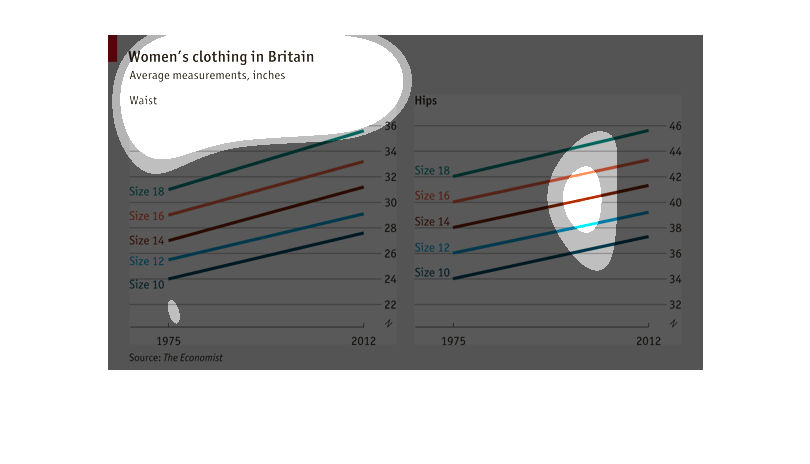
This chart shows the average measurements in inches for the waist and hips of women's clothing
in Britain from the years 1975 to 2012. The sizes on both charts show a dramatic increase
over the decades.
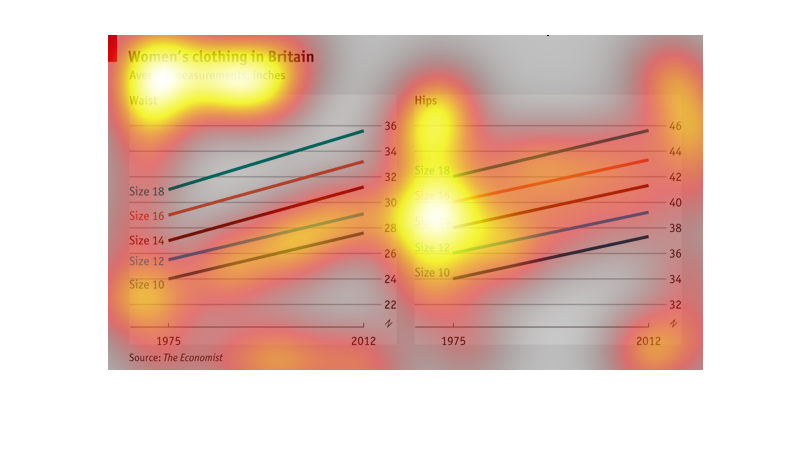
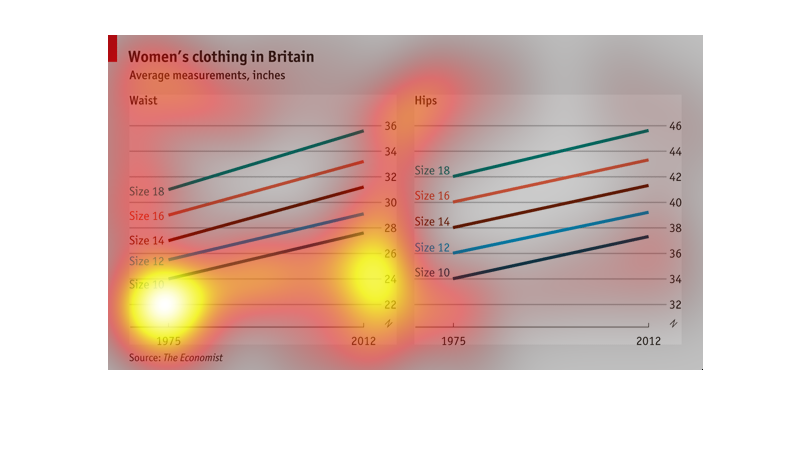
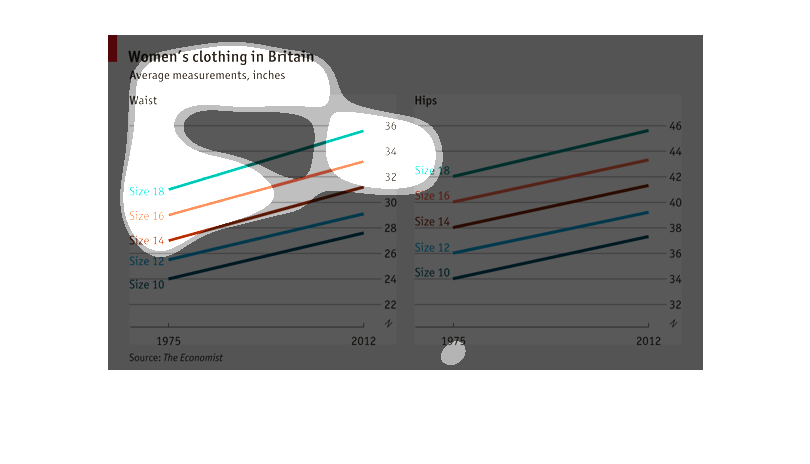
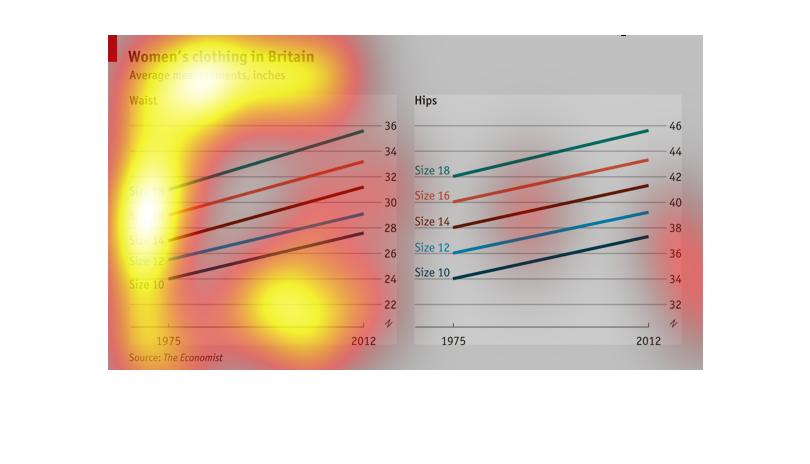
This chart represents the changes of women's clothing sizes in Britain. Both waist and hip
measurements have increased from 1975 until 2012. For example, the waists of size 18 clothing
was about 21 inches in 1975, but in 2012 they had ballooned to almost 36 inches.
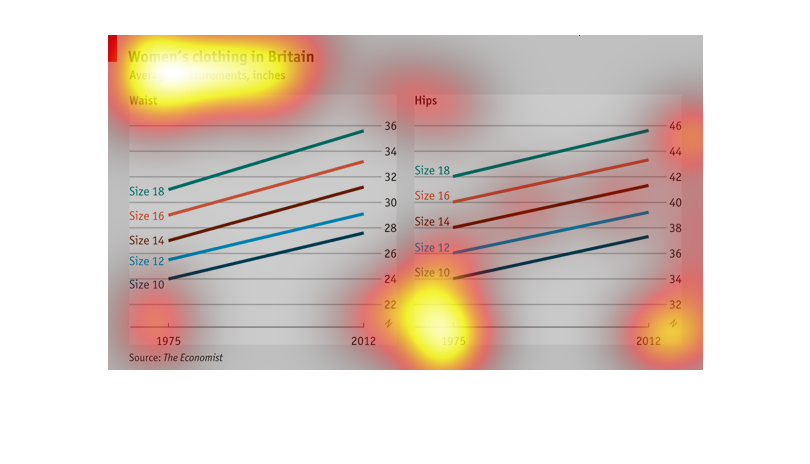
This graph shows the average size of women in Great Britain measured in inches. The graph
ranges from 1975-2012 and it measures the waist and hips of women.
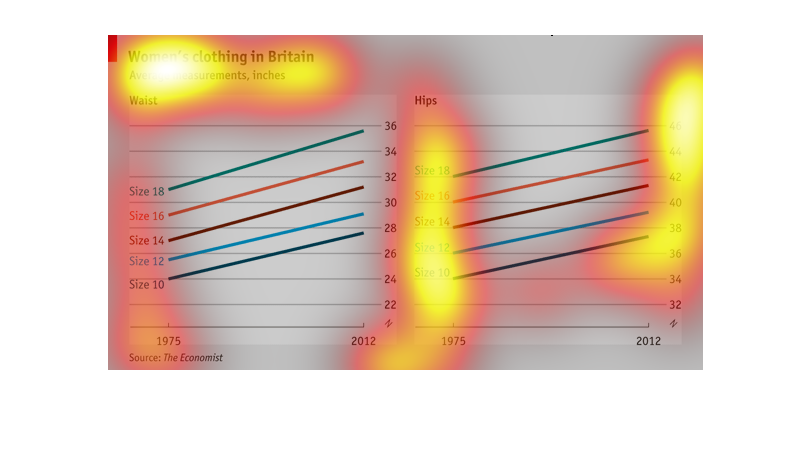
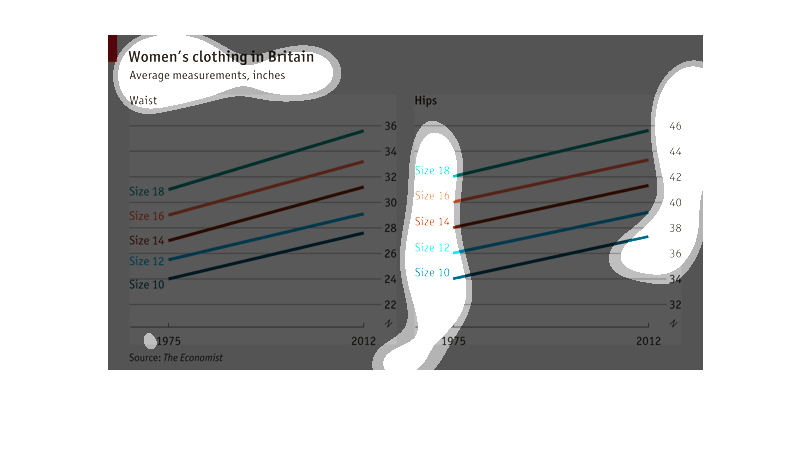
Chart describes the clothing measurement sizes of British woman based in different time periods
and shows over the years that they have increased in sizes.
This graph shows the average measurements of women's clothes in the UK. Most of the women
represented have various ages but the graph overall has a consistent linear slope, leading
to the conclusion that the size will increase as women age.
The graph is showing the change in average womens' measurements over a period of time in England.
 The graph shows a steadily increasing average size of both the waist and hips of women in
England sinec 1975
This chart shows how Women's clothing in Britain and how size has changed over time with respect
to the actual inches of the clothing.  Overtime the size to inch comparison has steadily risen.