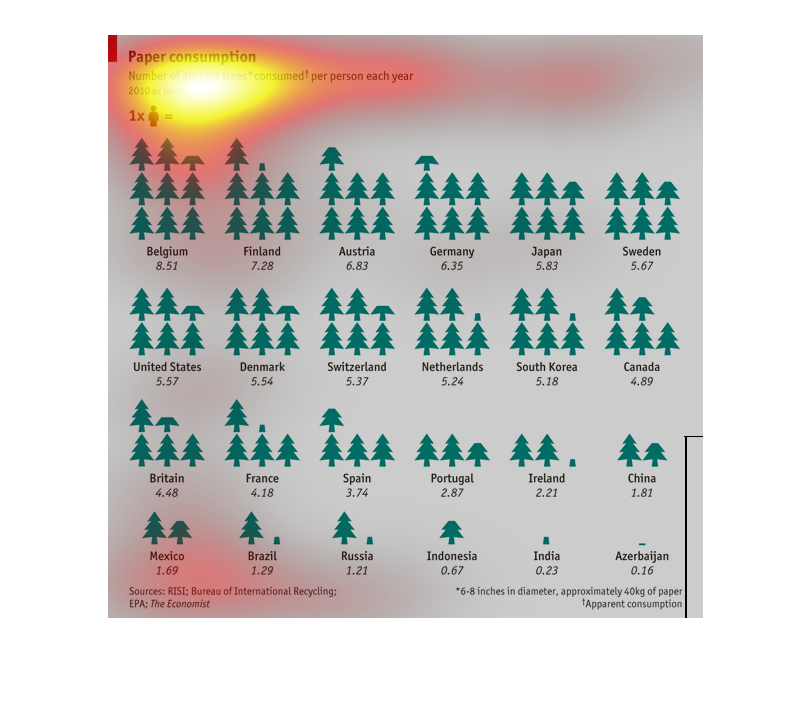
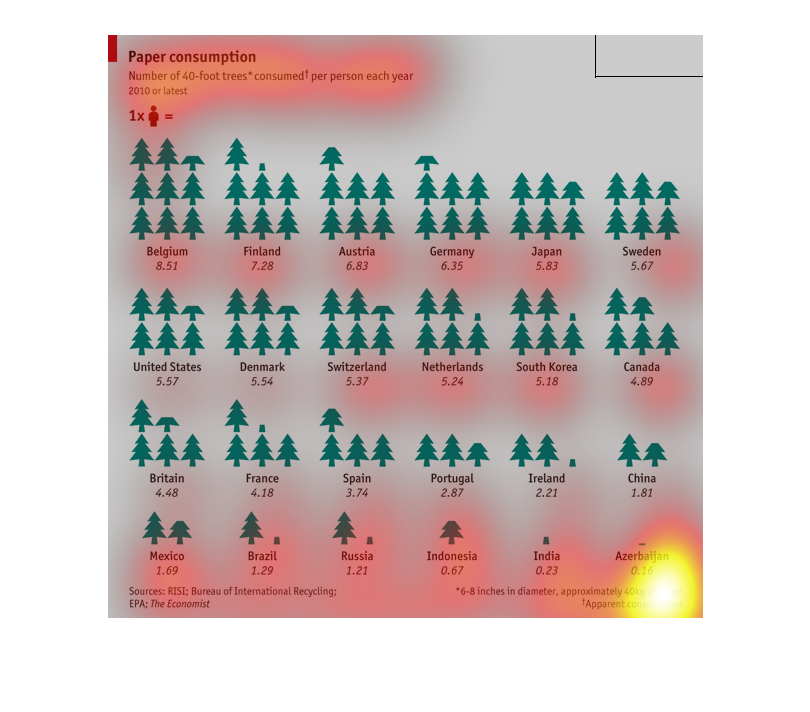
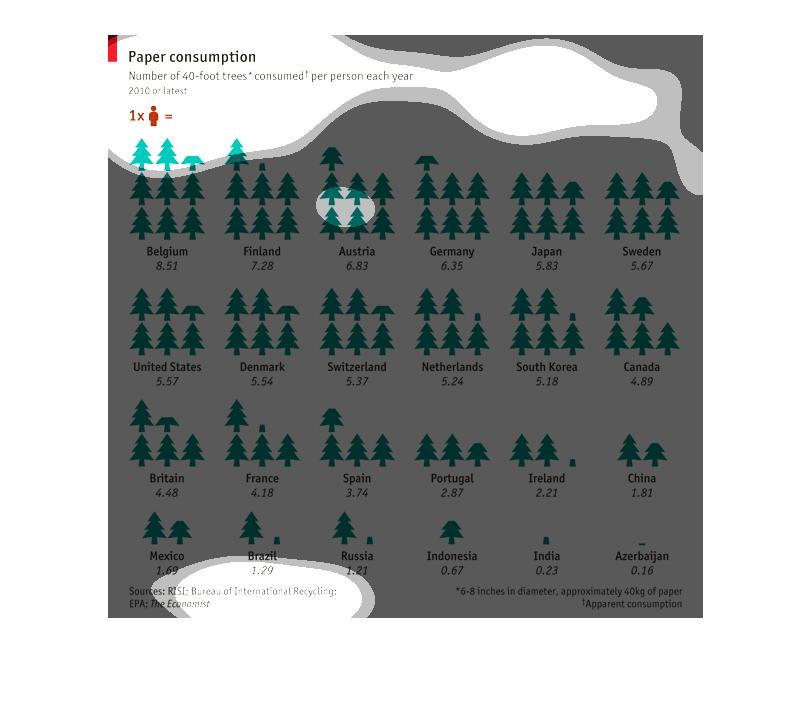
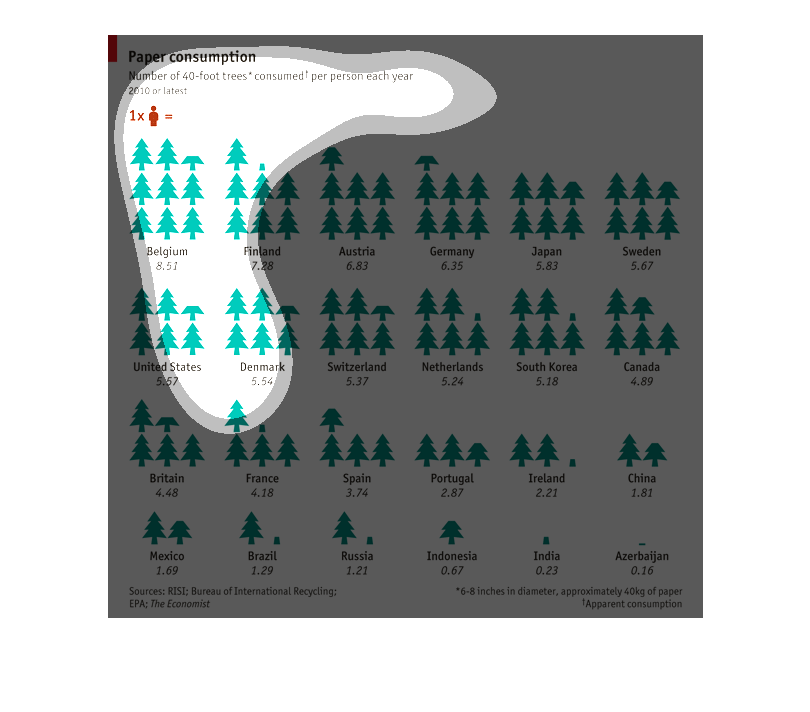
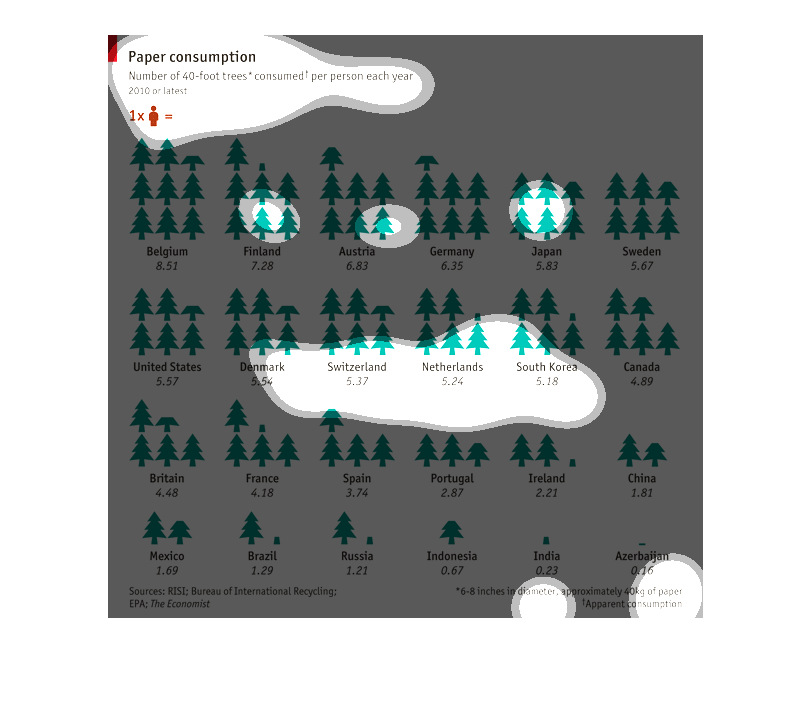
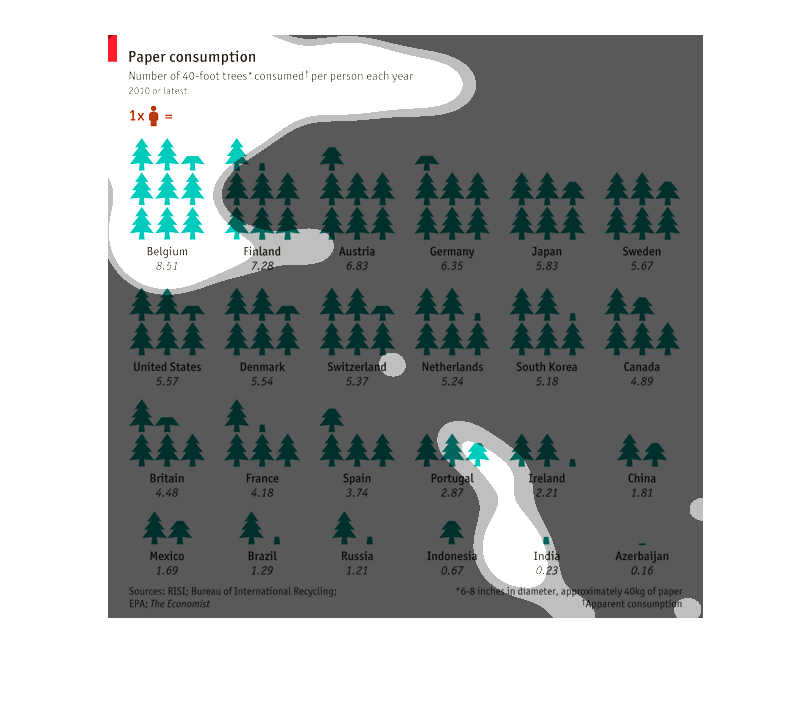
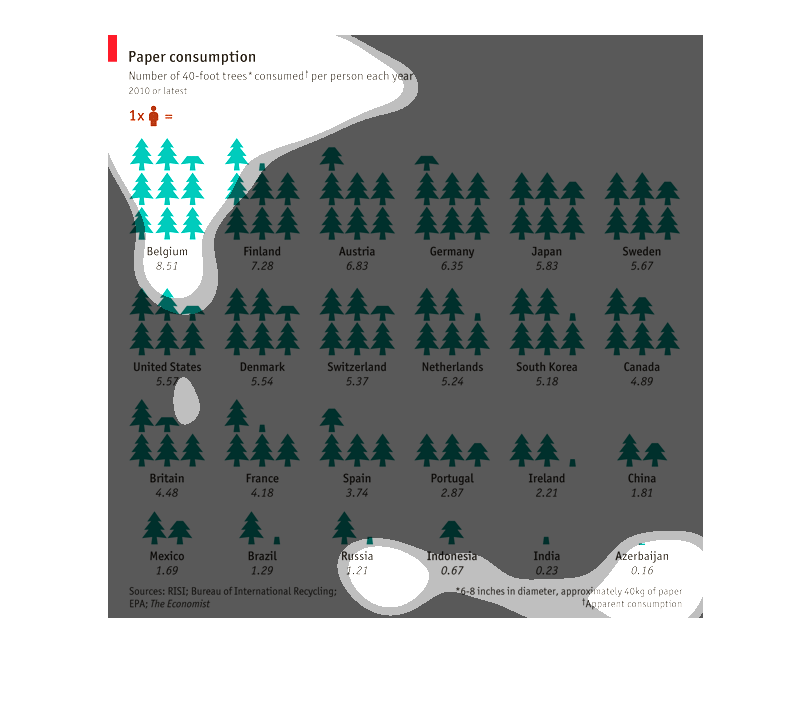
Amount of paper consumption from 40 ft trees by each person each year starting from the year
2010 and later. Belgium ranks first with 8.51, Finland follows second with 7.28, and Austria
ranks third with 6.83. The United States is ranked 7th with 5.57. Azerbaijan is ranked last
with 0.16.

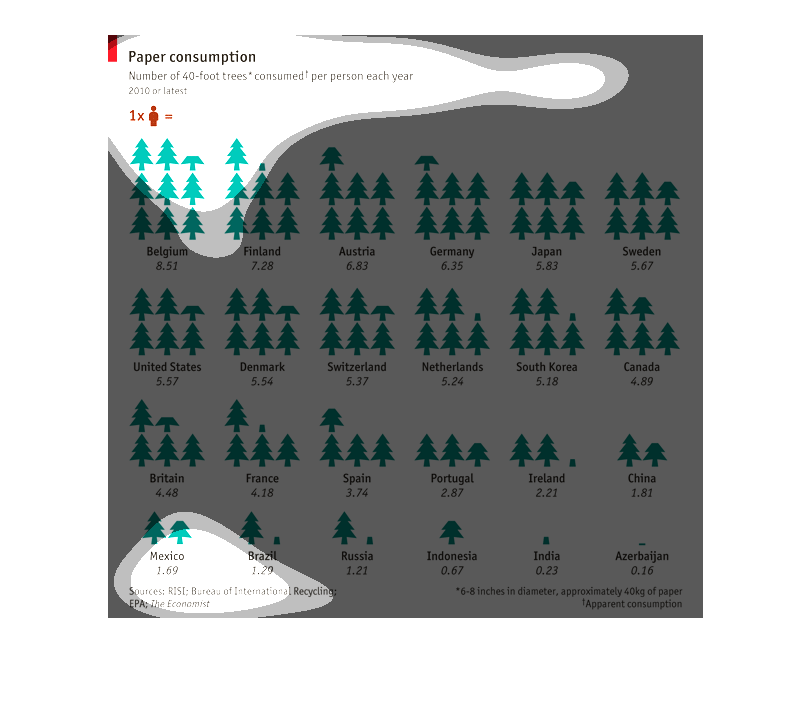
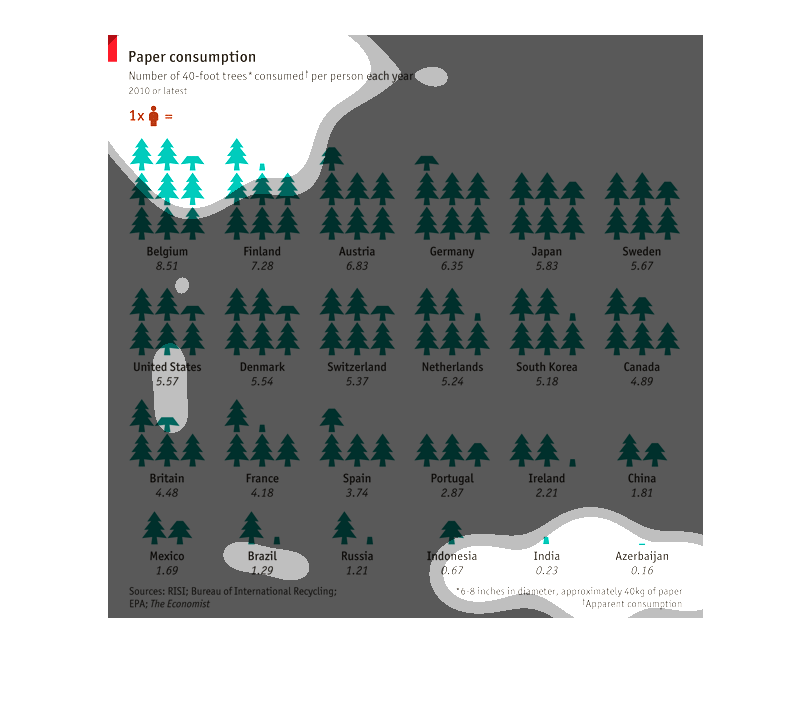
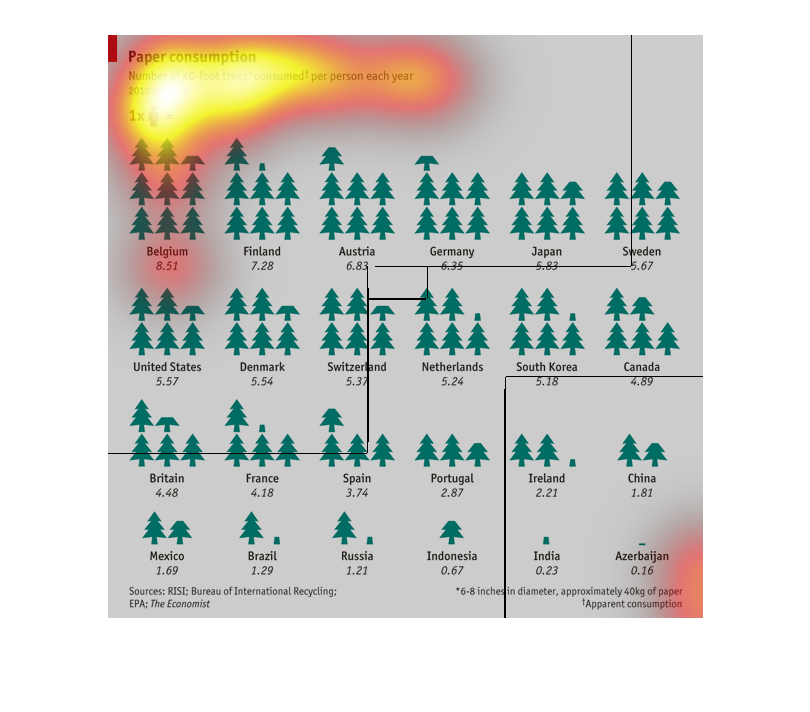
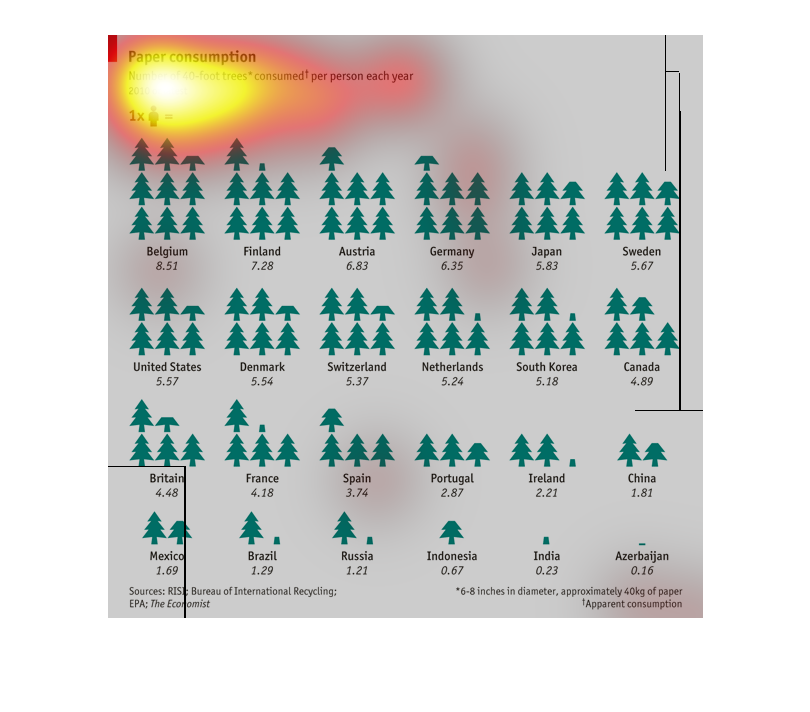
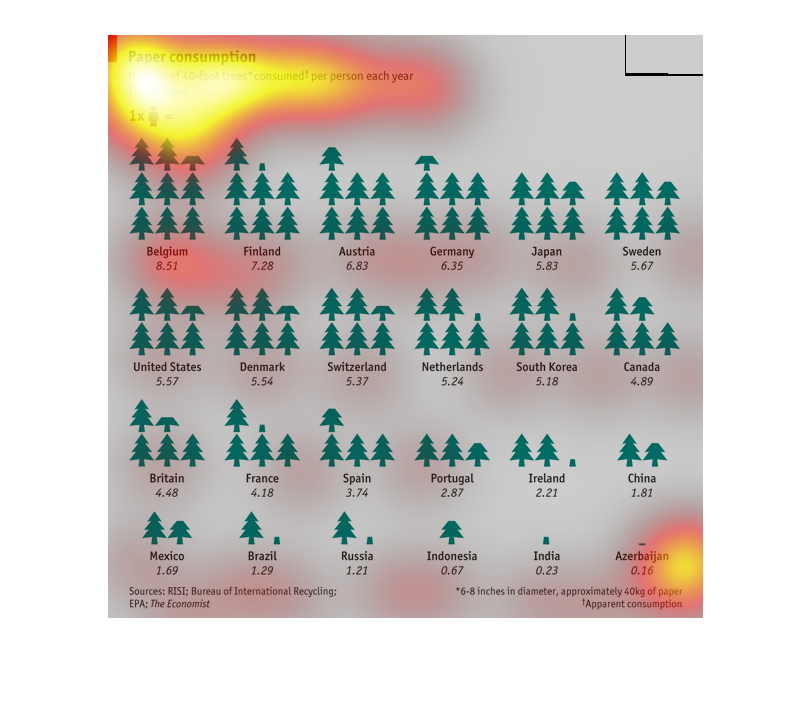
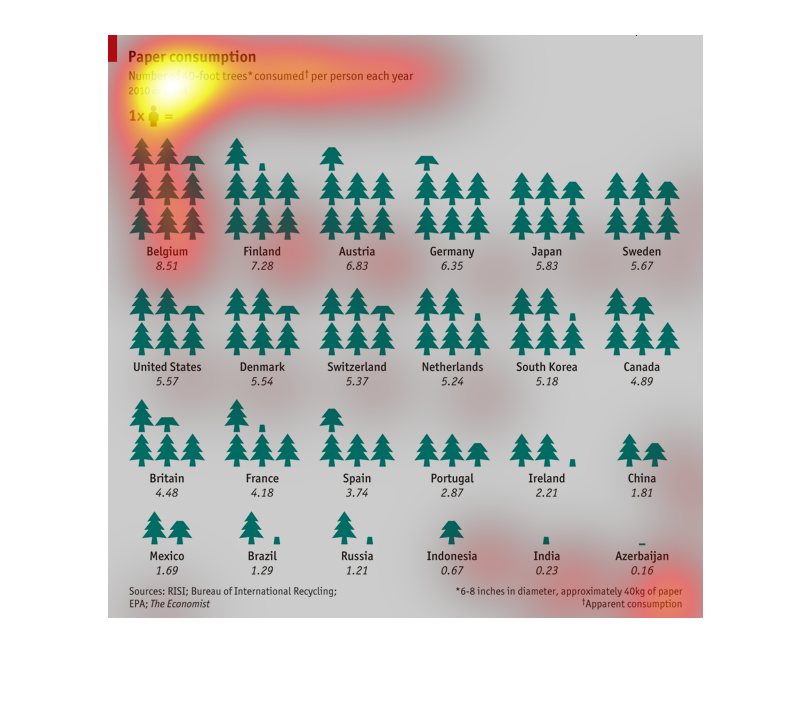
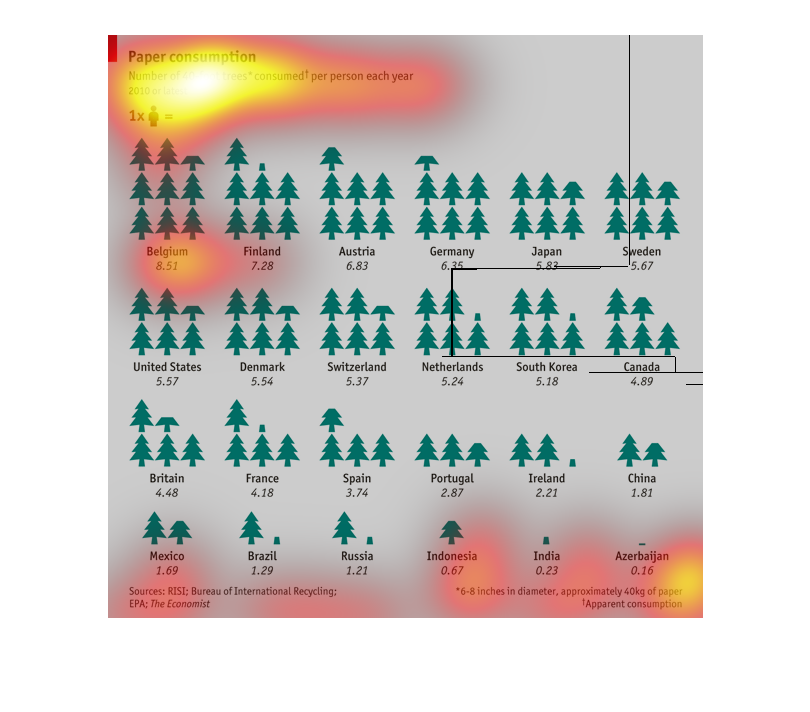
This chart describes the number of trees that are used per person each year. It has it listed
by country, with Belgium being the worst at 8.51 trees per person and Azerbaijan being the
best at .16 trees per person. The average seems to be around 5 trees per person for the whole
of the chart.

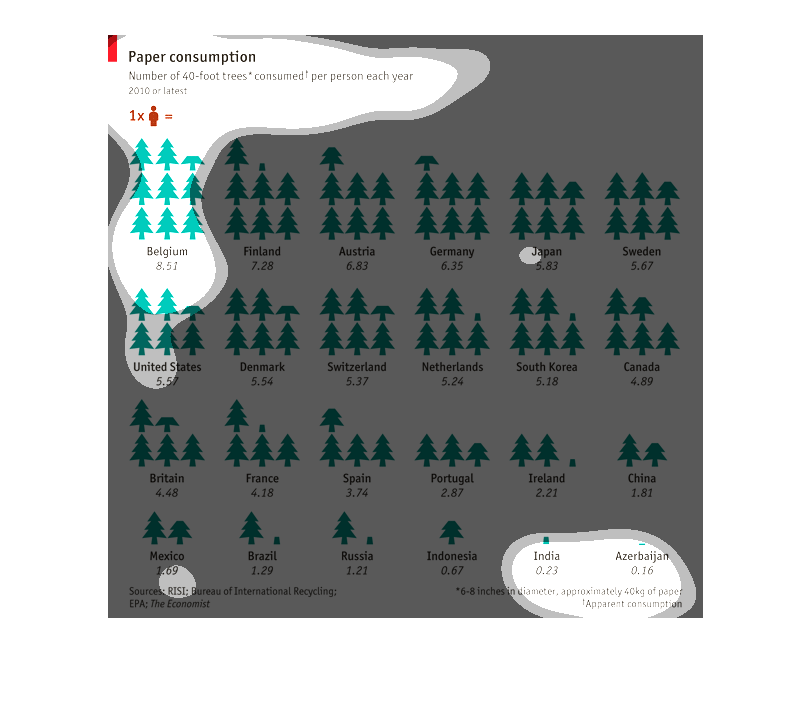
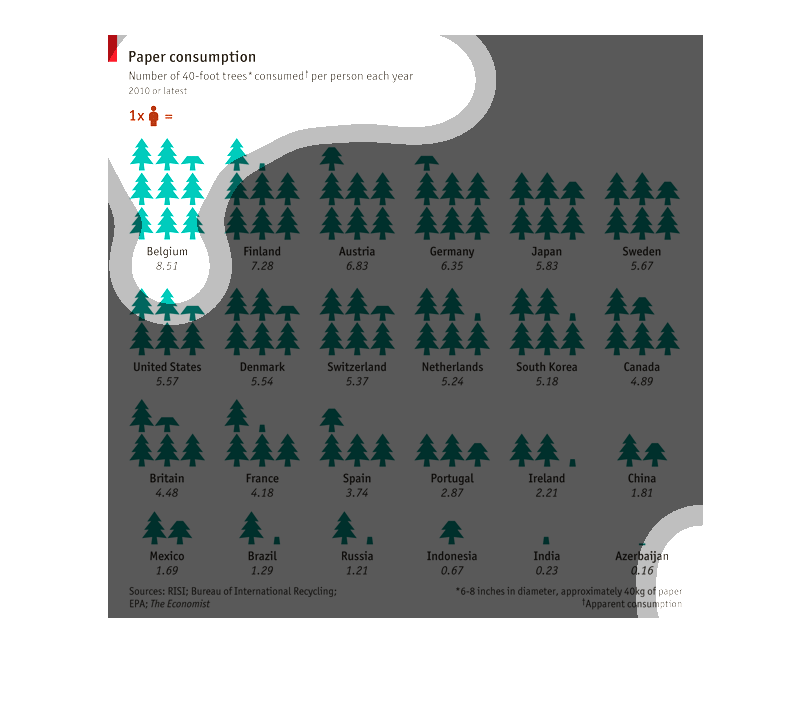
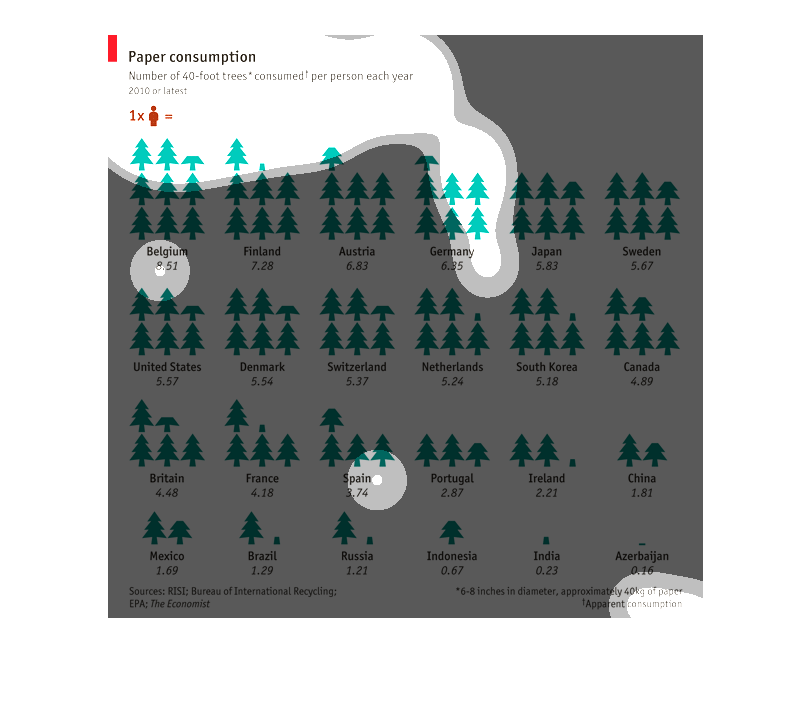
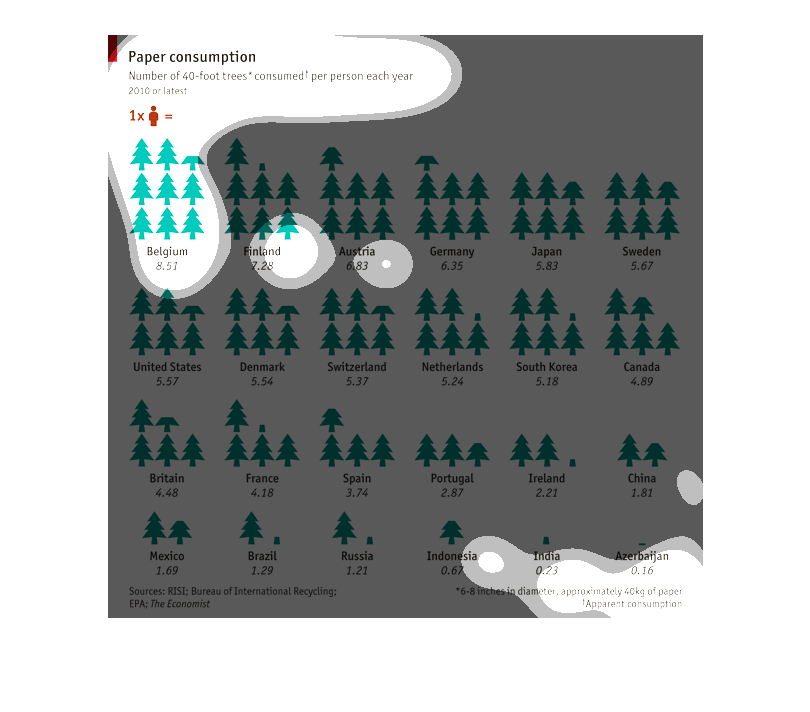
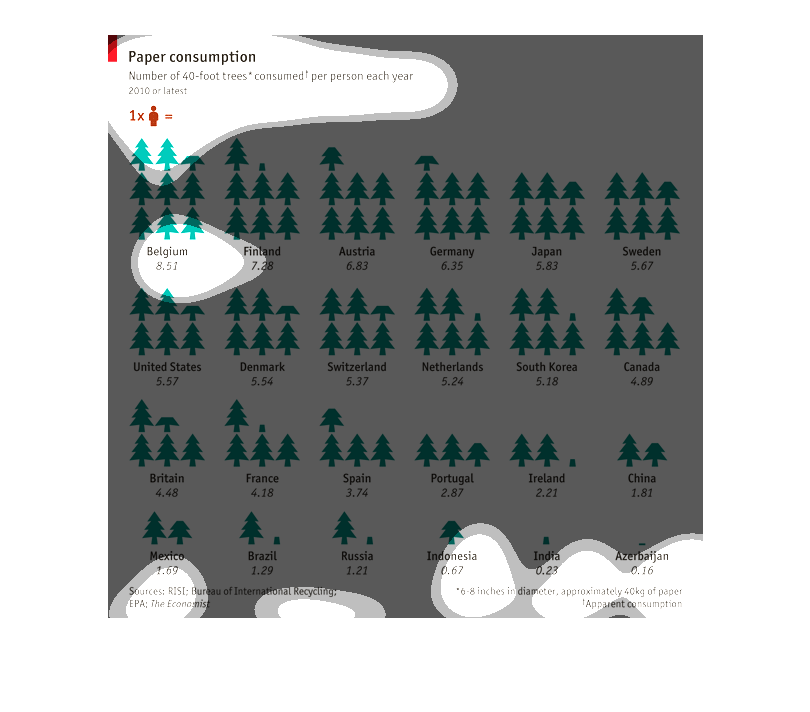
The graph is paper consumption in terms of trees per unit in different countries. Belgium
having the highest paper consumption and Azerbaijan having the least paper consumption.

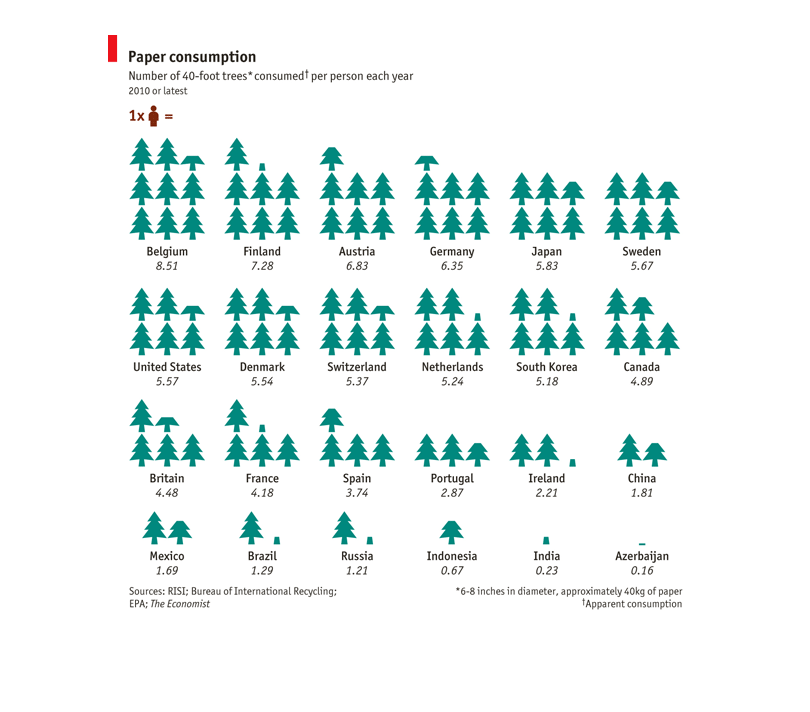
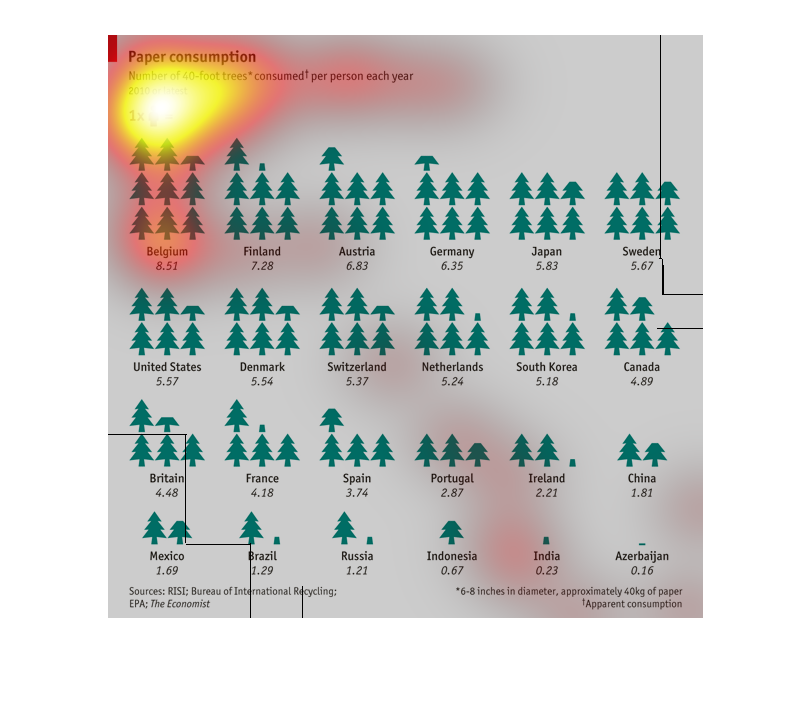
Paper Consumption graph showing how many 40 ft trees are used per person each year in 2010
it breaks down how many trees are used per person in specific countries. Belgium leading in
paper consumption where the USA is somewhere in the middle not doing too bad.

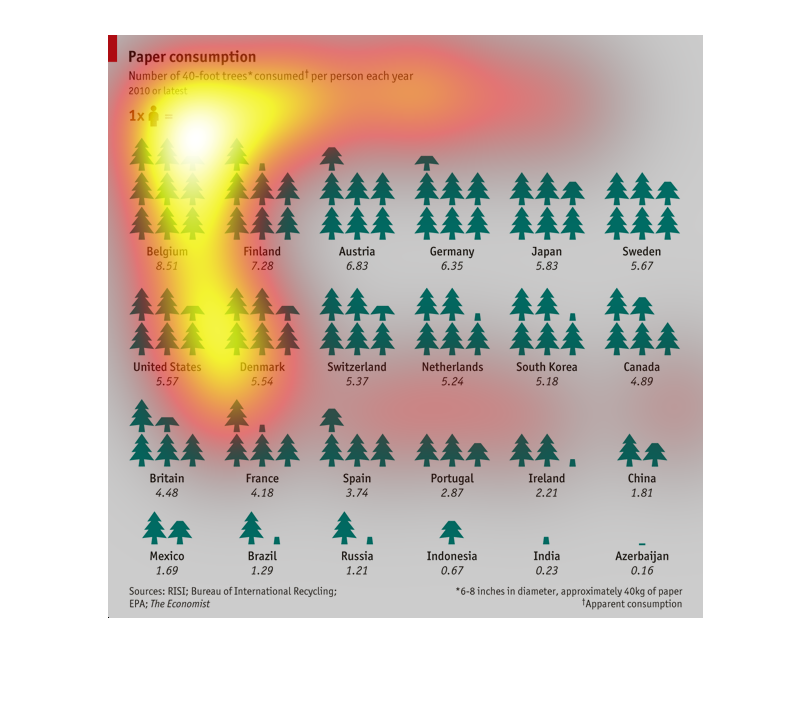
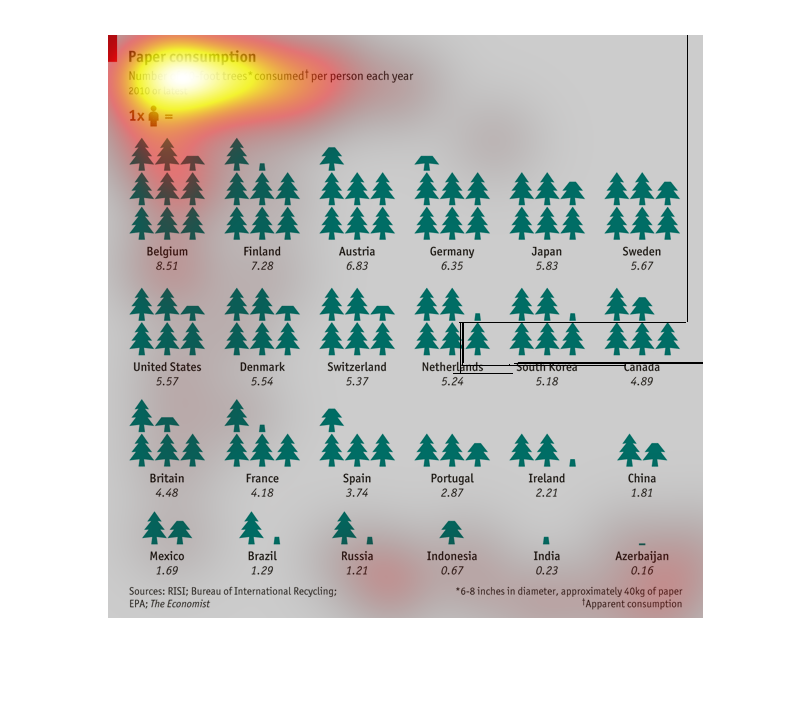
THIS IS A CHART OF PAPER CONSUMPTION .  IT SHOWS THE NUMBER OF 40 FOOT TREES CONSUMED PER
PERSON EACH YEAR.  IT IS BASED ON DATA FROM 2010.  THE SOURCE OF THE CHART IF THE BUREAU OF
INTERNATIONAL RECYCLING.
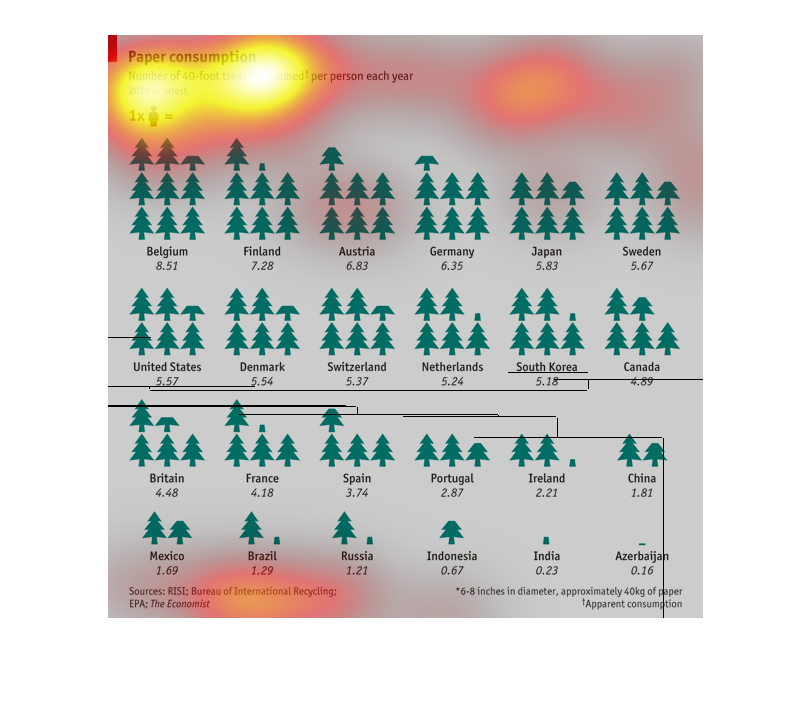
This chart shows the amont of paper consumed by various countries.  Each graphic shows the
number of 40 foot trees consumed by each person in that country each year.  Belgium consumes
the most and Azerbijan the least.
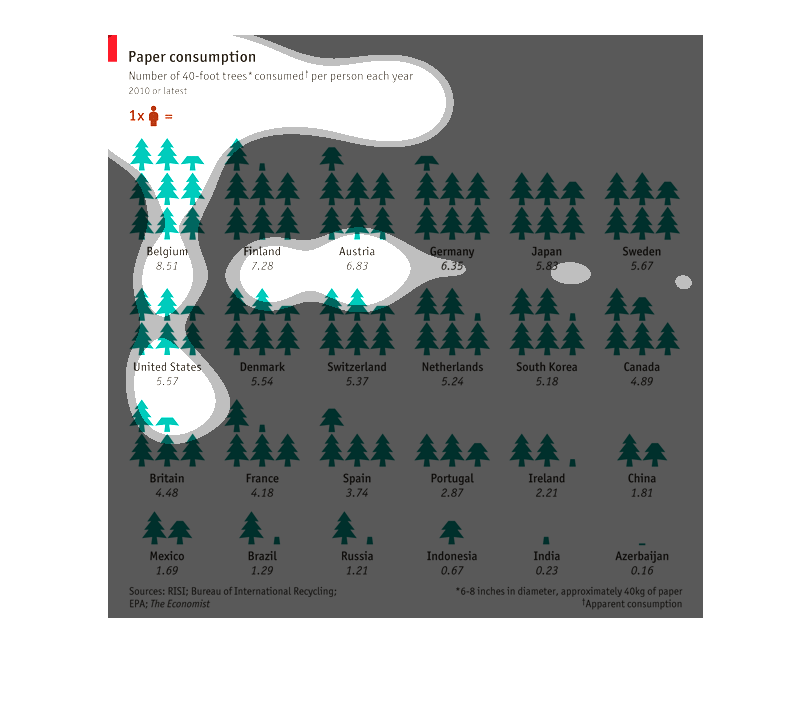
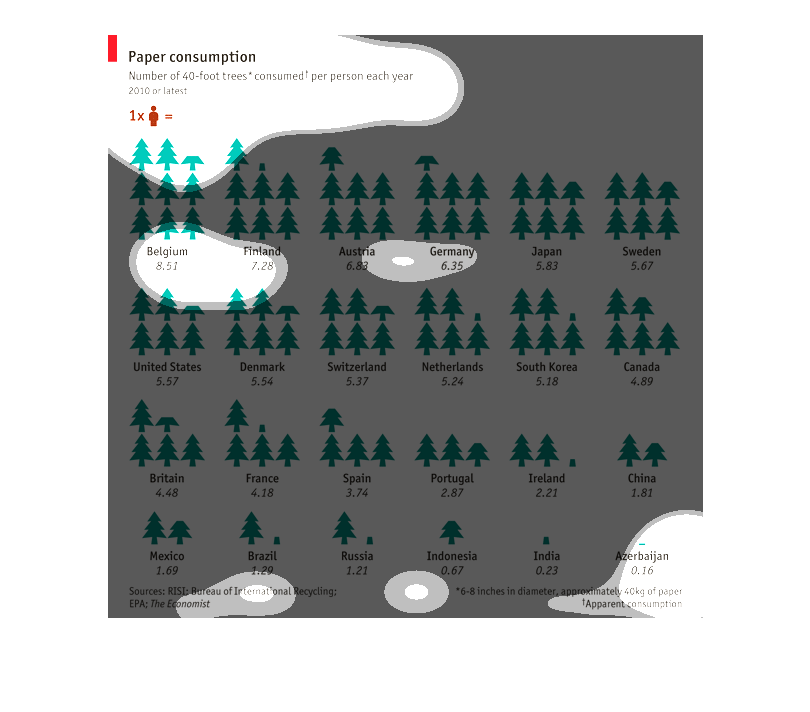
Paper consumption per person each year for 40-60 foot trees. Belgium consumes the most while
Finland leads a strong second. Austria comes in third while Germany comes in at fourth.
This graph shows paper consumption of countries by using trees to represent number of 40-foot
trees consumed per person each year. Azerbaijan has the least paper consumption at .16 trees
per person and, surprisingly, Belgium has the largest number of trees per person consumed
at 8.51 a person.
This is a graph showing paper consumption showing the number of 40 foot trees consumed each
year. The graph is depicted showing trees and the amount used for certain areas of the globe.
This graph shows paper consumption based on how many 40' trees are used for paper per person
per year.  It shows that Belgium uses the most paper- 8.51 trees per person per year, and
Azerbaijan uses the least- 0.16 trees per person per year.
This graph shows the relationship of paper consumption per person in various counties around
the world and how this relates to the number of tress used to create paper per person each
year.
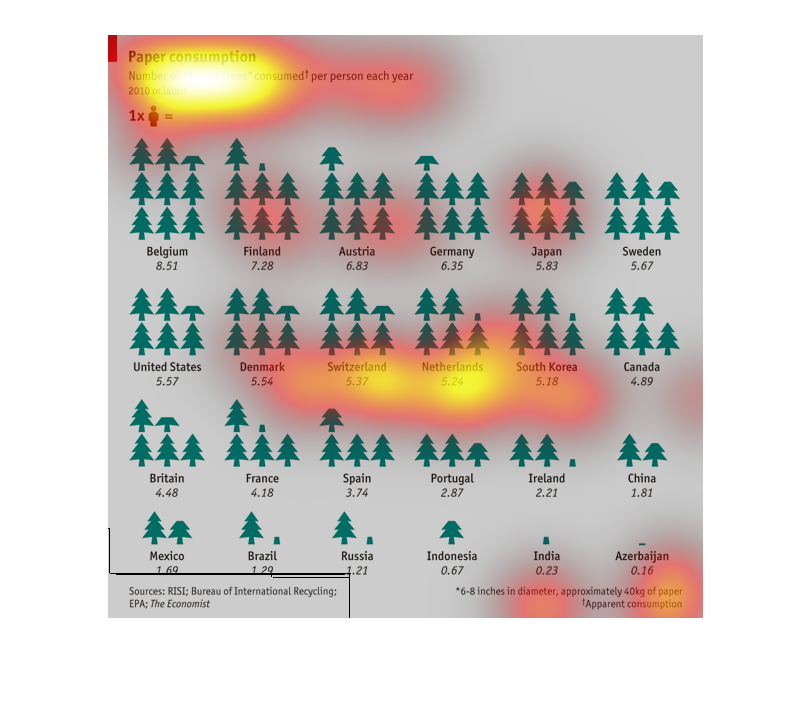
This chart describes the  number of 40 foot trees consumed per person each year to make paper.
 The chart reveals consumption for many countries. The highest consumption is in Belgium at
8.51. The lowest is in Azxerbaijan at 0.15.
This chart compares the varying amounts of paper consumption by country a single person uses
annually in relation to how many  40' trees it took to make that paper. This data is from
2010.
This chart depicts paper consumption by country.  It is organized by how many 40-ft trees
consumed per person per year.  Belgium consumes the most trees, at 8.51 per person, while
Azerbaijan consumes the least at 0.16 per person.
This graph explains the amount of paper consumed by some major countries by depicting the
number of forty foot trees consumed per person. It show Belgium with the most.