the picture is a map of the mexicen part of north america in red and a small box in the  upper
right corner that focuses on one small part of the image
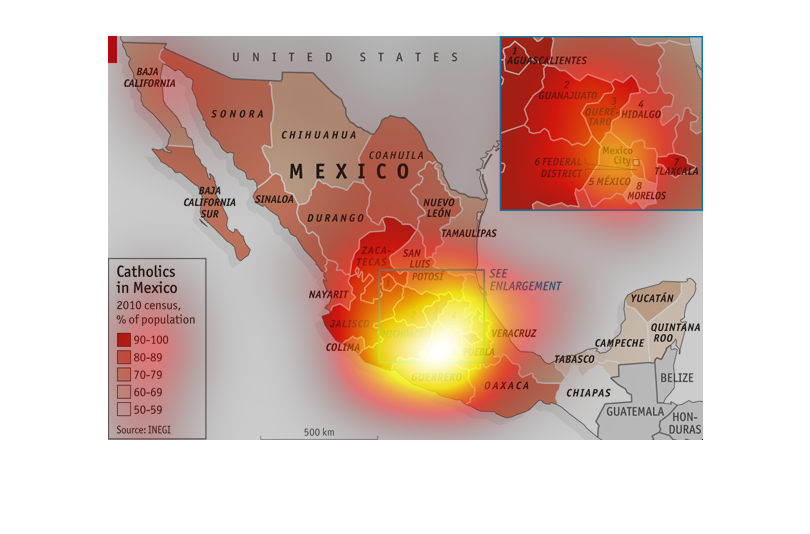
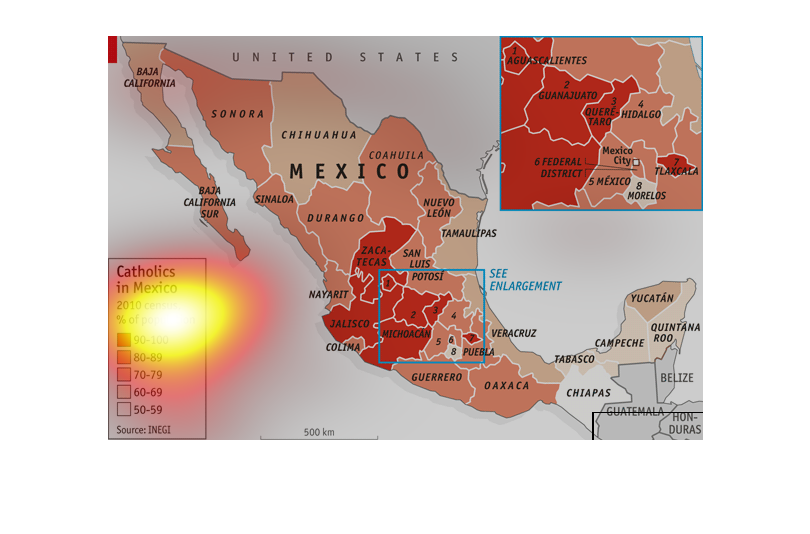
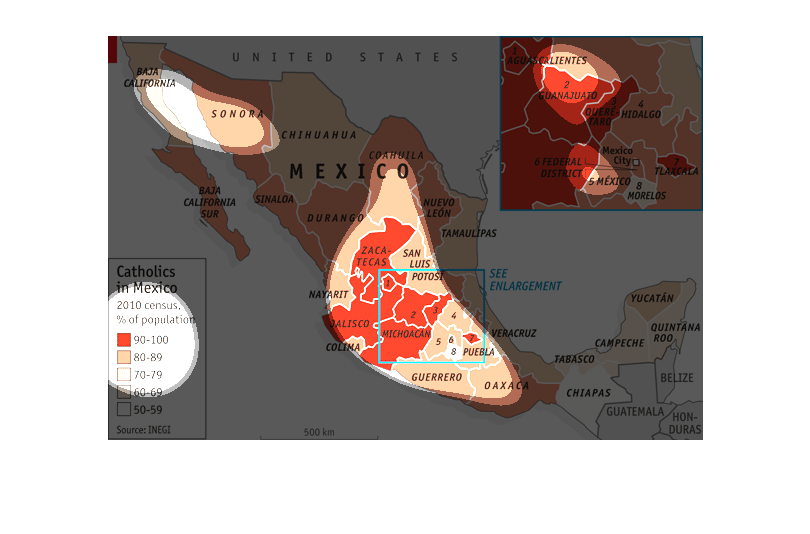
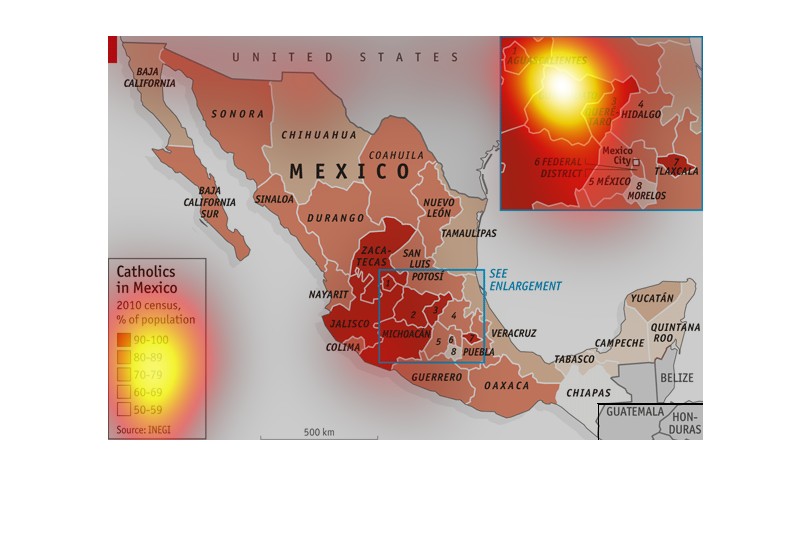
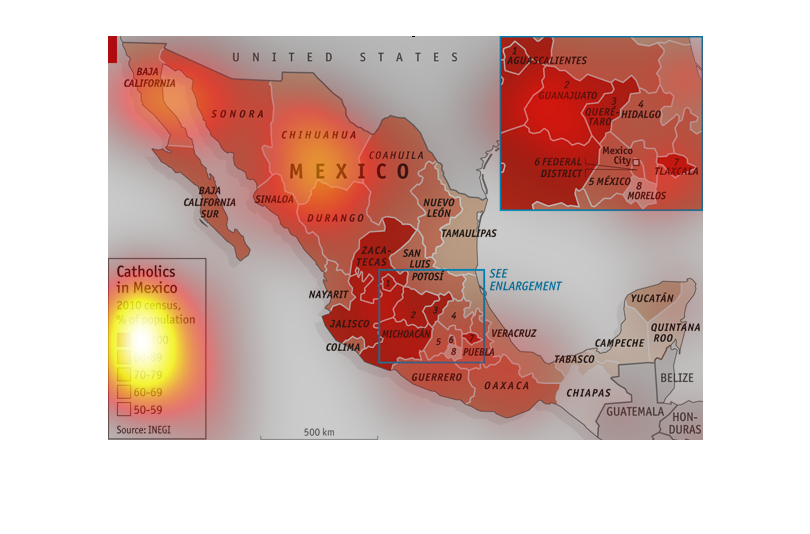
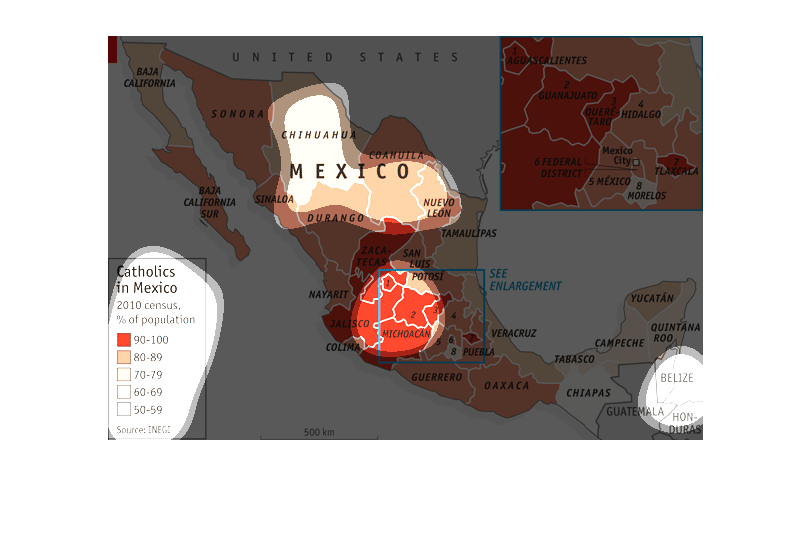
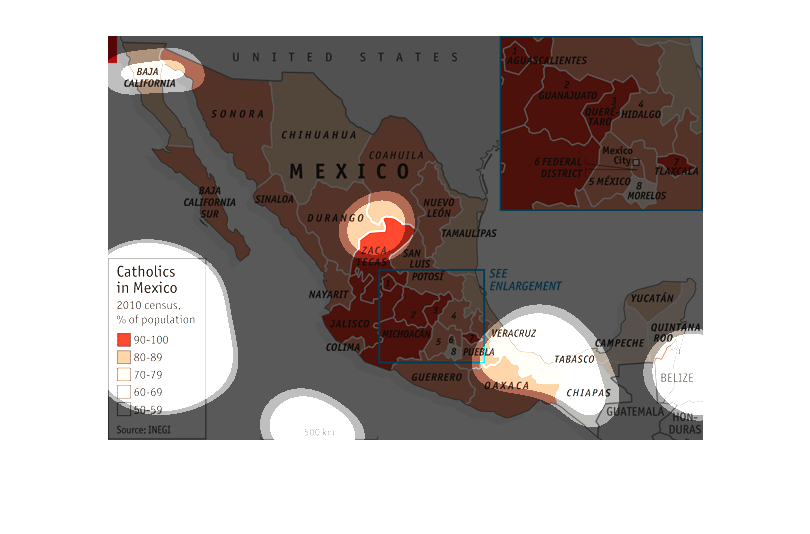
This charts describes and depicts on a map the two thousand and ten census of the country
of Mexico's catholic population percentage across the entire country.
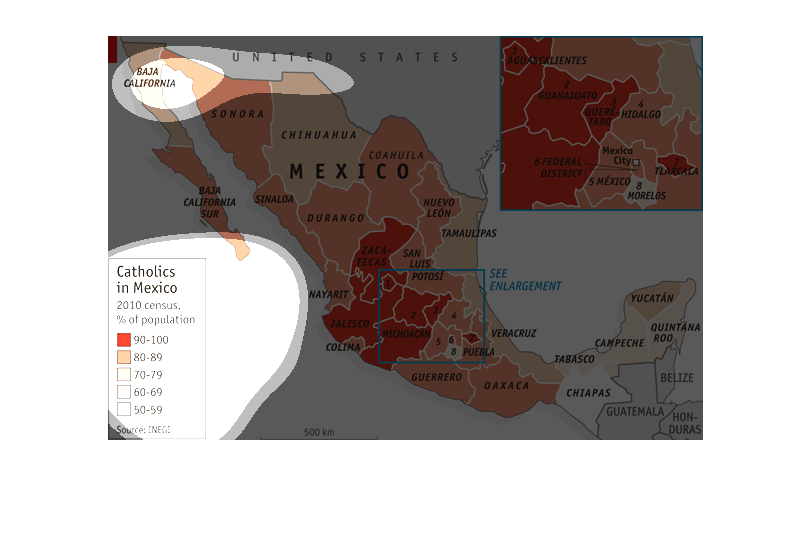
This is a map of Baja California extending into Mexico and a small part of Central America.
It s showing the amount of Catholics in Mexico from the 2010 census.
Map showing catholics in Mexico provinces as per 2010 census, Percentage of popultaion shows
a concentration ogf catholics in center provinces like Zacatecas and Jalisco.

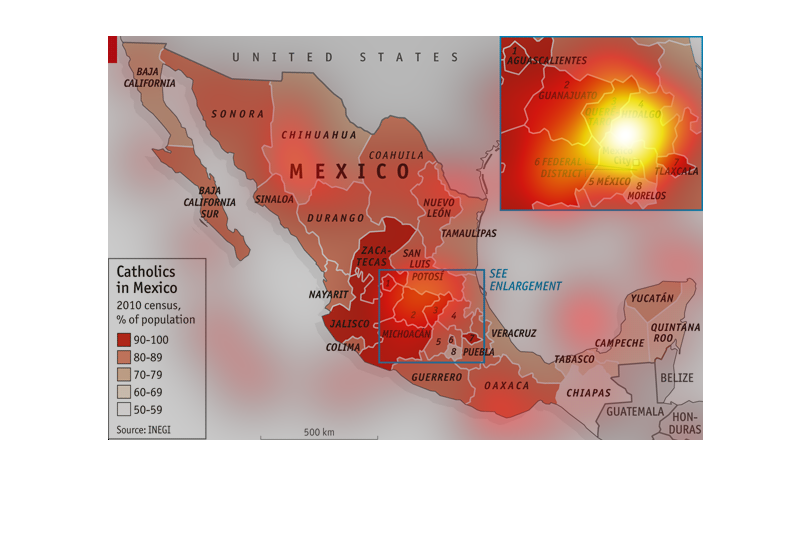
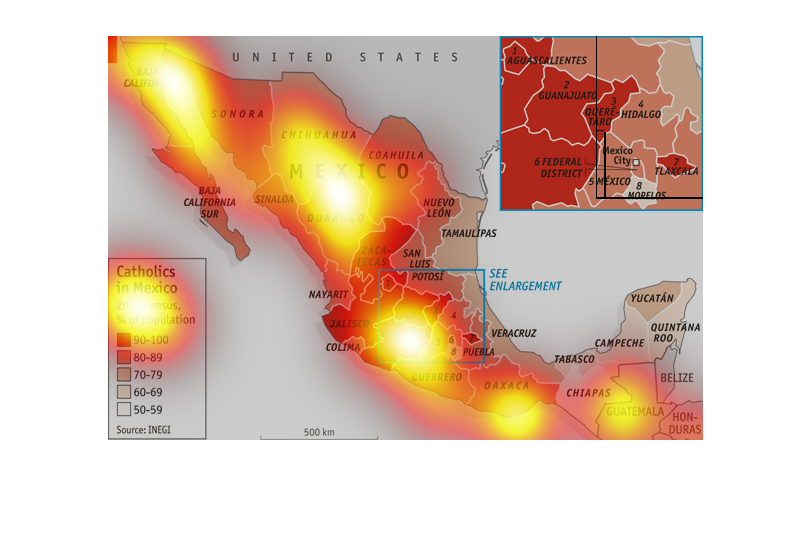
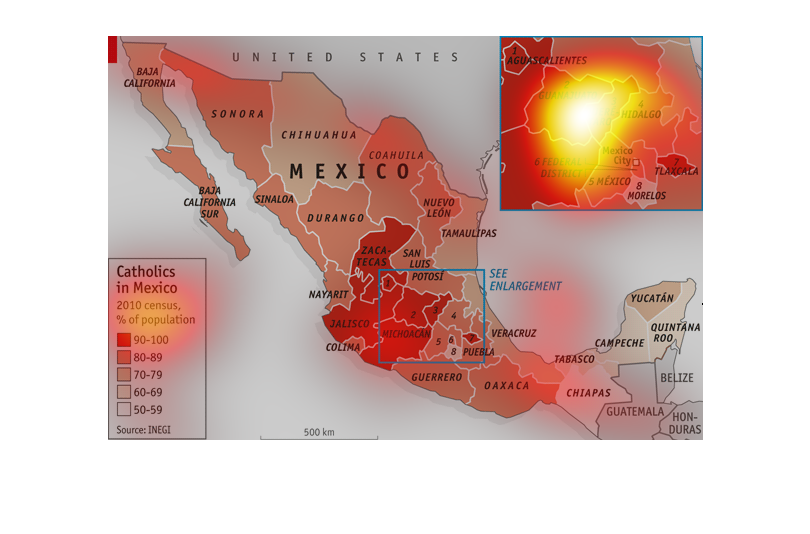
The graph shows the percentage of catholics in Mexico. This info is based off of a 2010 census
information poll. Based on the pictures of the graph it looks like the highest percentage
of catholics in Mexico live in the central region of Mexico.

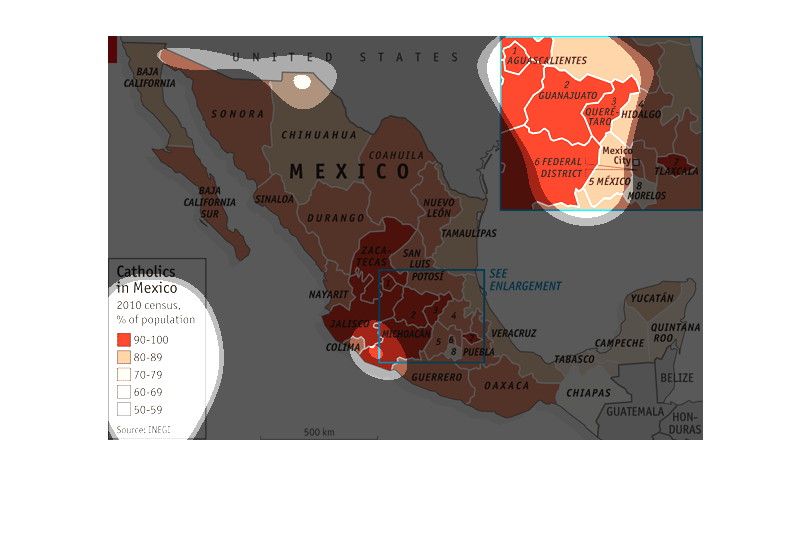
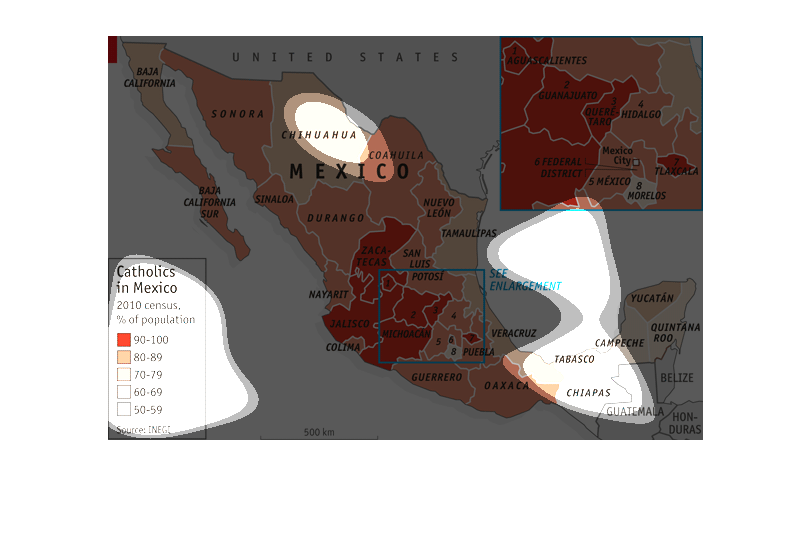
This is a map of Mexico, showing the percentage of Catholics in the population. Overall, the
map shows a large presence of Catholics in the total population. There are some areas with
a higher percentage (darker red) and some areas with a lower percentage (orange, tan, white).
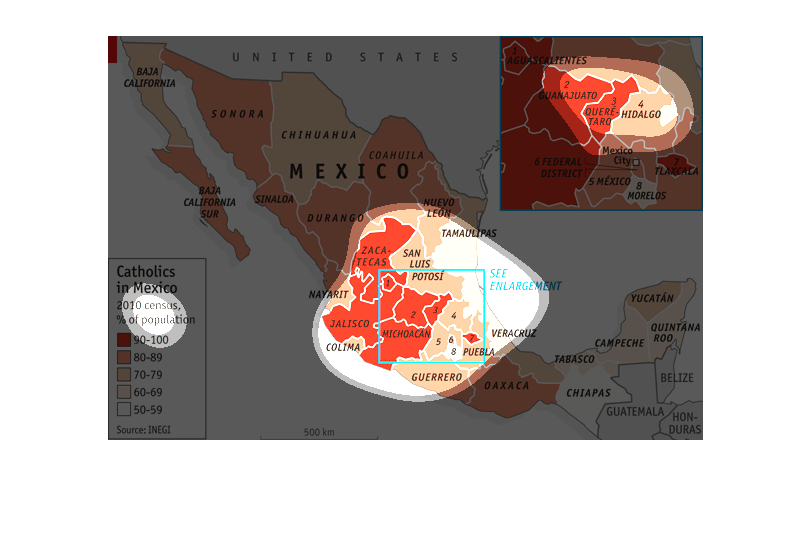
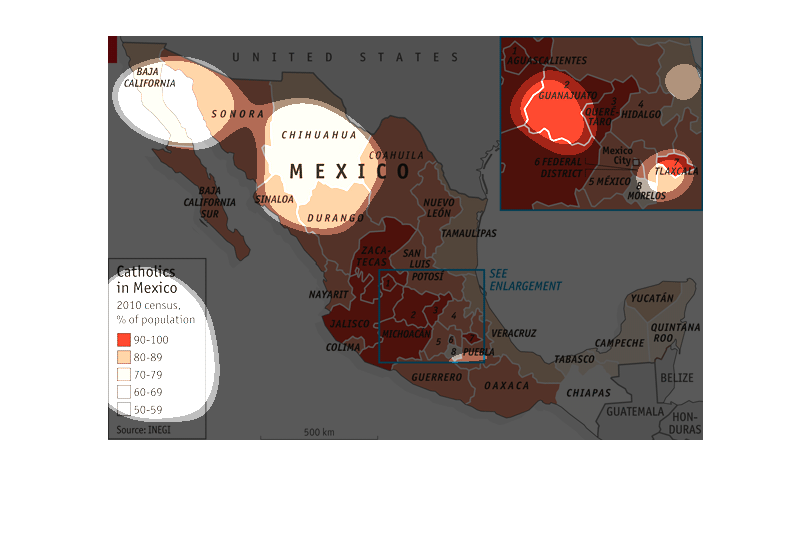
The image is a color coded map of Mexico indicating the concentration of Catholics in each
state as a percentage of population based on the 2010 census.  Percentages are indicated by
shading from white (lowest percentage Catholics) through red (highest percentage Catholic).
 There is an inset map in the upper right to show the smaller states around Mexico city.
Some states with high concentrations are Michoacan, Jalisco, Zacateas, Aguascalientes, Najuato,
Quentero, and Federal District.
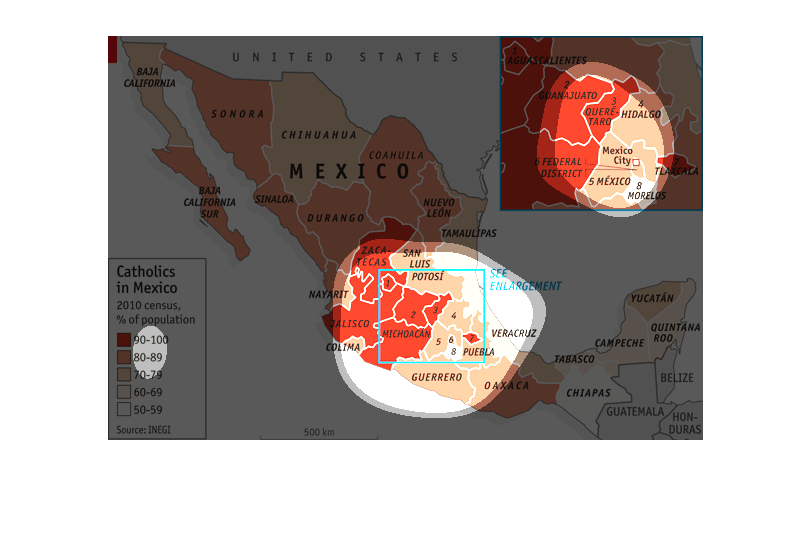
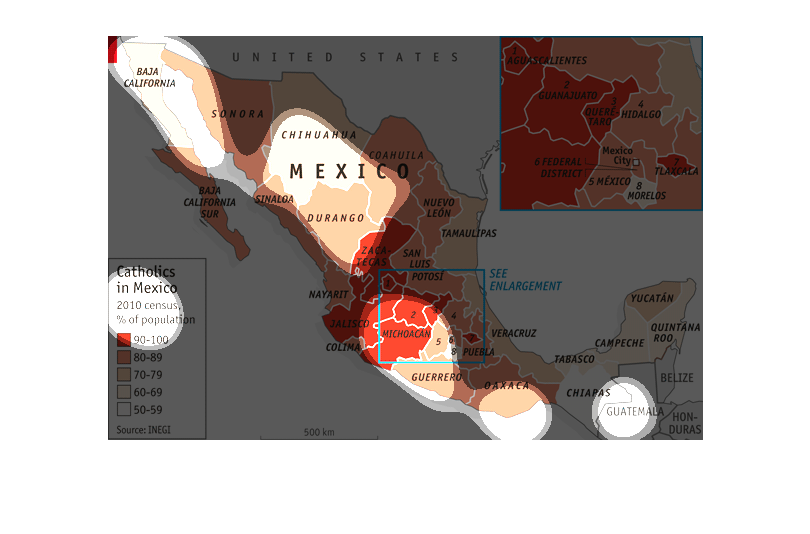
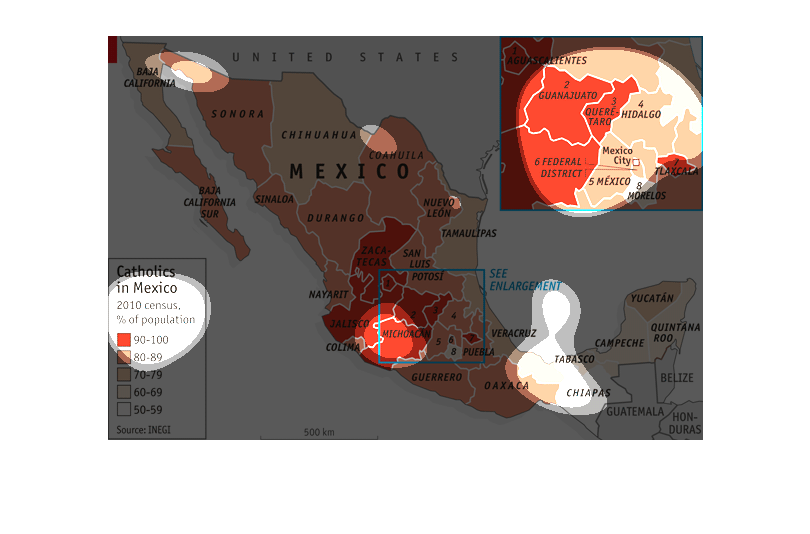
A map of Mexico showing to density of Roman Catholics in the population according to the 2010
census. In most of Mexico more than 80% of the people are Catholic.
This chart is a map of Mexico and it goes into different regions. The map is used to show
the number of catholics that are in Mexico based on the 2010 census.
The image describes how many Catholics are in Mexico.  It is based on 2010 census percentage
of population.  The use the colors red, pink, and white to highlight certain areas.
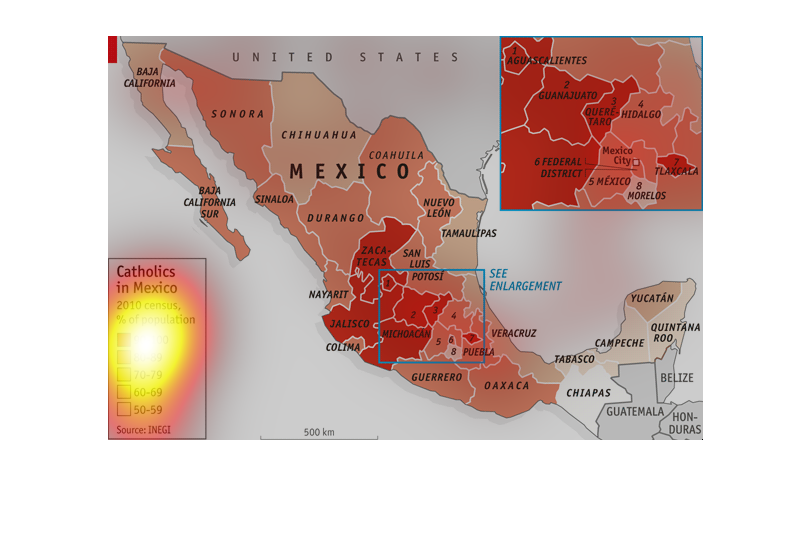

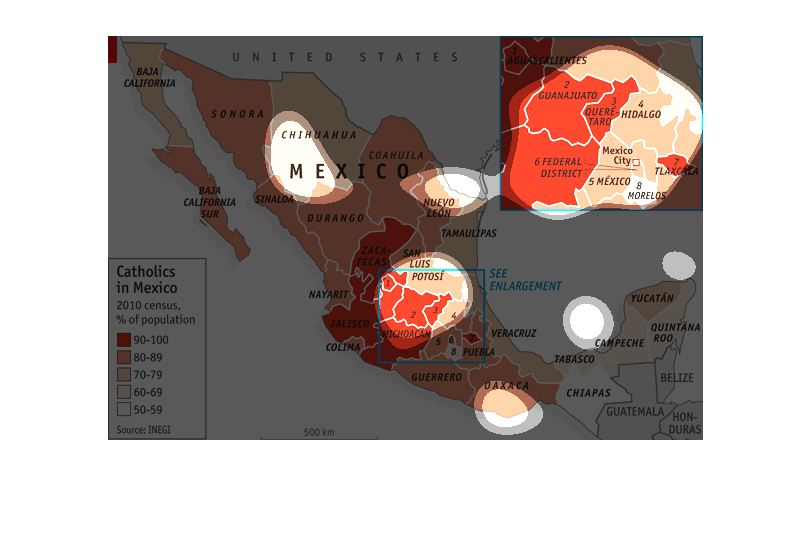
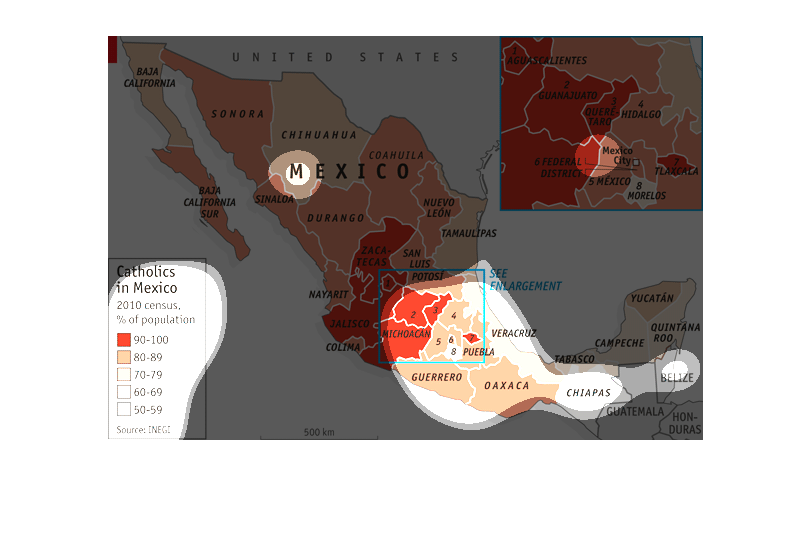
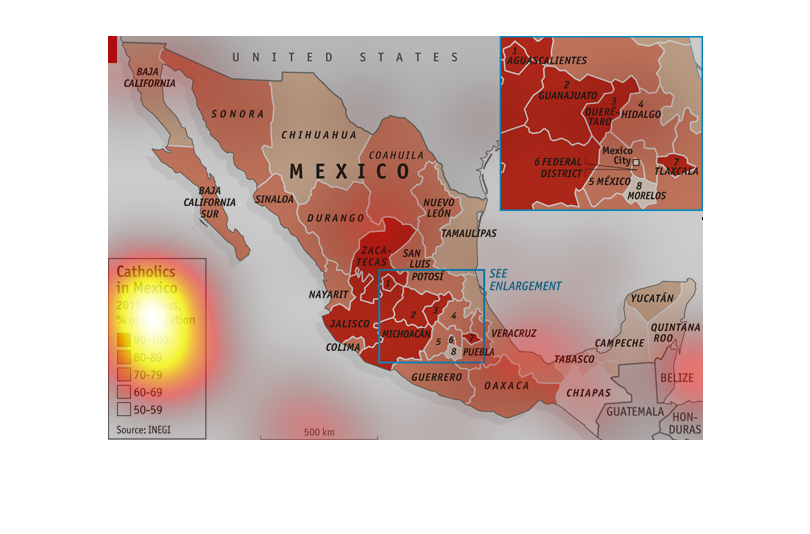
The graph seems to represent the 2010 consensus of what percentage of the population of Mexico
is Catholic. The graph uses a map of the region which is color coded to display the percentage.
 90-100% is red and 50-59% is white. There is a lot of red on the eastern region of the map
and a lot of white in the southern region.
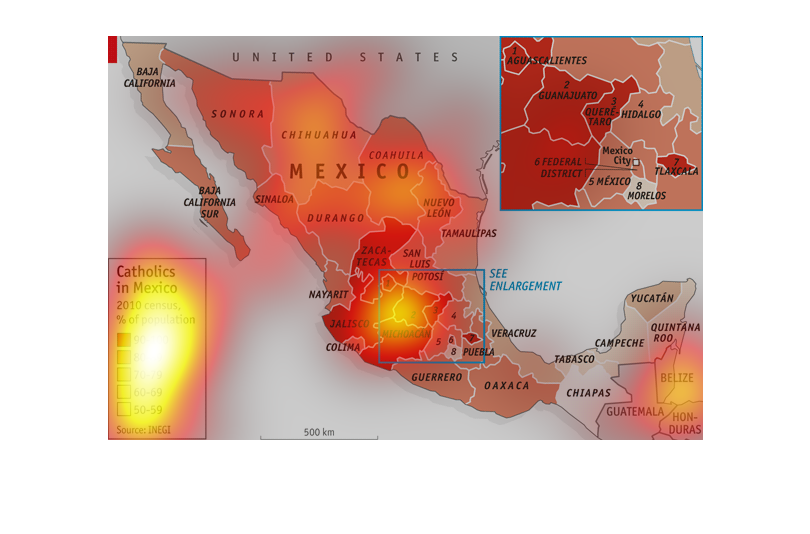
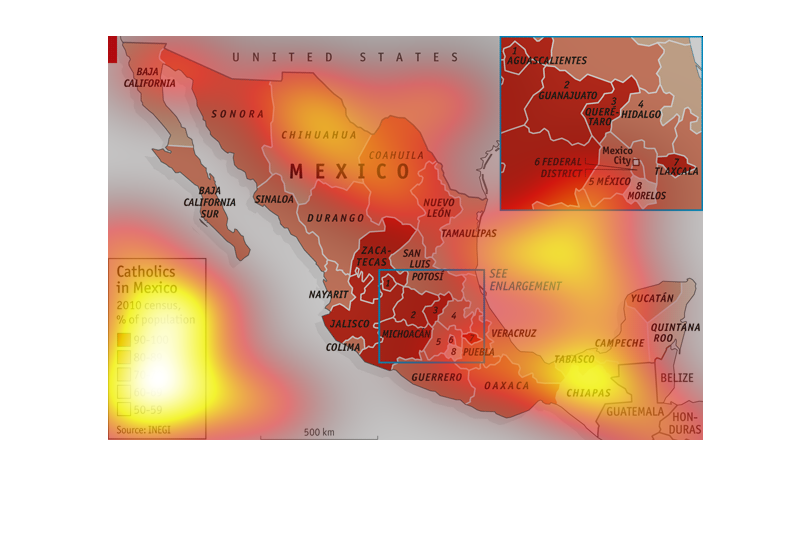
This map/chart depicts the percentage of Catholics in Mexico from the 2010 census broken down
by area. It shows the highest concentration is located in the central/southern portion of
the country.
This is a image that showing is  catholic churches in Mexico and over populated there are
in parts of the Mexico. Mostly churches in the area Durango .
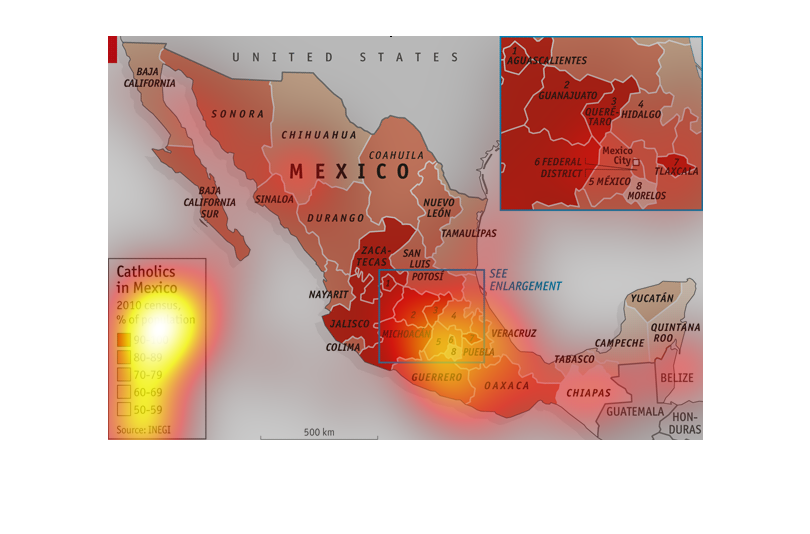
This image shows a heat map of the areas of Mexico that are most densely catholic, going by
the numbers gleaned from the 2010 census report. The darkest red regions are 90-100 percent
catholic. The area that is most Catholic by percentage is outside of Mexico City but not in
Mexico City. IT looks like the suburbs are more heavily Catholic than the urban center.