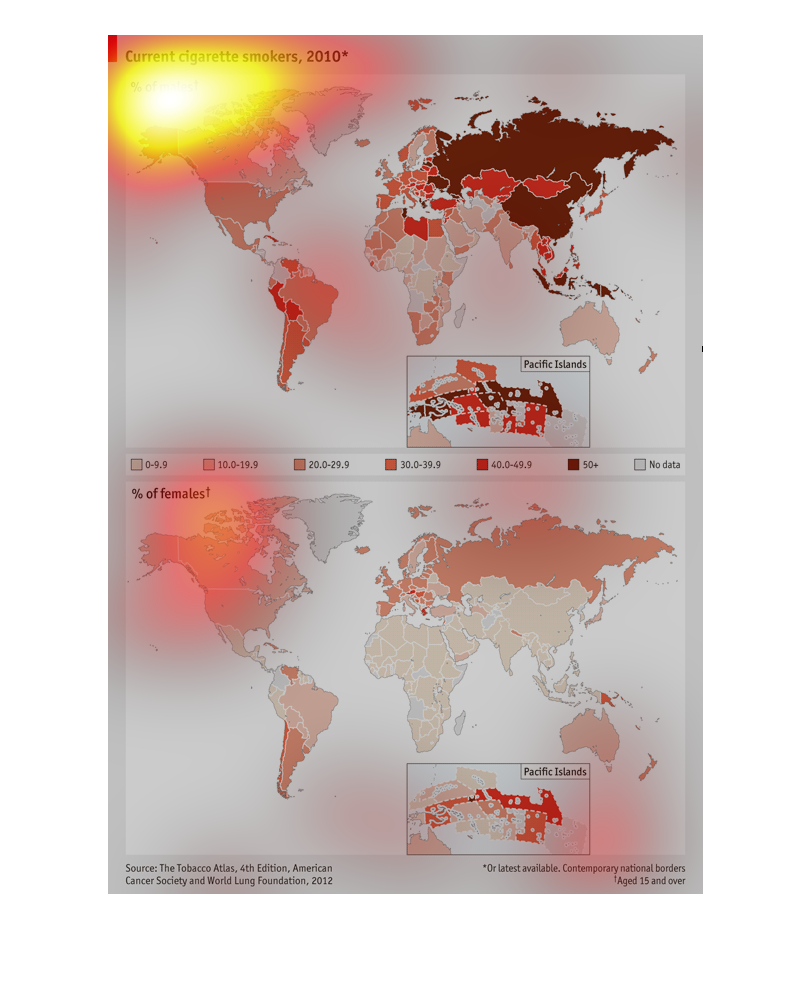
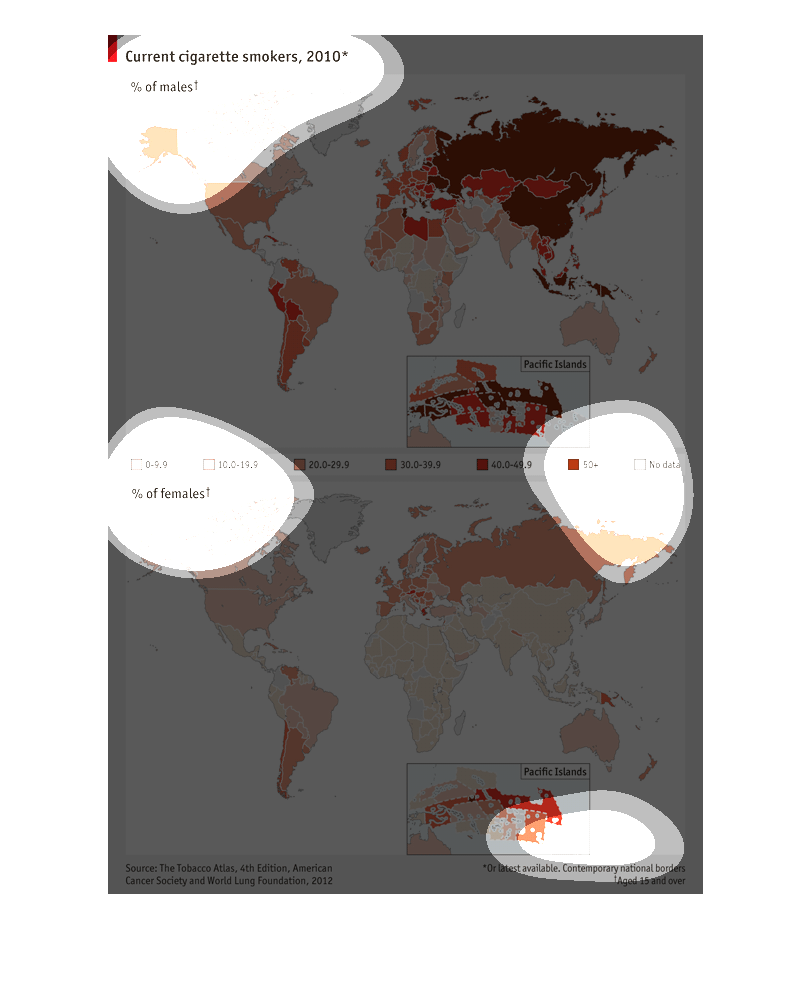
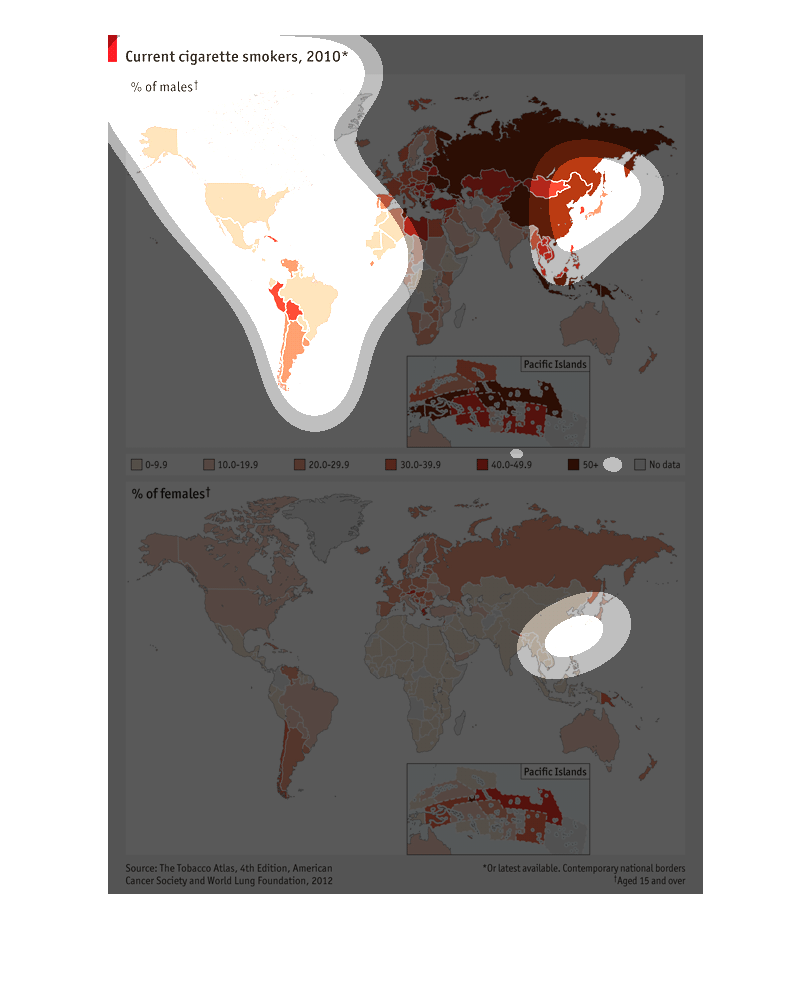
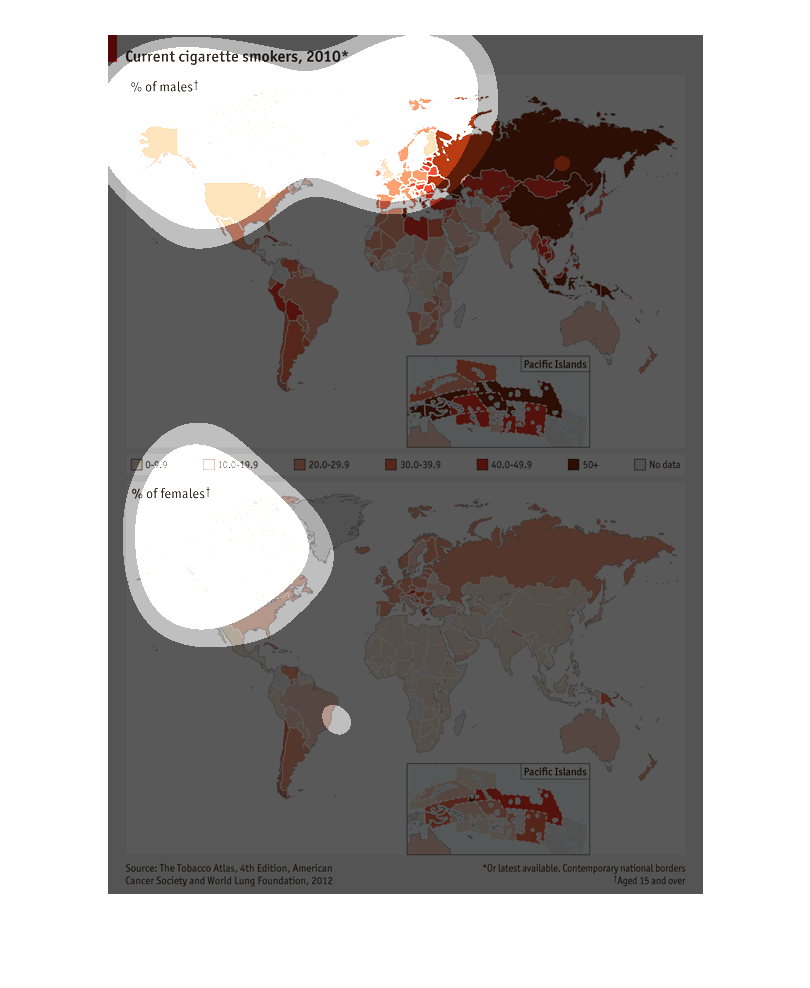
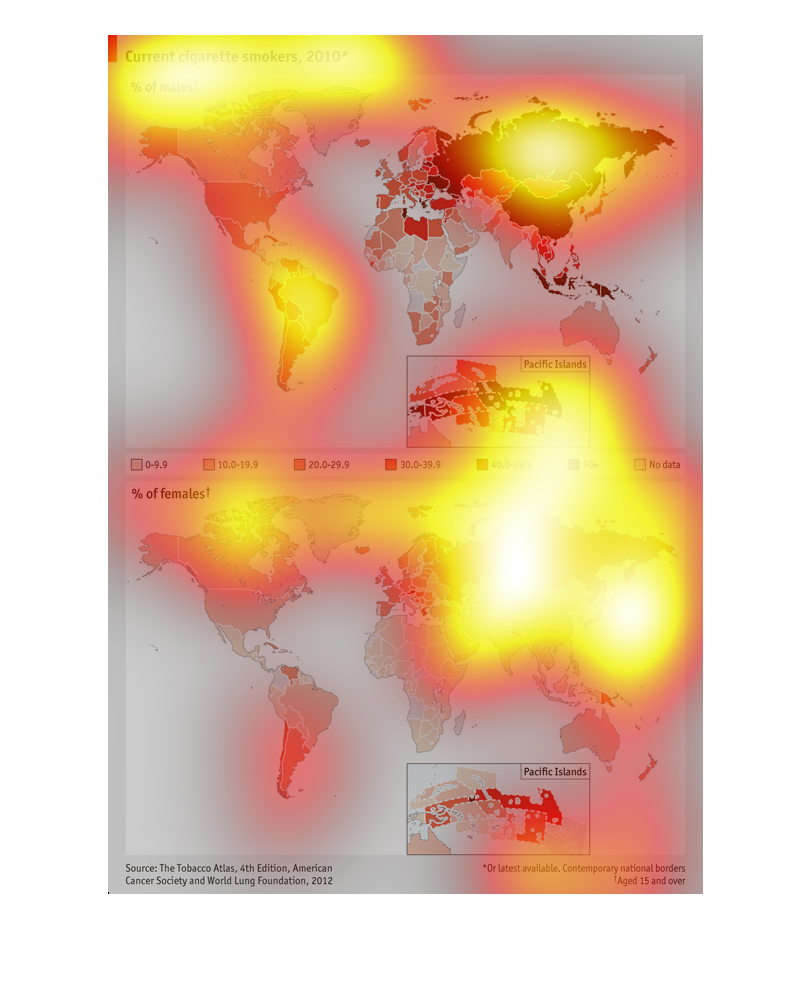
The chart shows the percentage of cigarette smokers all over the world in the year 2010, with
darker colors representing more cigarette smokers. The top half shows the percentage of male
smokers and the bottom half shows the percentage of female smokers.
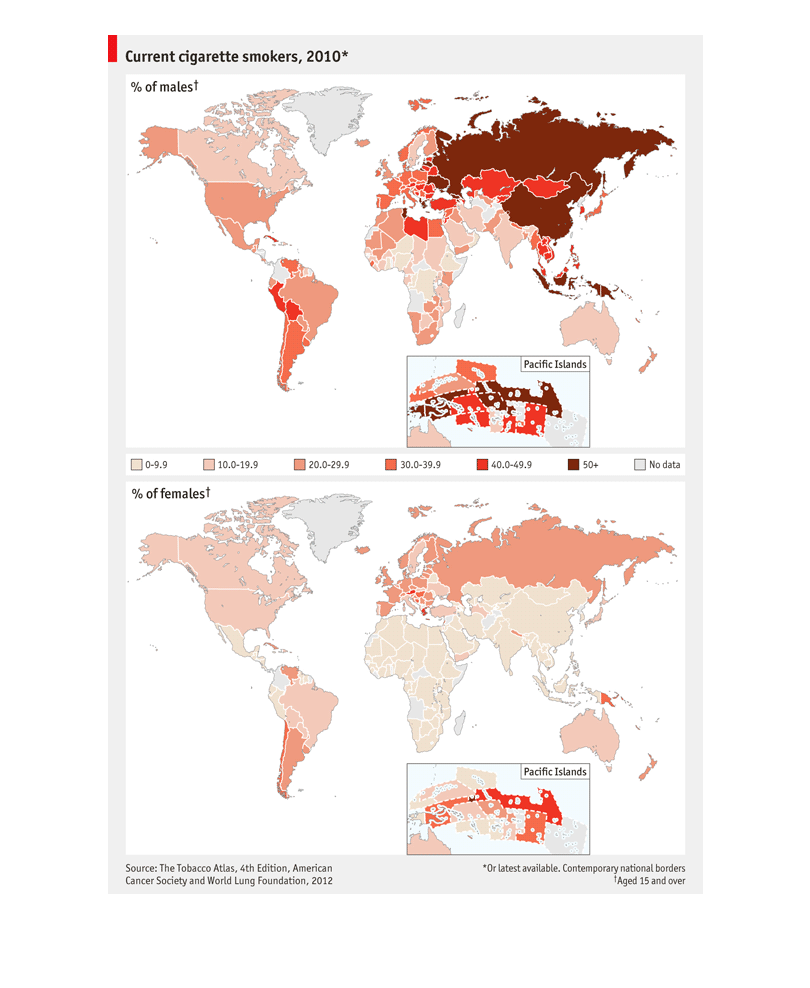
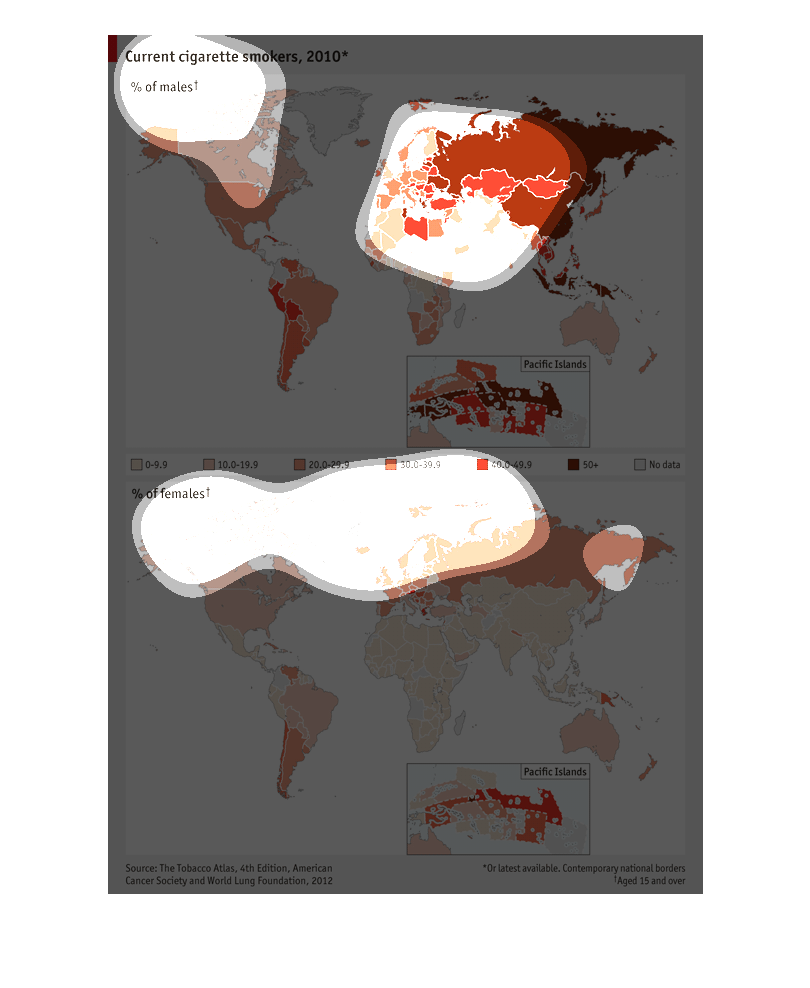
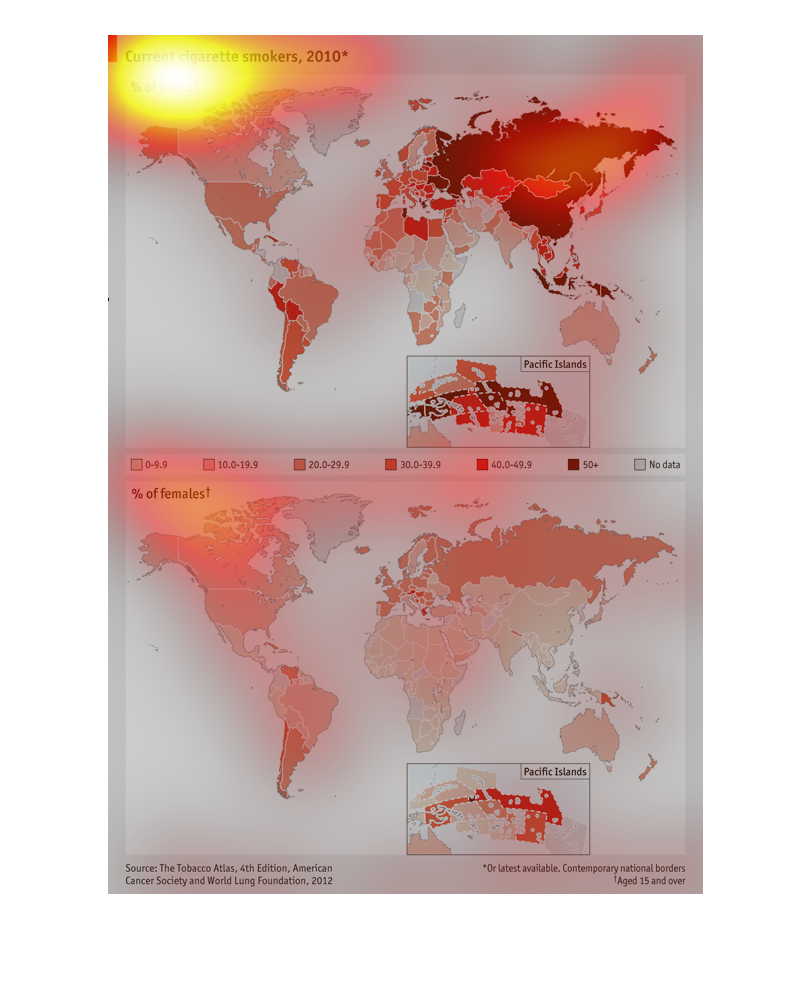
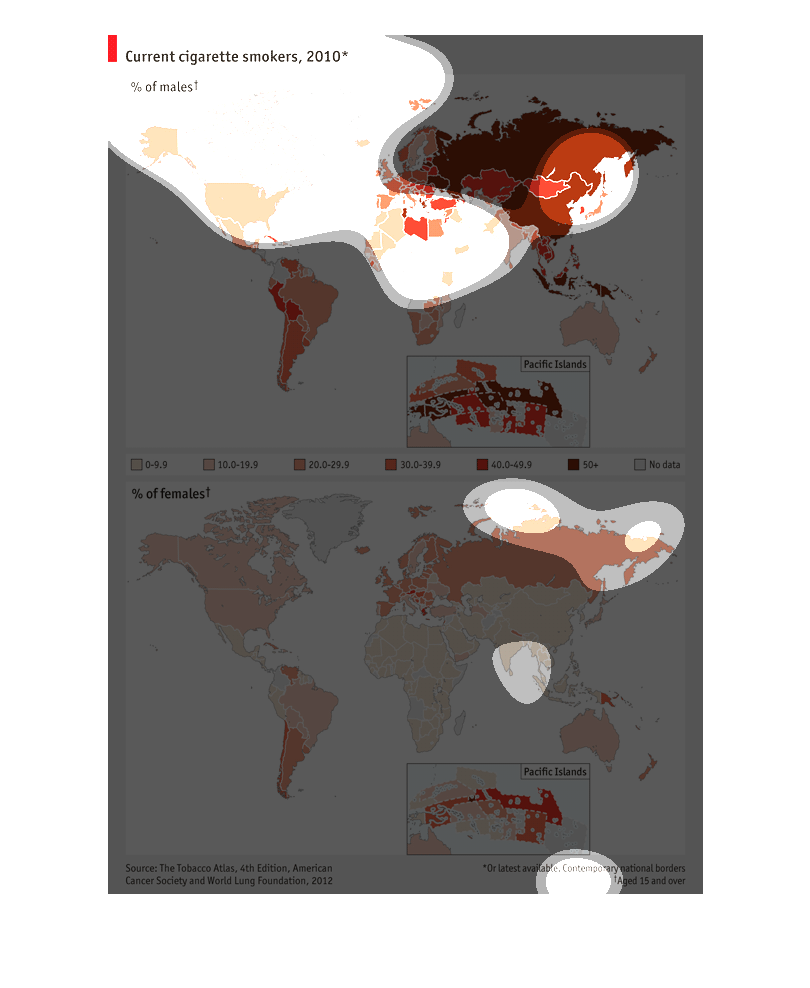
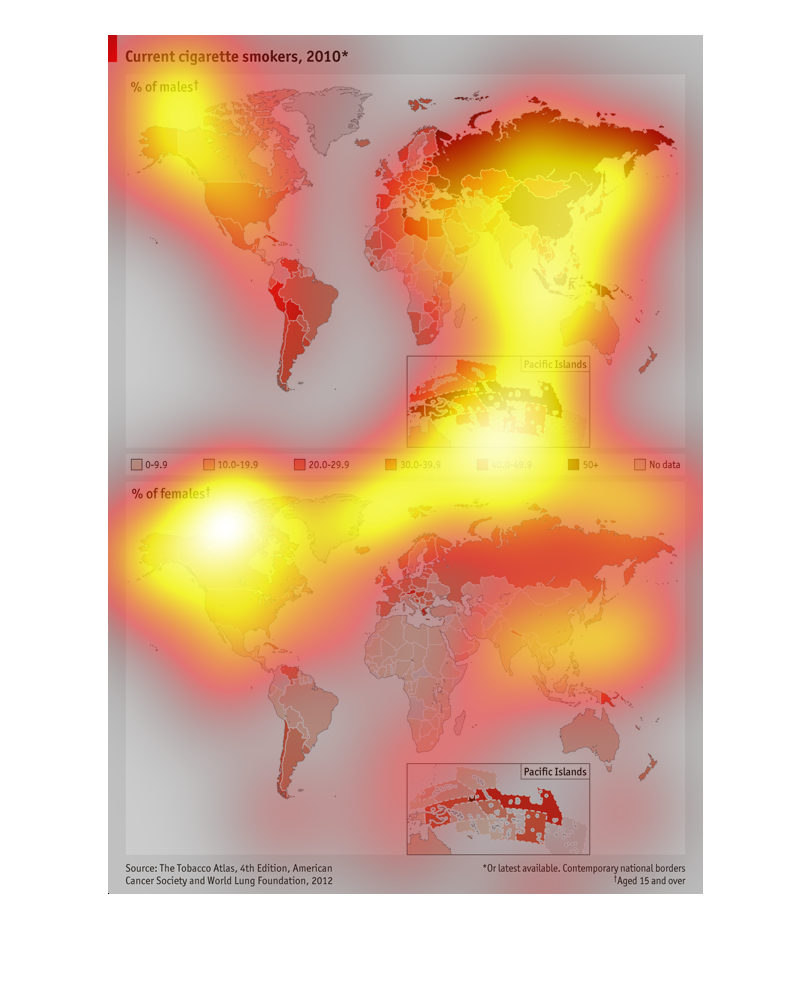
world map of cigarette smokers in 2010 for males in one map and females in another map. The
darker the shade of red, the more populated smokers in the area. Male smokers are more concentrated
in Europe.  Whereas there are generally less female smokers throughout the world.
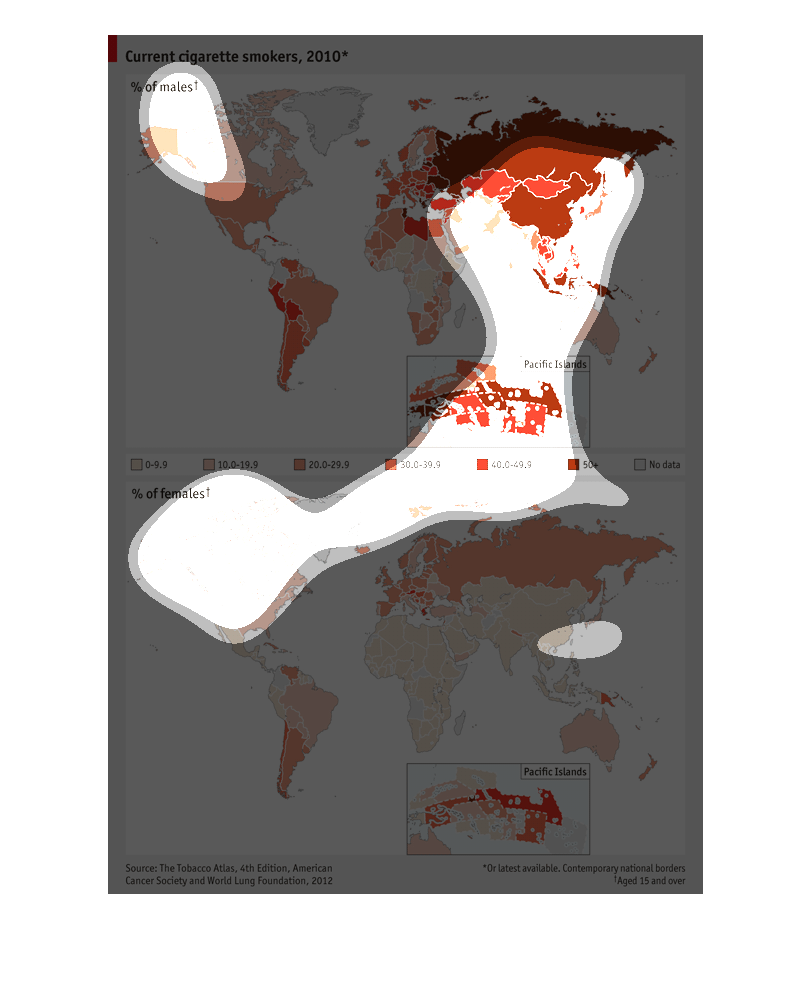
Map of the world showing the number of cigarette smokers as of 2010.  The map then further
breaks down the cigarette smokers as % of females showcasing a smaller demographic.
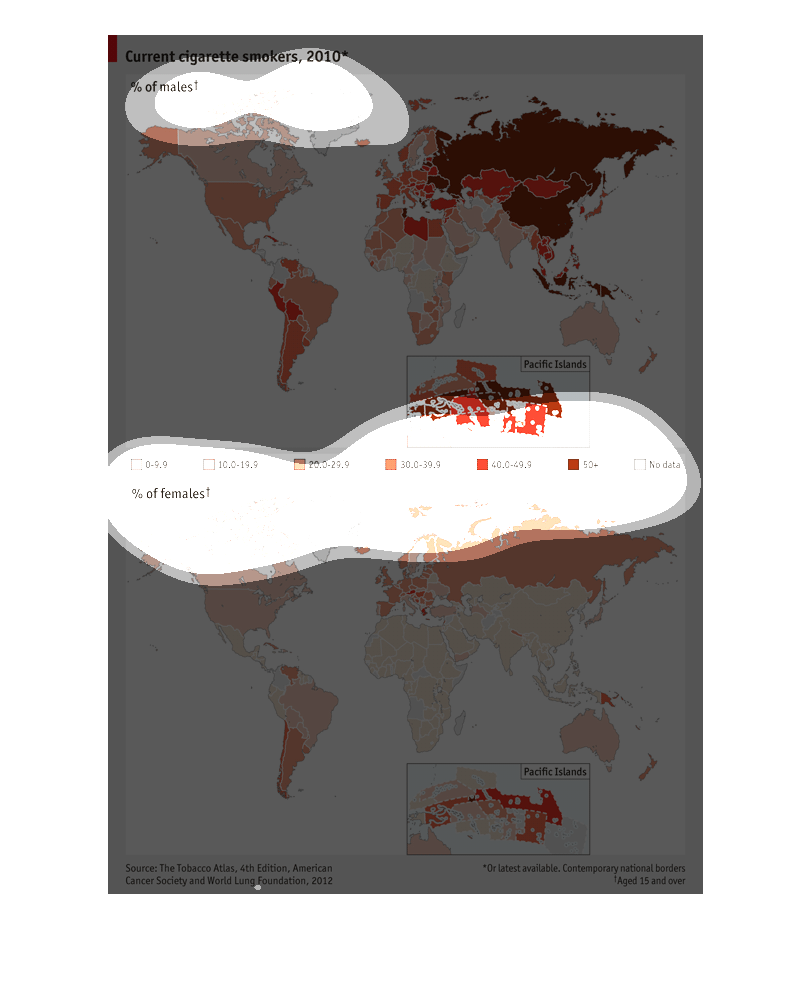
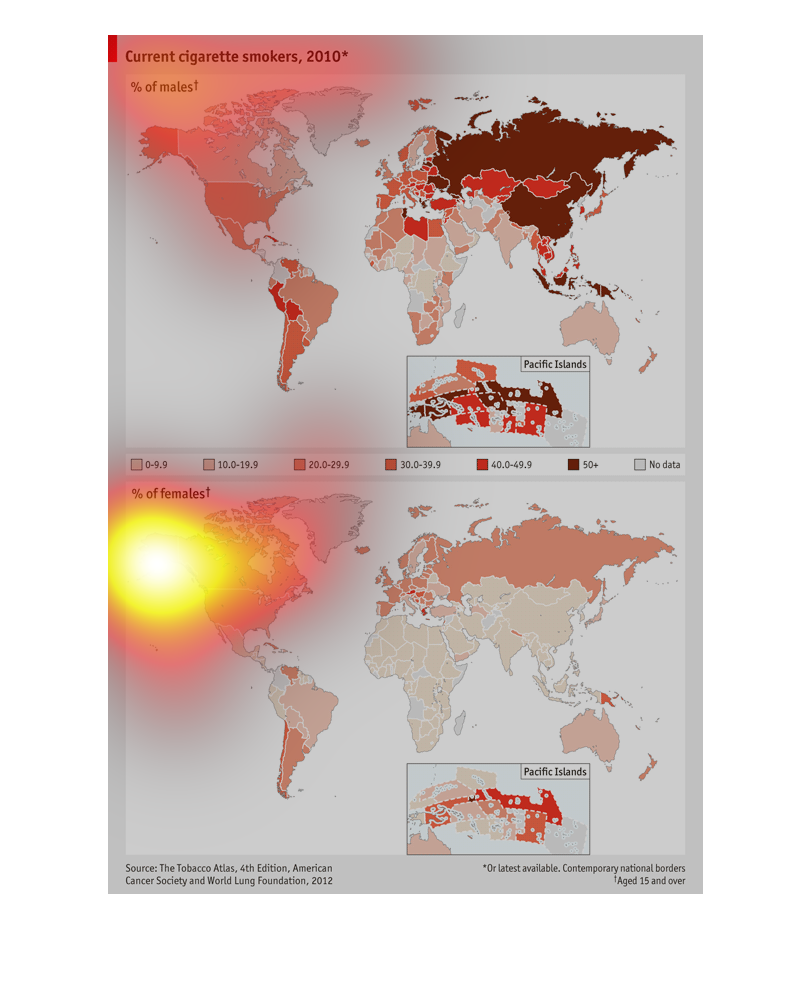
The title of the graph is "Current cigarette smokers, 2010". The graph has two parts: the
top half shows the percent of male cigarette smokers, and the bottom half shows the percent
of female cigarette smokers. In both cases, percentages are highest in Asia and the Pacific
Islands, with percentages higher for men in both places. Other regions have a concentration
of cigarette smokers such as parts of Europe and South America.
The chart details the current cigarette smokers in different parts of the world in the year
2010.  The image presents the information about cigarette smokers by geographical area--that
is, in this case, by continent.
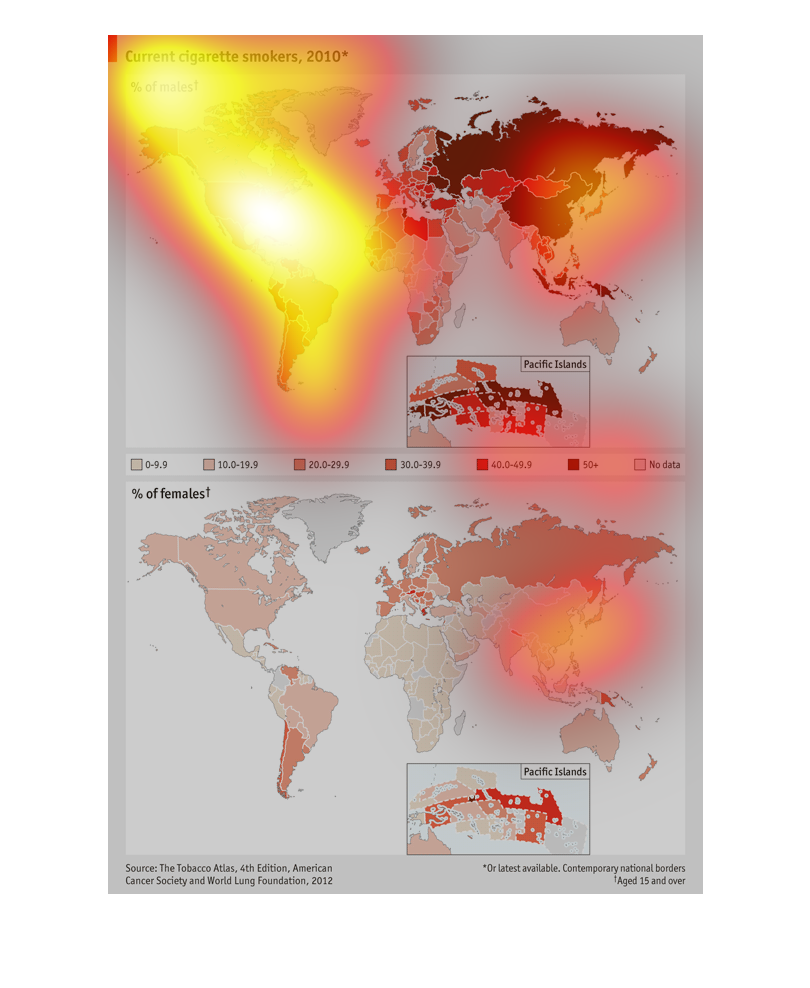
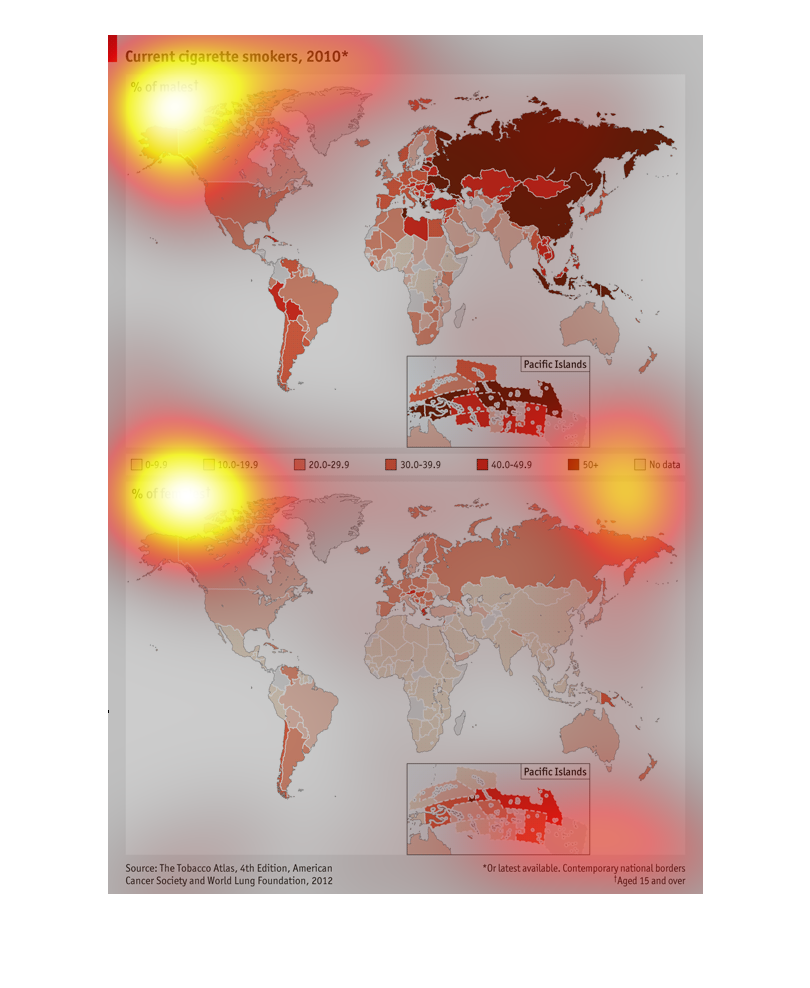
Current Cigarette Smokers in 2010 per country also showing which countries have more and what
percentage are females in those countries that smoke.Europe looks to have a lot of smokers.
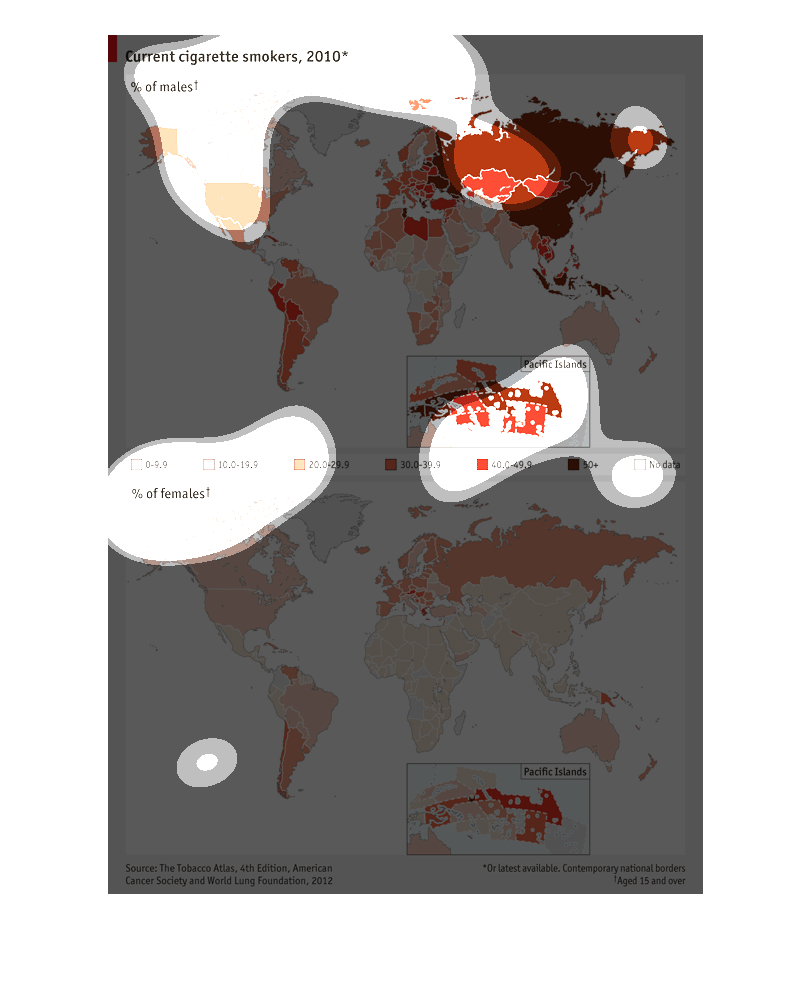
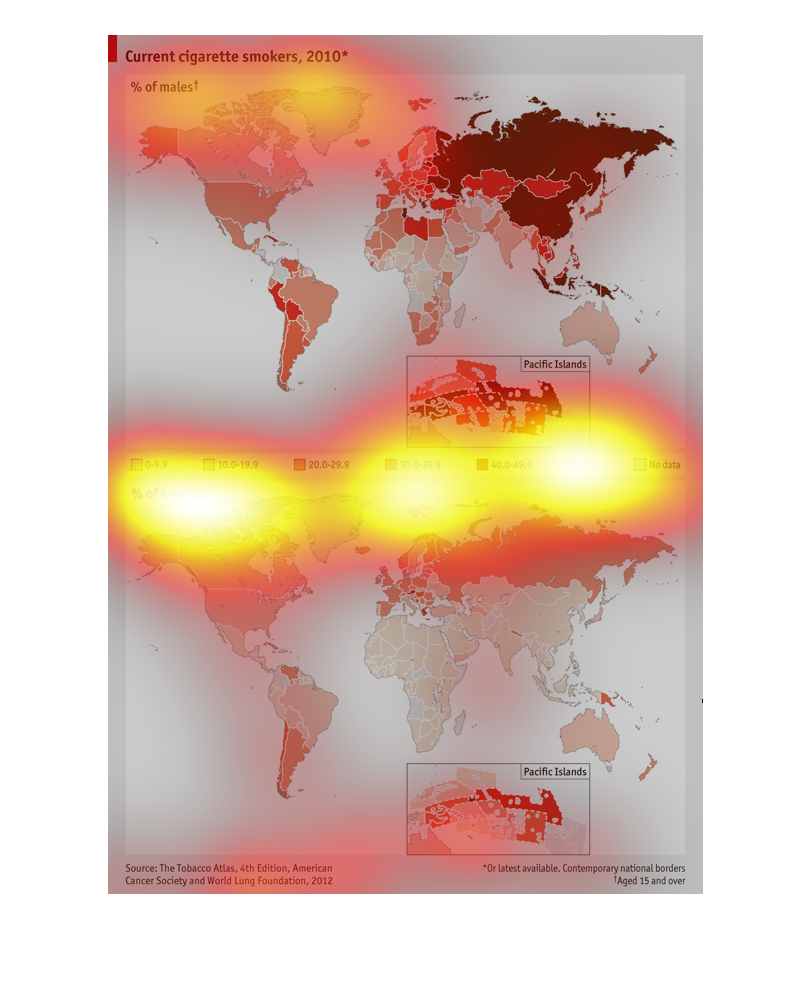
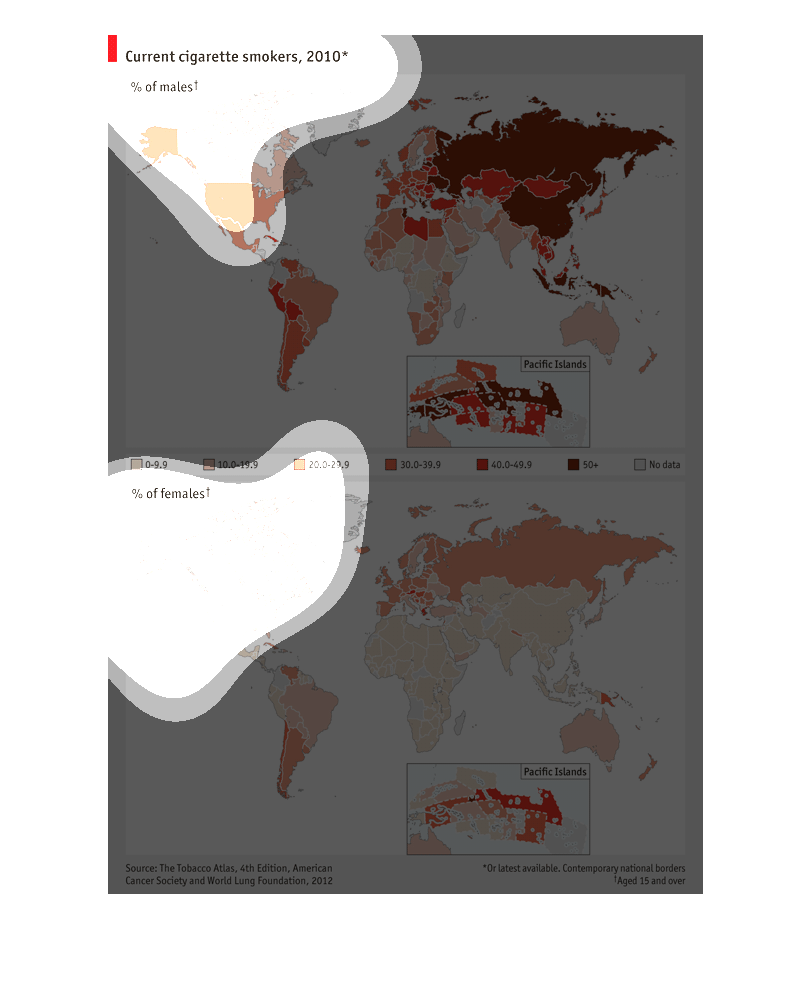
Current cigarette smokers in 2010+ The chart depicts the percentages between males and females
in North America and Europe. The percentage of males in Europe smoke more.
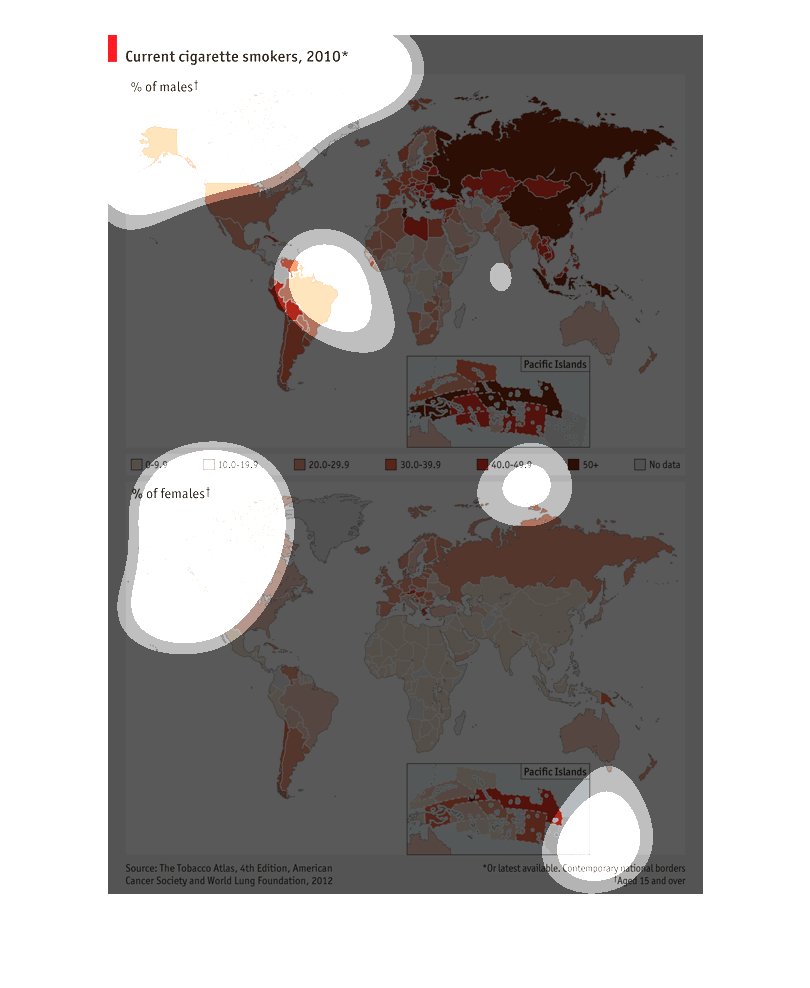
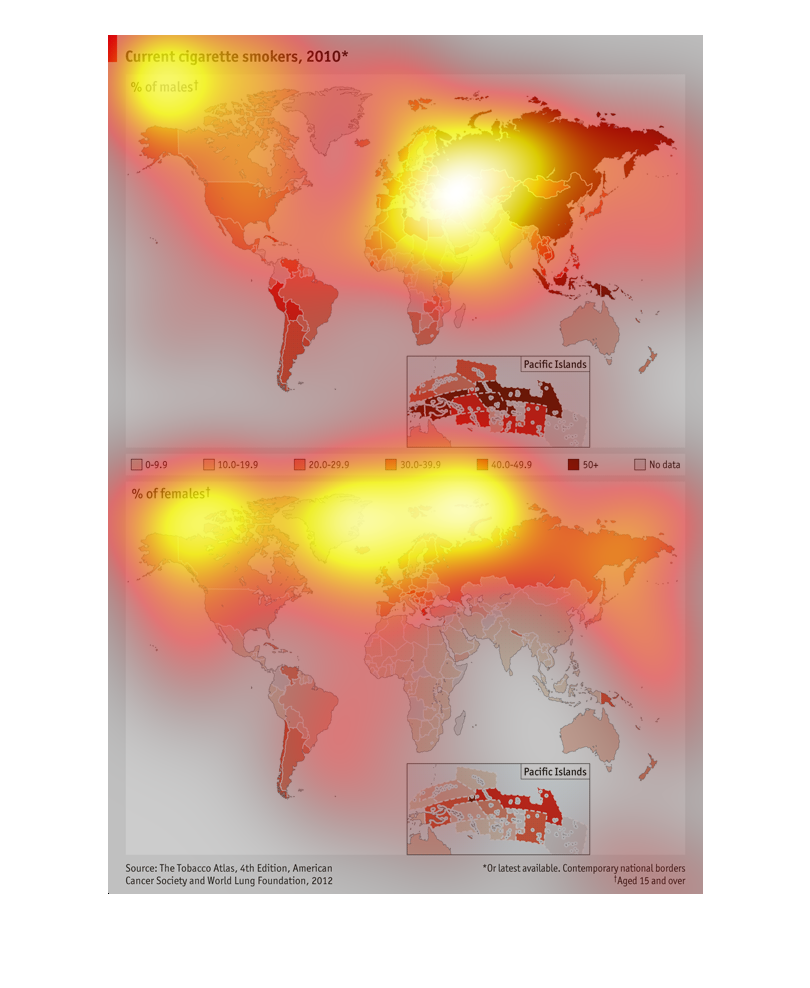
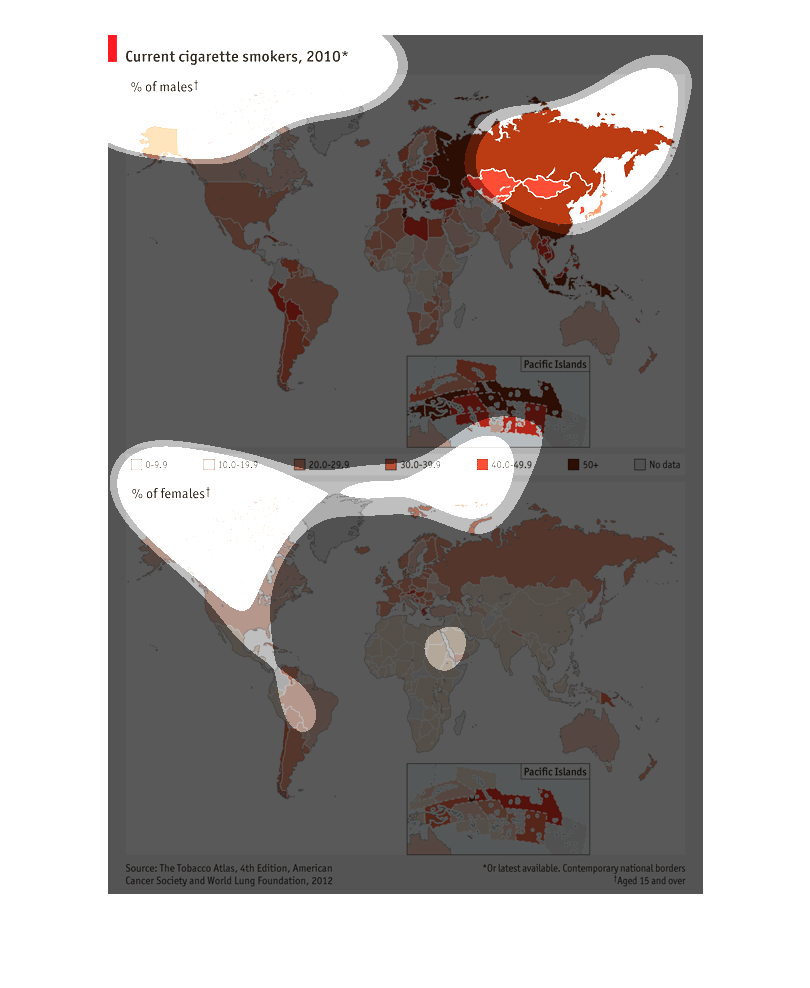
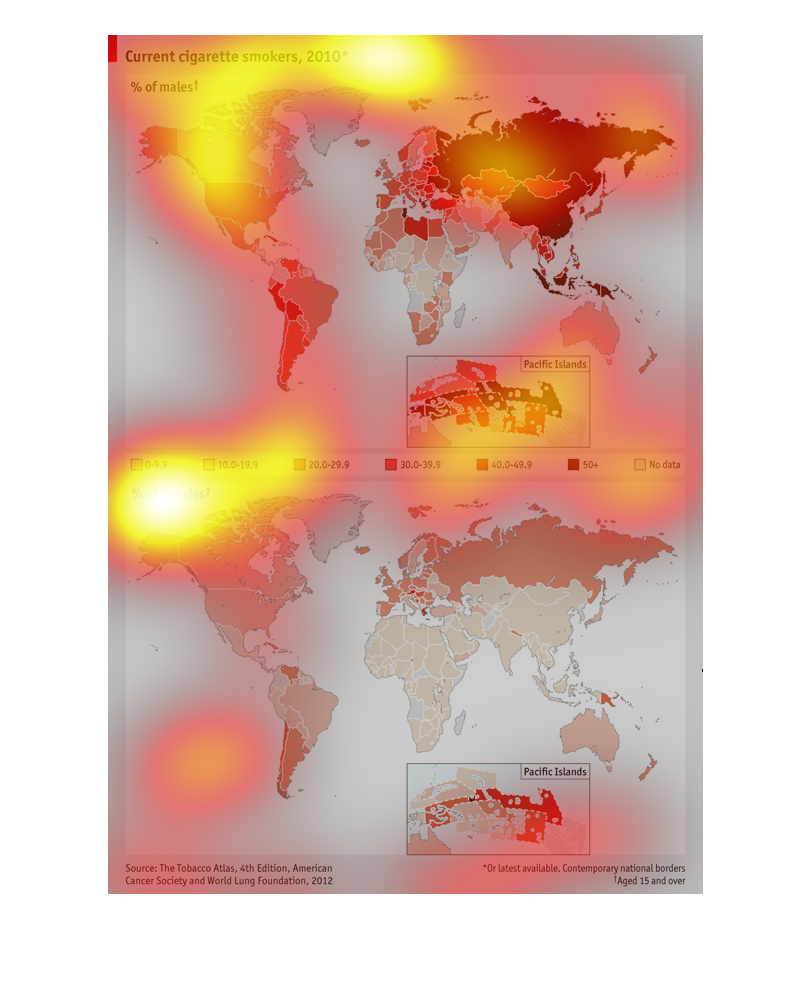
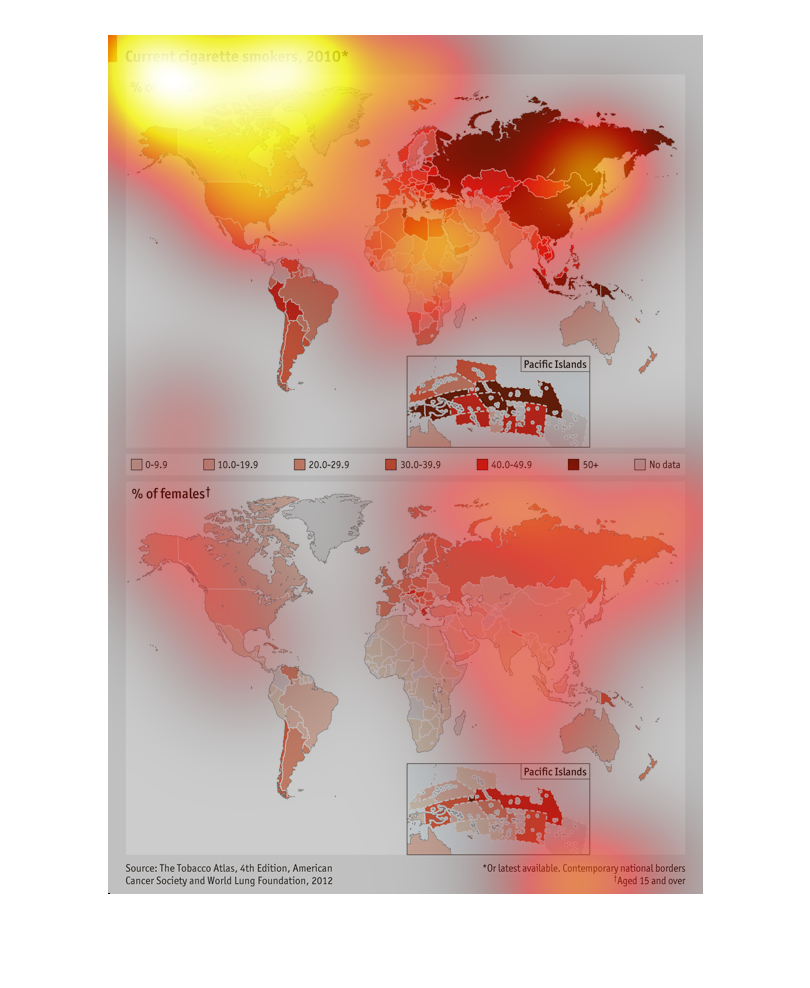
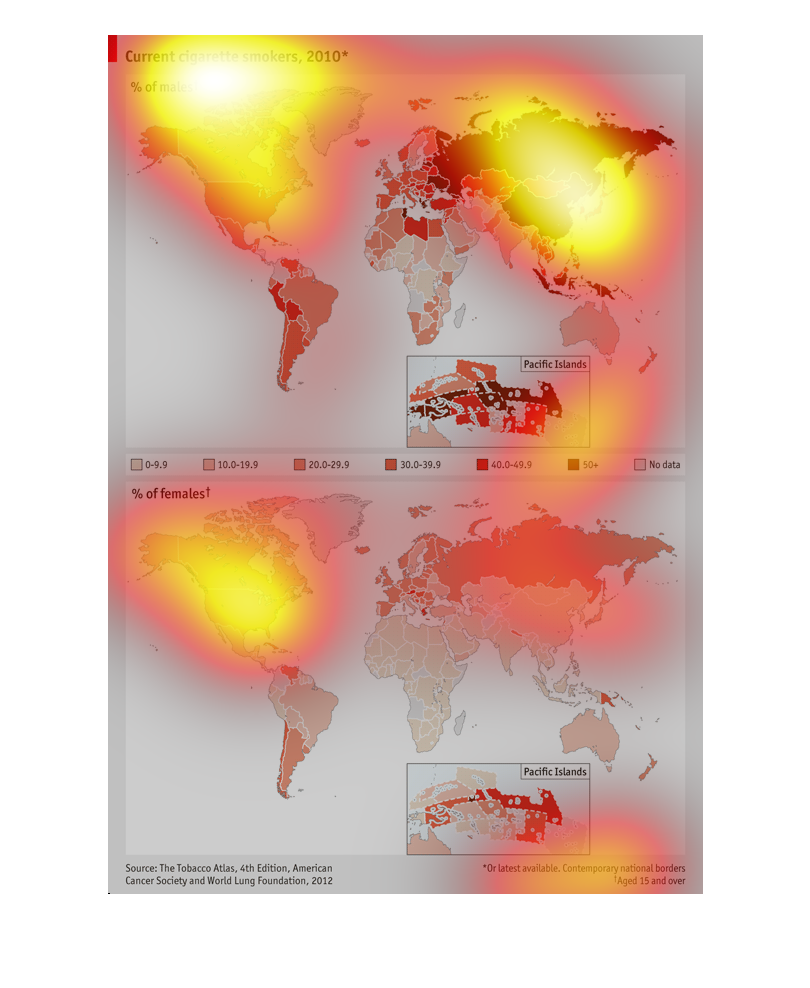
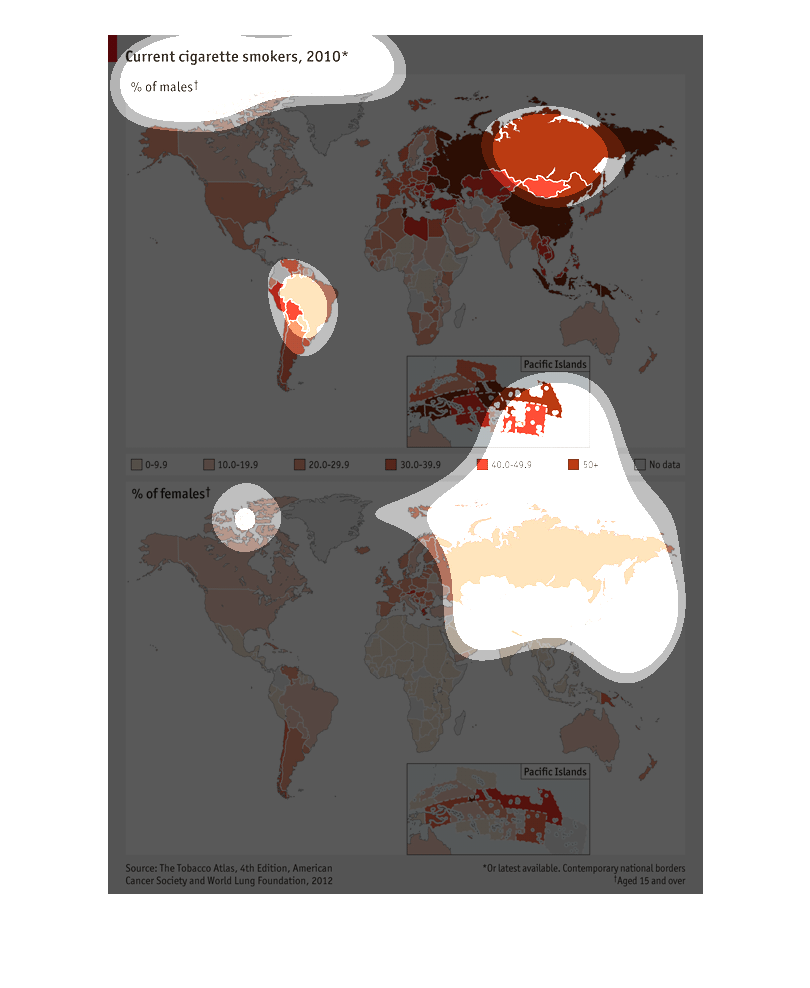
This graph shows current male and female cigarette smokers in the world in 2010. The top graph
represents male cigarette smokers and the bottom represents female cigarette smokers. The
heaviest density of cigarette smokers are males in Russia. For females, the heaviest demographic
for smokers seems to be in the Pacific Islands.
This is a account of geographic cigarette smokers across the world. A map of all the continents
is demonstrated showing areas of cigarette smokers. The pacific islands are included in this.

This graph shows a world choropleth map of cigar smokers in the year 2010.  There is also
a secondary choropleth map detailing the percentage of cigar smokers who are men.
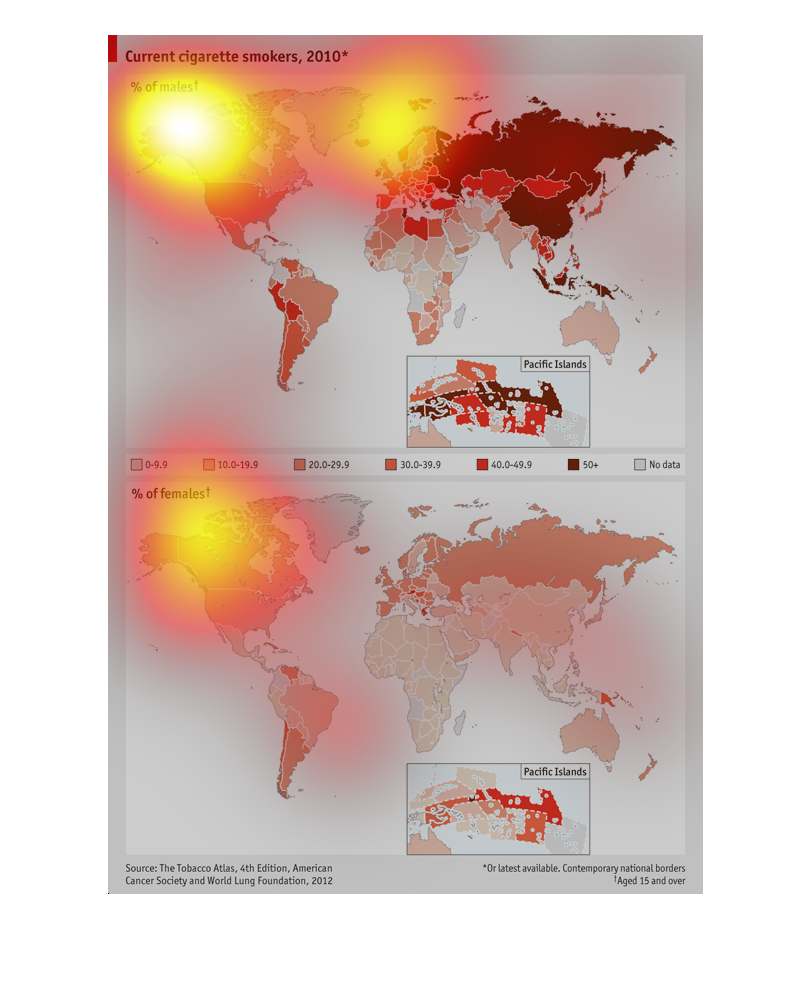
This chart describes current cigarette smokers in 2010.  It also describes the per cent of
males vs. females who smoke in various world regions.  Males are heavy smokers in Europe and
Pacific Islands
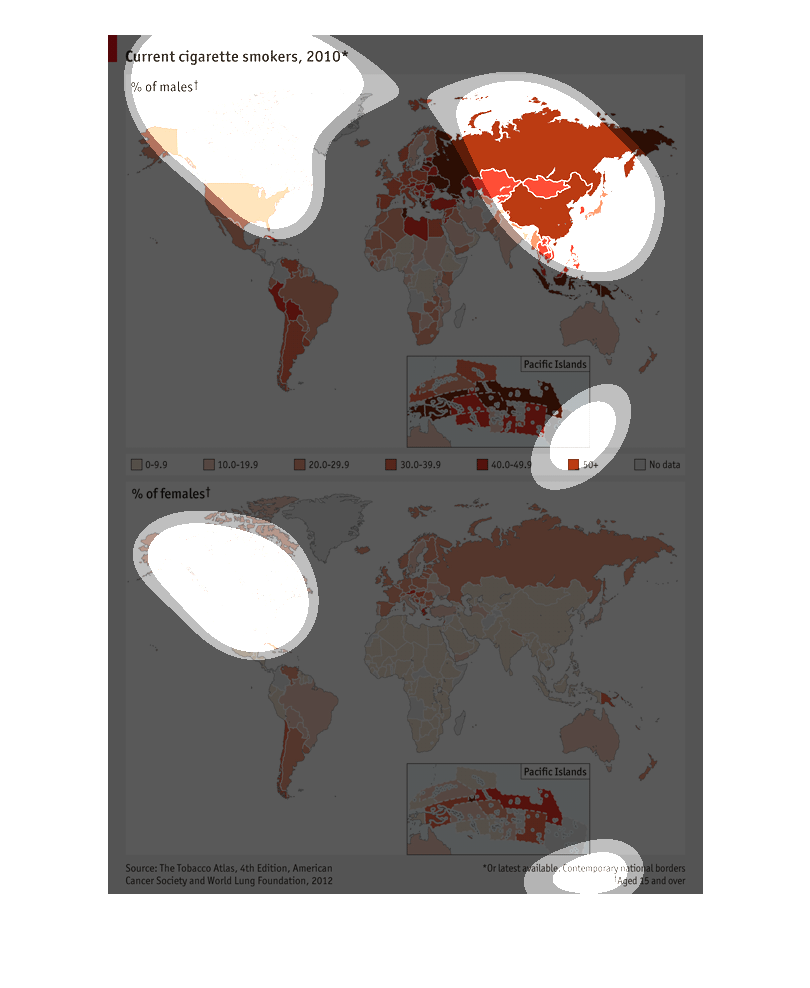
This graphic depicts the total number of cigarette smokers by world region in 2010.  Russia
shows a very high percentage of the population still smoking cigarettes.  Other notably high
percentages are found in some pacific islands, and parts of central and south america.  Generally,
a smaller percentage of women are smoking than men.
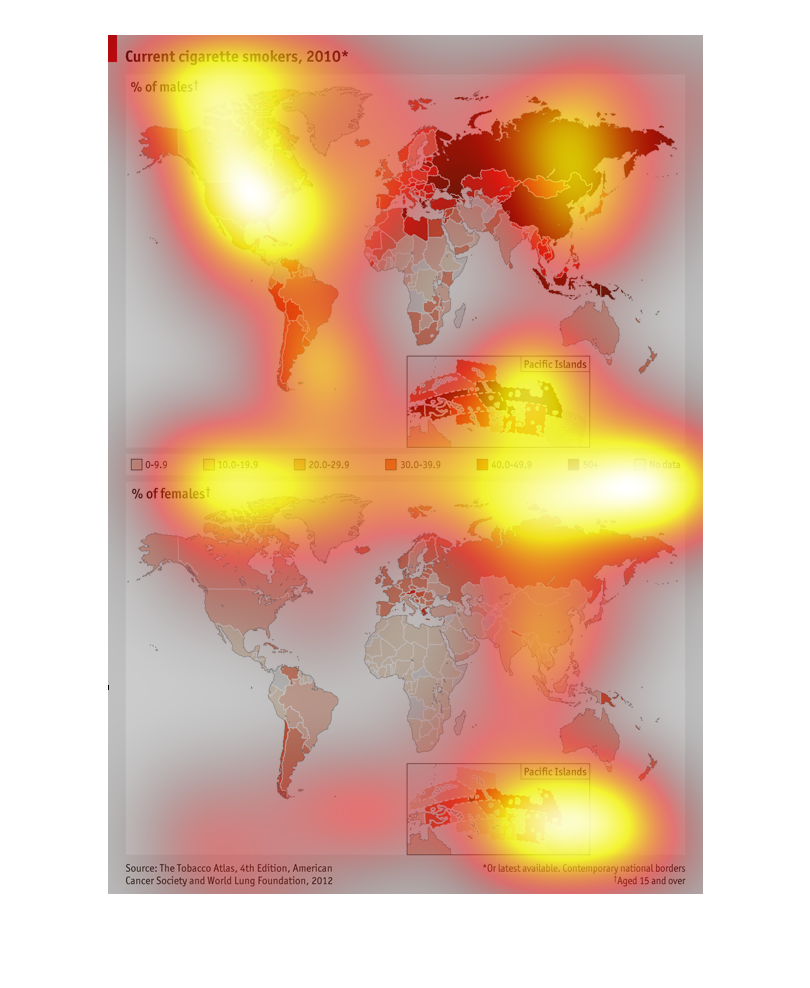
This graph shows the percentage of smokers in 2010. The top chart shows men and the bottom
shows women. The darker the color shading in the country, the higher the percentage. Eastern
Europe and Asia seem to contain the highest percentage of smokers.
This graph describes and depicts the total and current male and female cigarette smokers regionally
and globally across the face of the planet in several countries.