This is a graph of the U.S. federal corruption convictions, and the top states on the list
The District of Columbia is at the top, follwed by Loisiana, and then others.
This graph shows the United States corruption convictions in different states. It shows the
top states and how many total convictions each has compared to the rest.
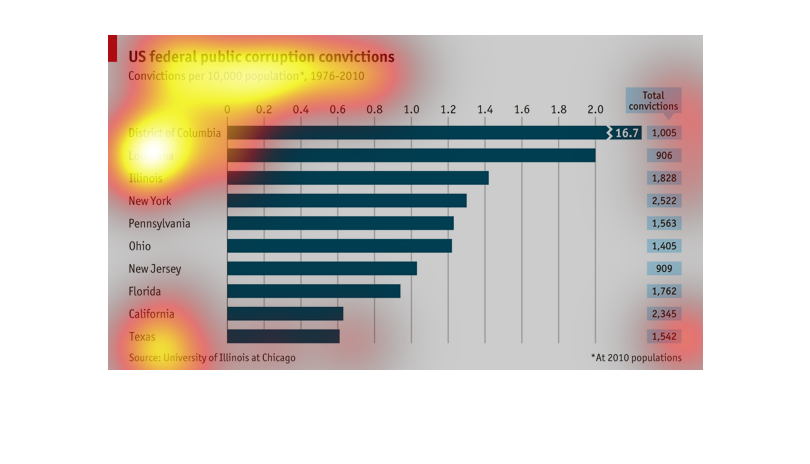
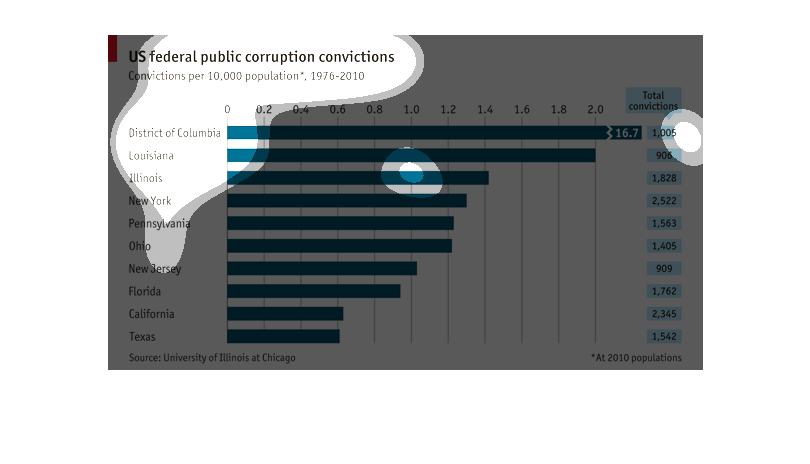
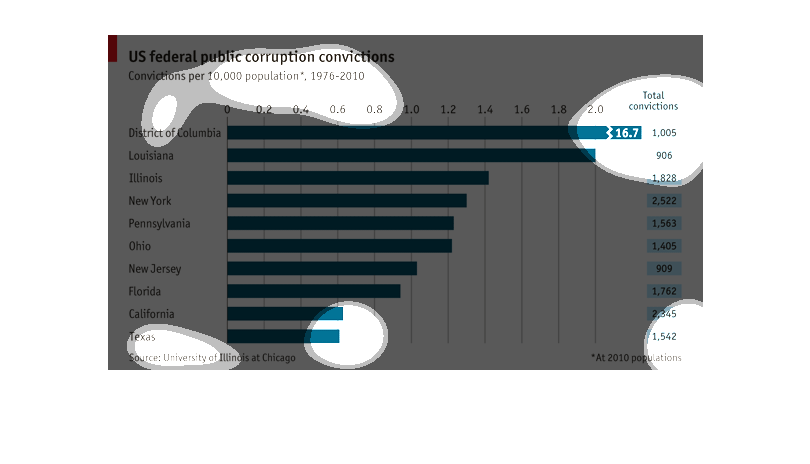
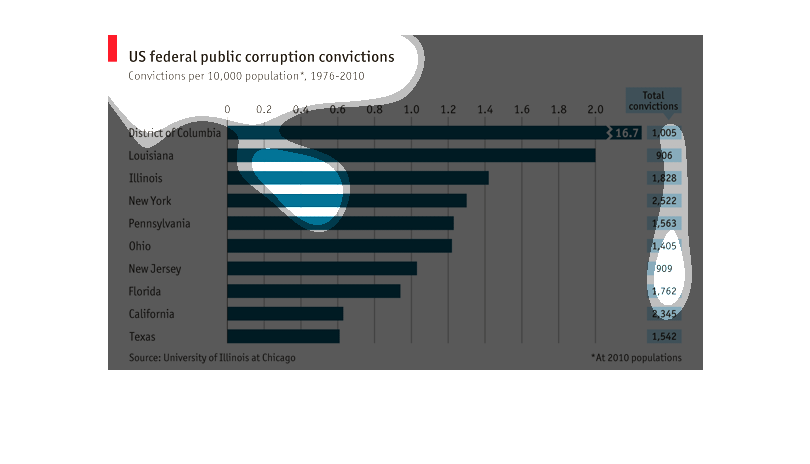
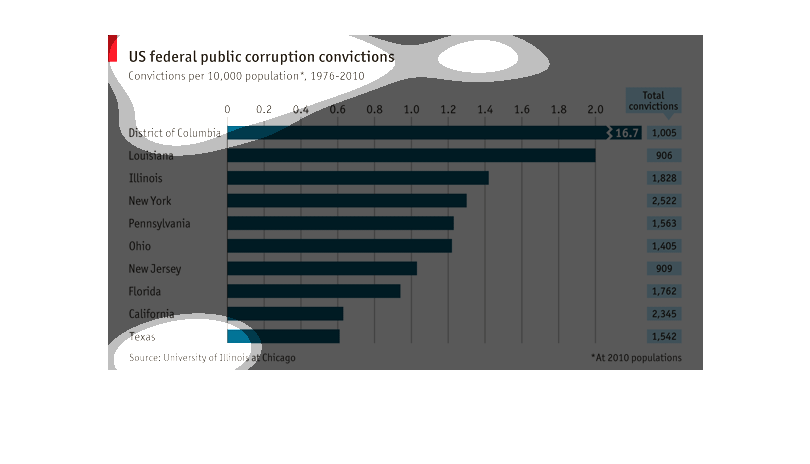
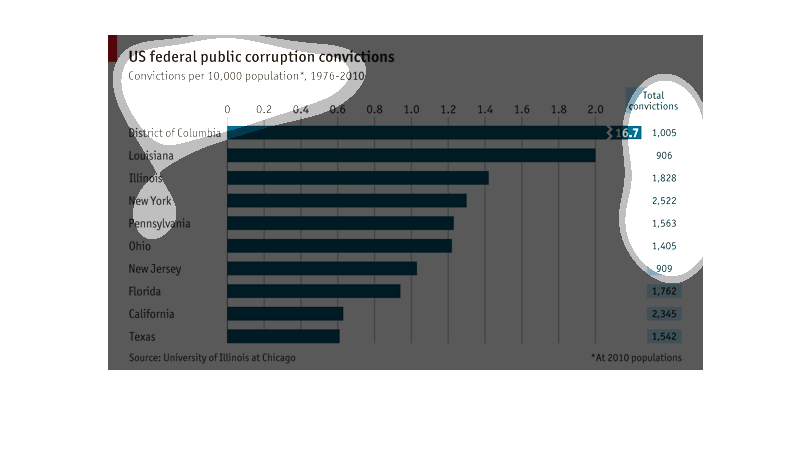
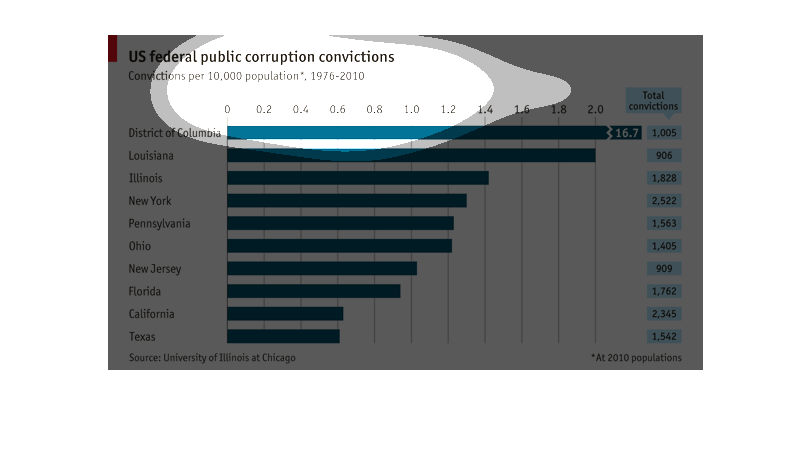
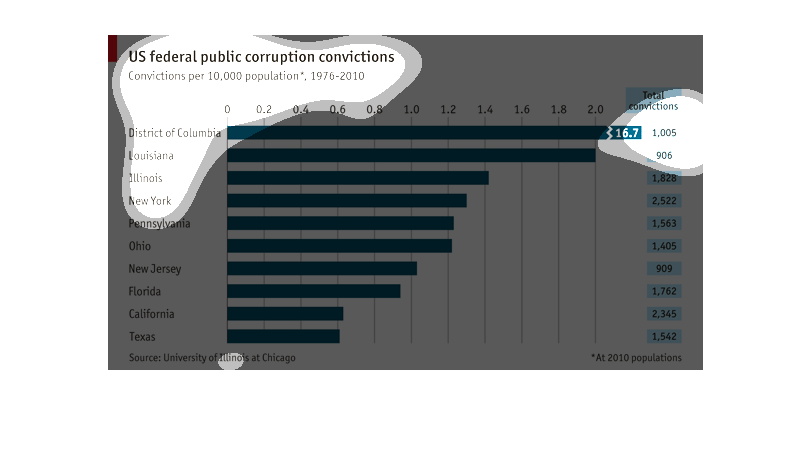
This bar graph represents the US federal public corruption convictions from 1976 to 2010.
The convictions are per 10,000 people, which the District of Columbia having the highest total
number of convictions at 16.7 and 1,005 total convictions. The lowest in rate was in Texas
with slightly above 0.6 corruption convictions per 10,000 people 1,542 total convictions.
This data was extrapolated by the University of Illinois at Chicago.
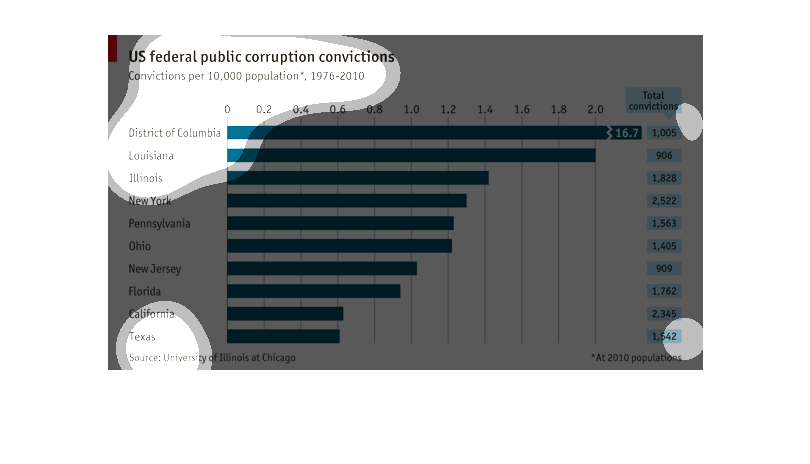
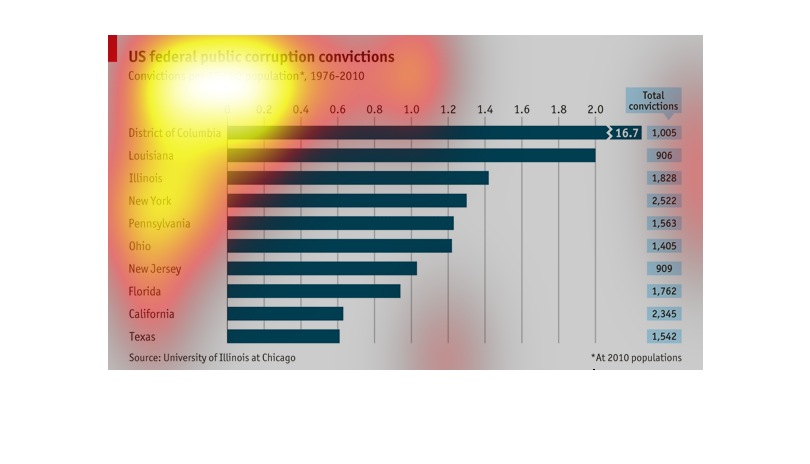
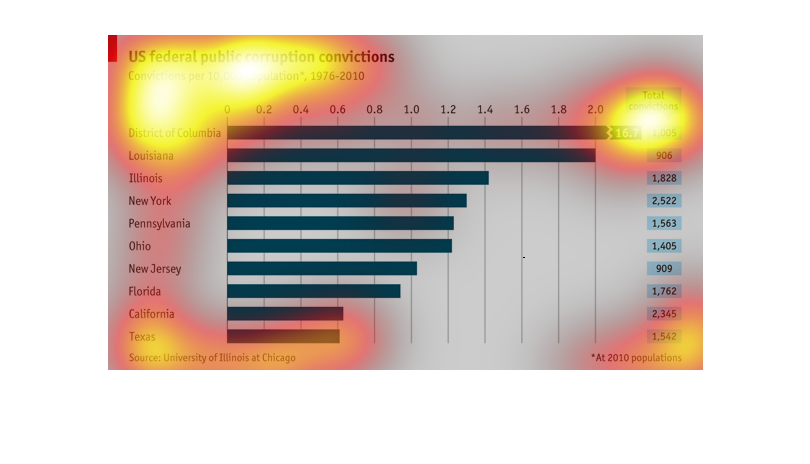
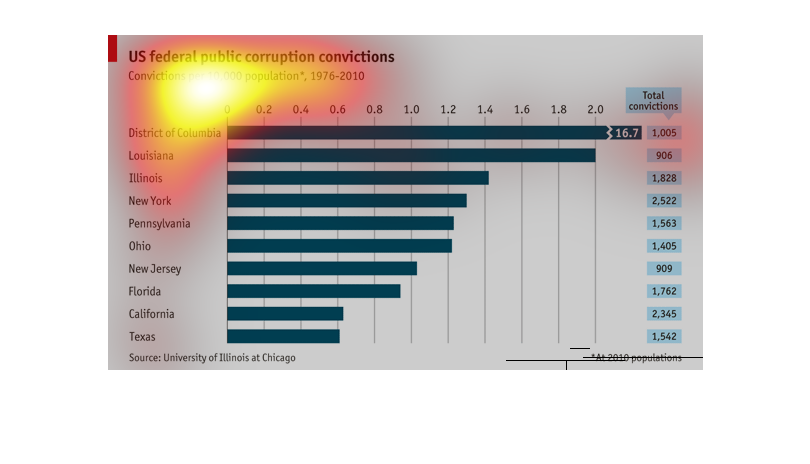
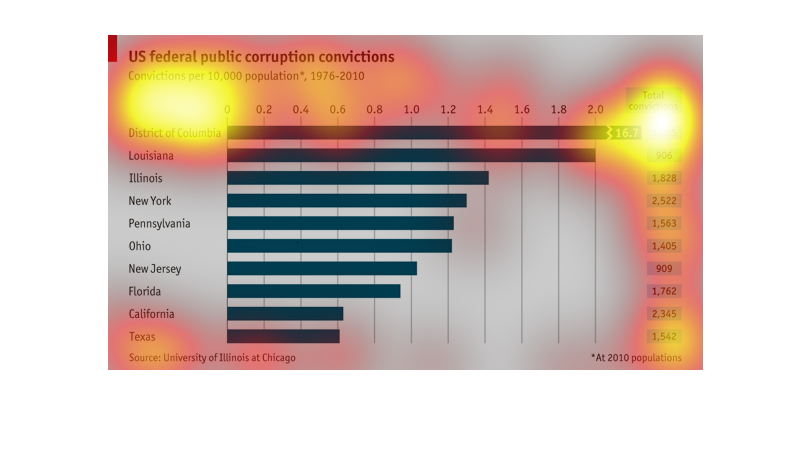
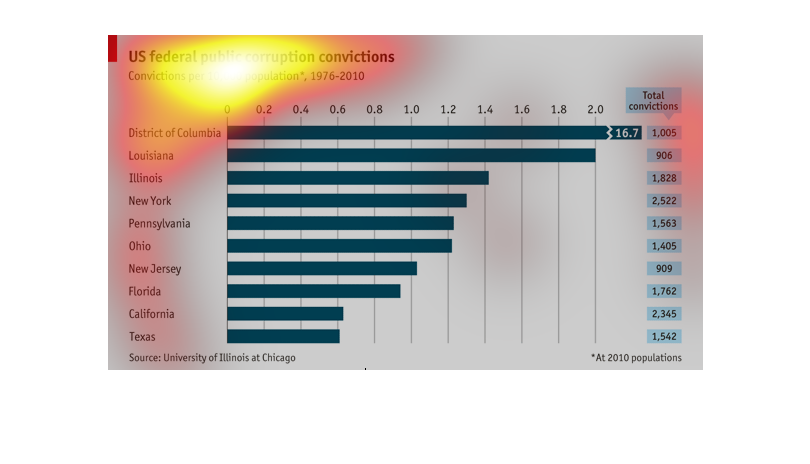
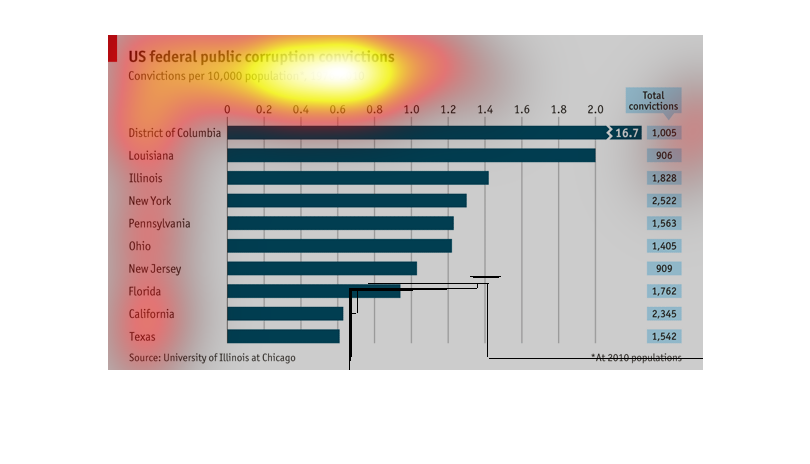
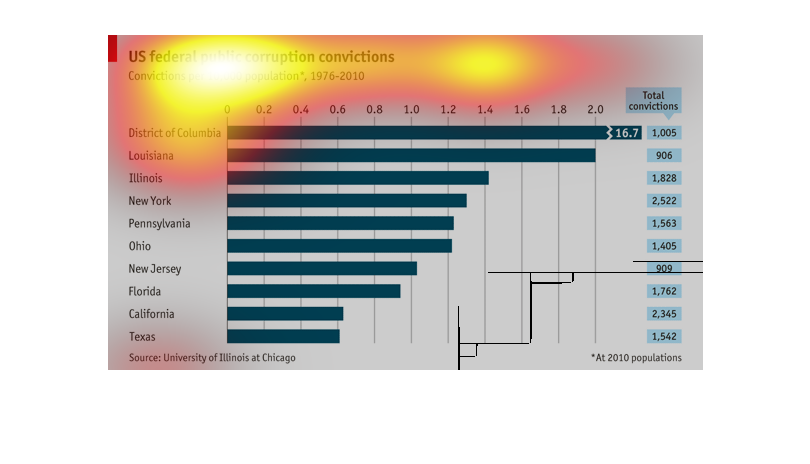
The chart covers US public corruption convictions per 10,000 population between 1976 and 2010.
 Texas has the least amount of convictions while the District of Columbia has the most.  The
study was done by the Unversity of Illinois at Chicago.
The US federal public corruption convictions a bar graph of some of the states in the USA.
The District of Columbia seems to have the highest amount of criminal convictions compared
to the other sttaes
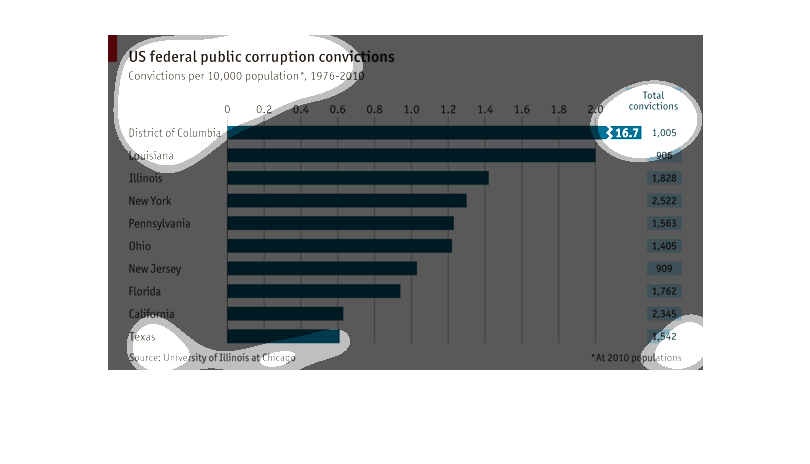
This chart that displays US federal public corruption convictions from 1976-2010. Convictions
per 10,000 population are shown. Texas had the lowest number of convictions on the list and
Washington, D.C. the most.
This is an image for US federal public corruption convictions. The District of Columbia is
shown to have the most convictions while Texas is shown to have the least convictions.
The chart displays US federal public corruption convictions, the district of Columbia has
the highest amount of convictions whereas Texas has the lowest amount of convictions.
This chart shows the relationship between the US federal public corruption convictions and
different US Districts or States from 1976 to 2010. According to the chart New York has the
highest total convictions.
Number of convictions for public corruption out of 10,000 people. These are on the Federal
Level number one out of all these regions was the District of Columbia. Next highest was Louisiana.
This graph is a graph of US federal public corruption convictions, from 1976 through 2010.
The graph shows the number of convictions per 10,000 population throughout the above year-range.
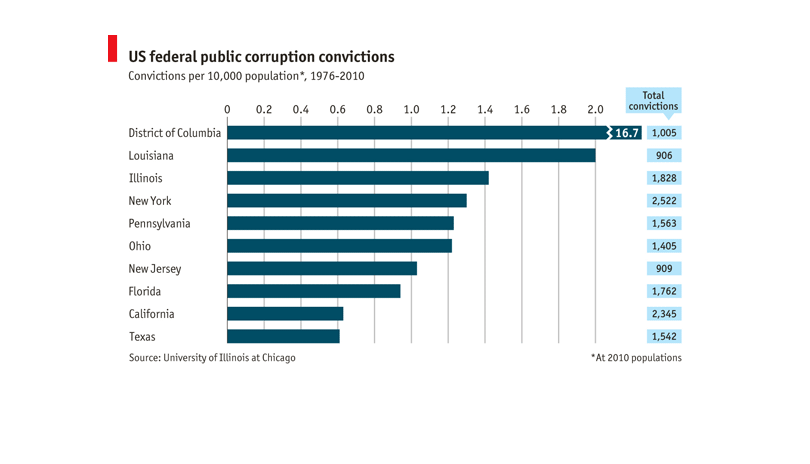
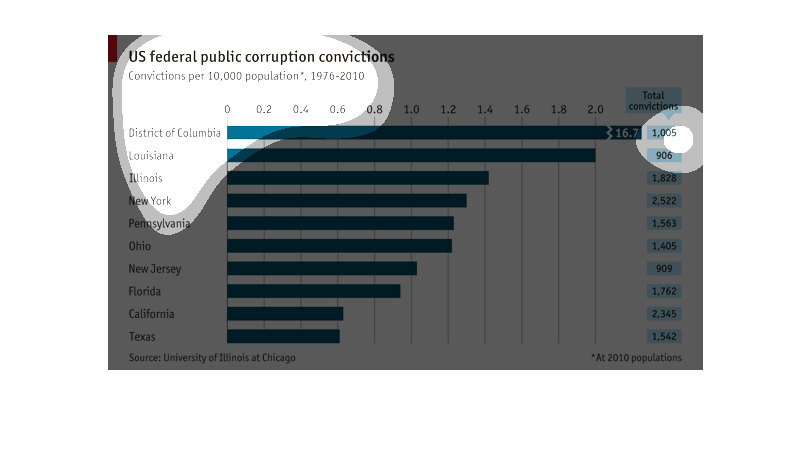
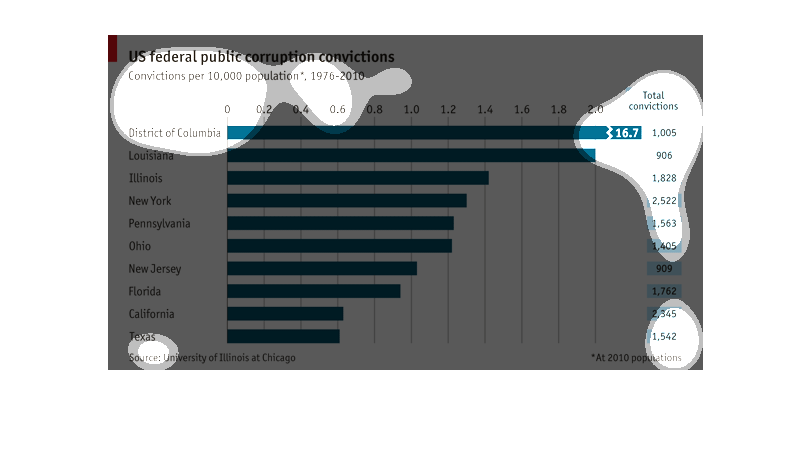
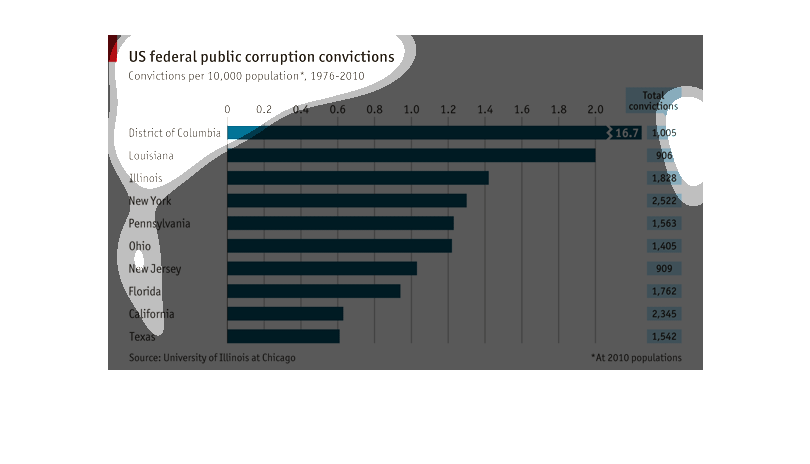
This is a graph of US federal public corruptions.  Available states listed are DC, Louisiana,
Illinois, NY, Pennsylvania, Ohio, New Jersey, Florida, California, Texas. The right side lists
vertically total number of convictions for each state from 1976-2010. DC  has the highest
amount, Texas the lowest.
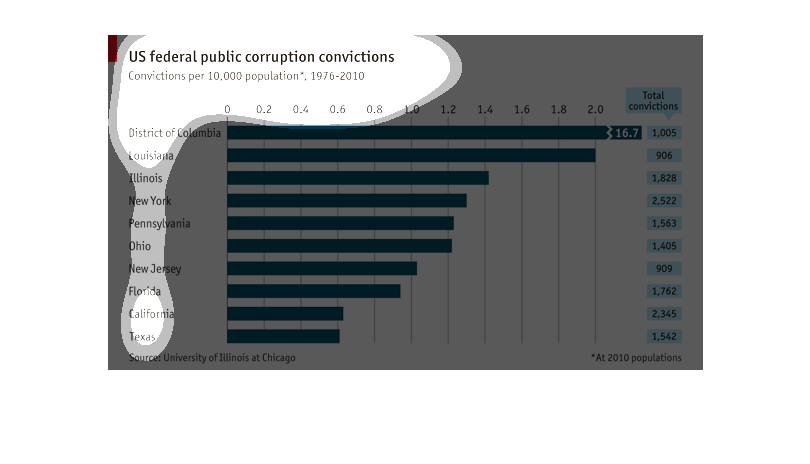
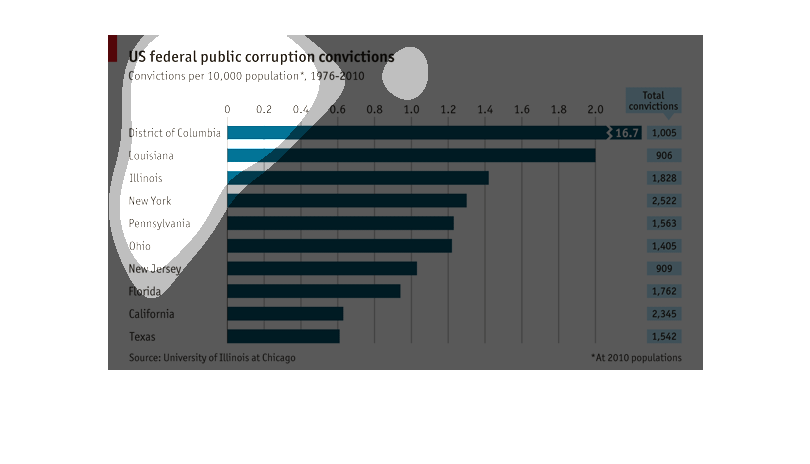
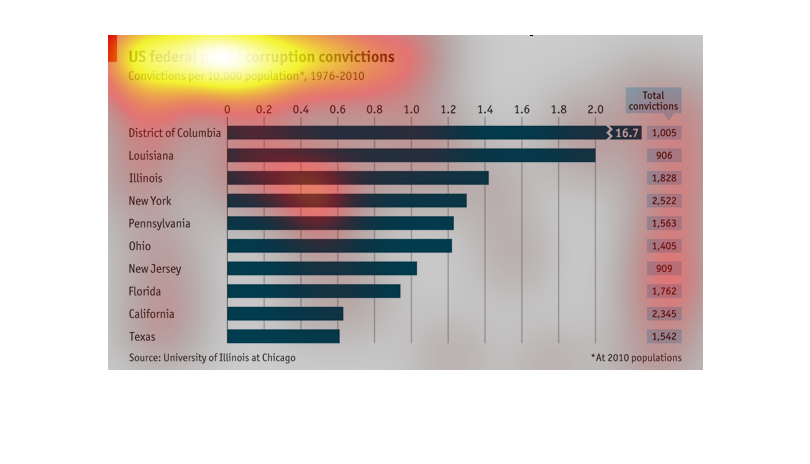
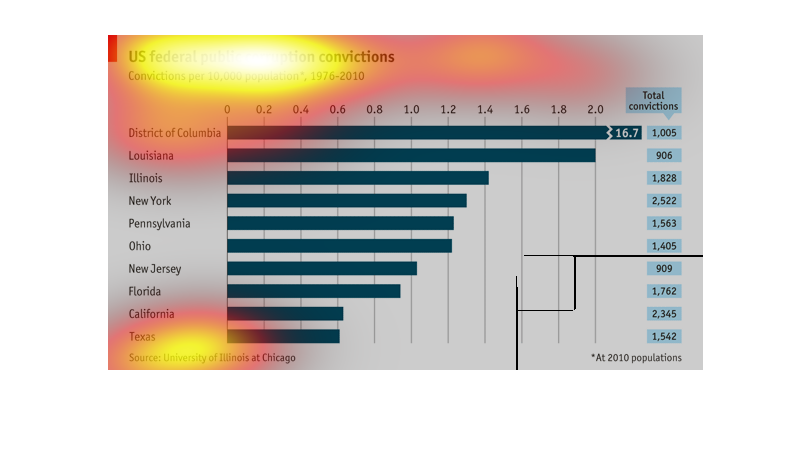
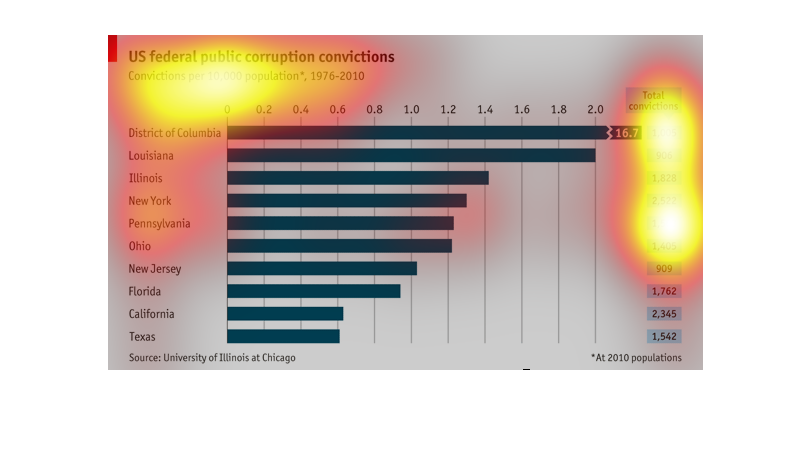
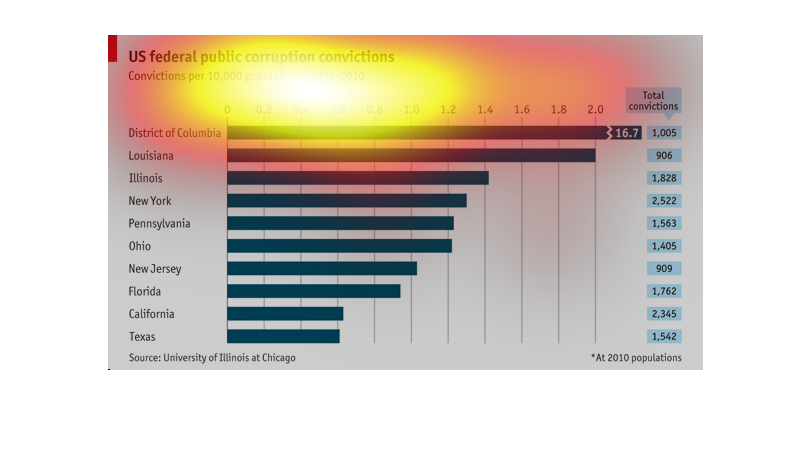
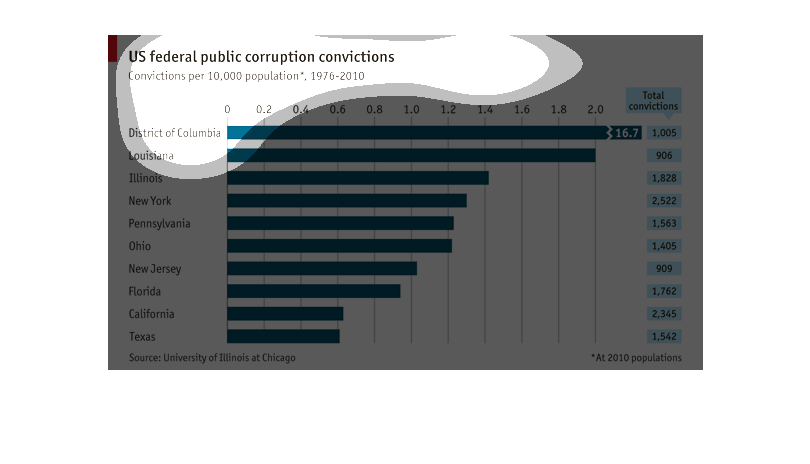
This chart shows political federal and public convictions from 1976-2010 per 10,000 population.
The District of Columbia shows the highest convictions per 10,000 population while Texas shows
the lowest. Large states like New York, Illinois and Louisiana show high rates as well.
This chart shows the number of Federal corruption convictions from 1976 to 2010 by area. The
area with the most was the District of Columbia and the area with the least was Texas.
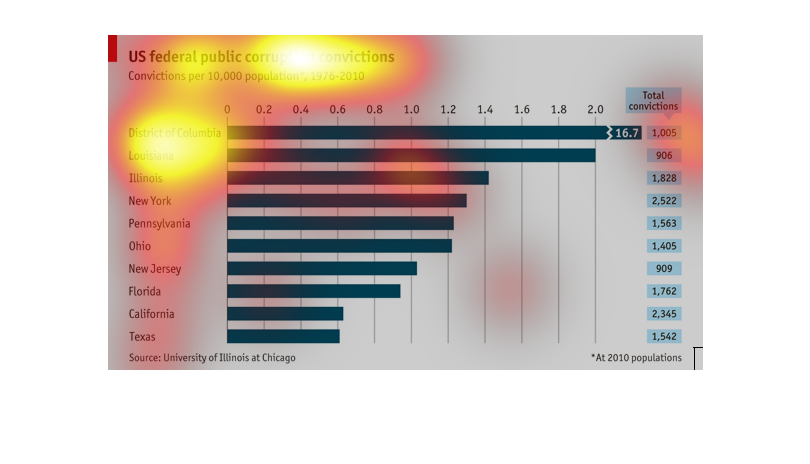
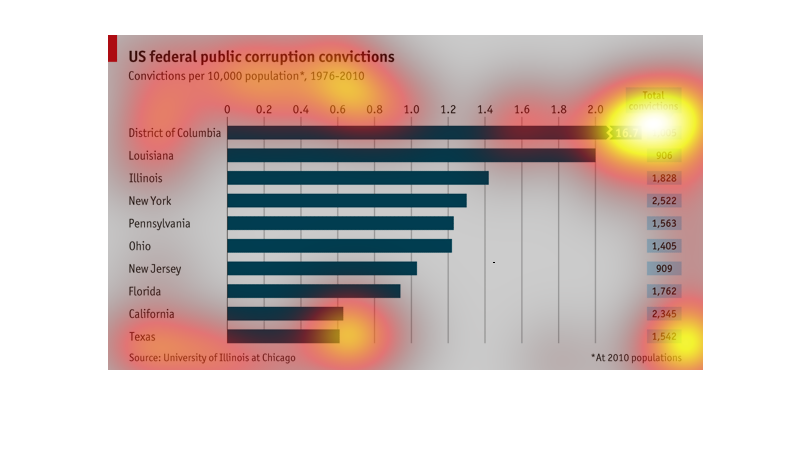
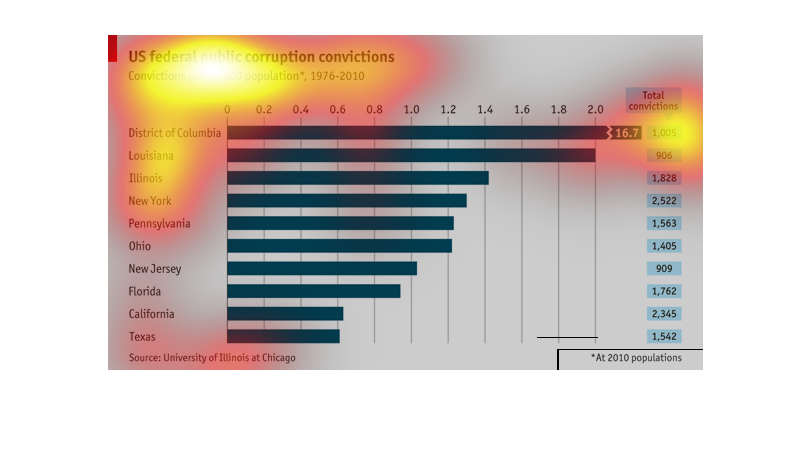
This shows federal corruption convictions in the US from 1976-2010, comparing several states.
The lowest are Texas and California at 1,542-2,345/10,000. The highest, unsurprisingly, is
in DC, at 1,005/10,000. Second and third highest are Louisiana and Illinois, predictably.