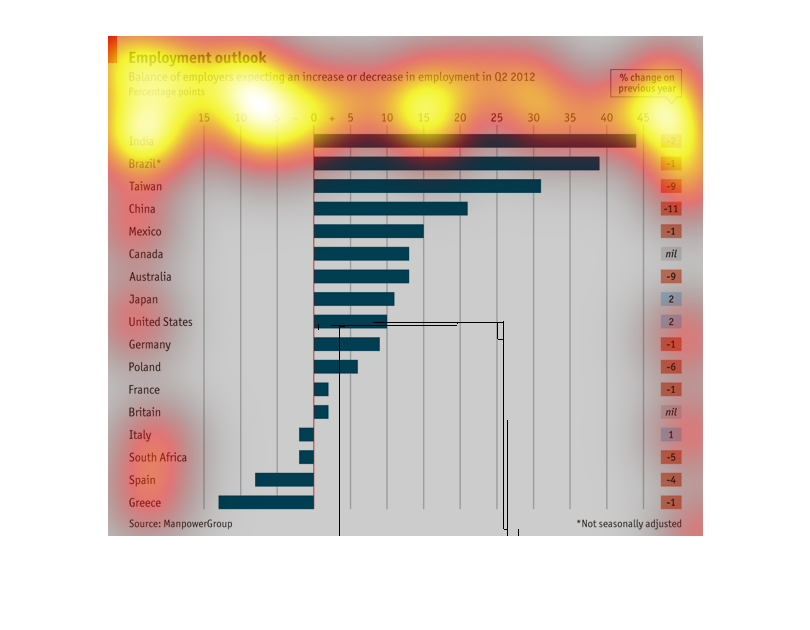
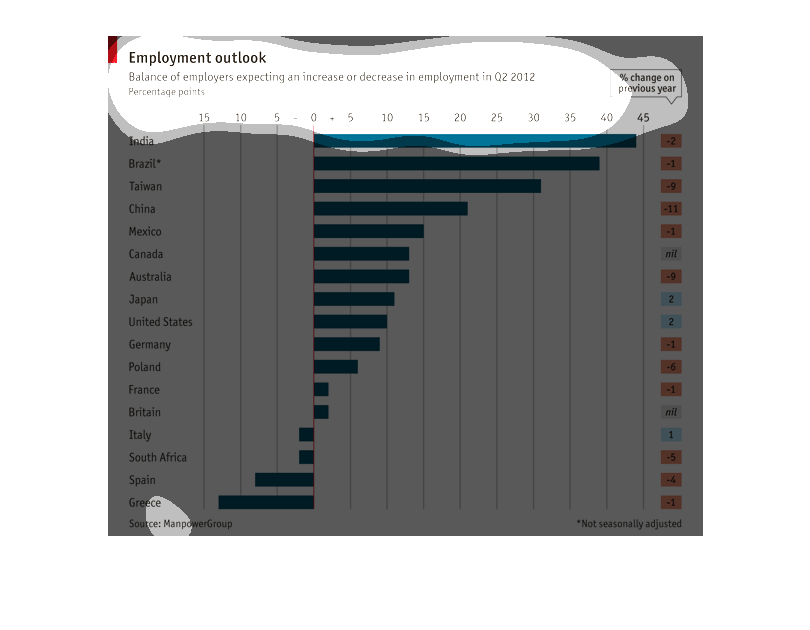
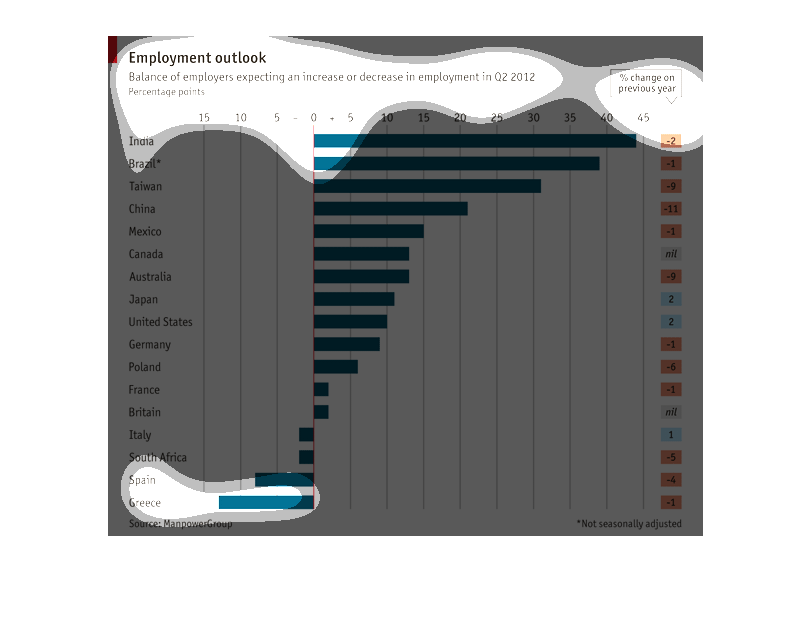
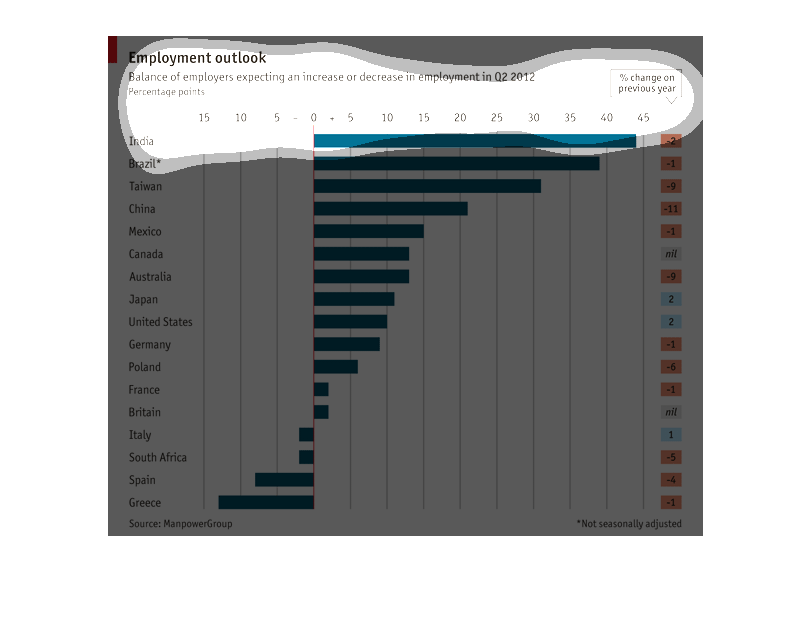
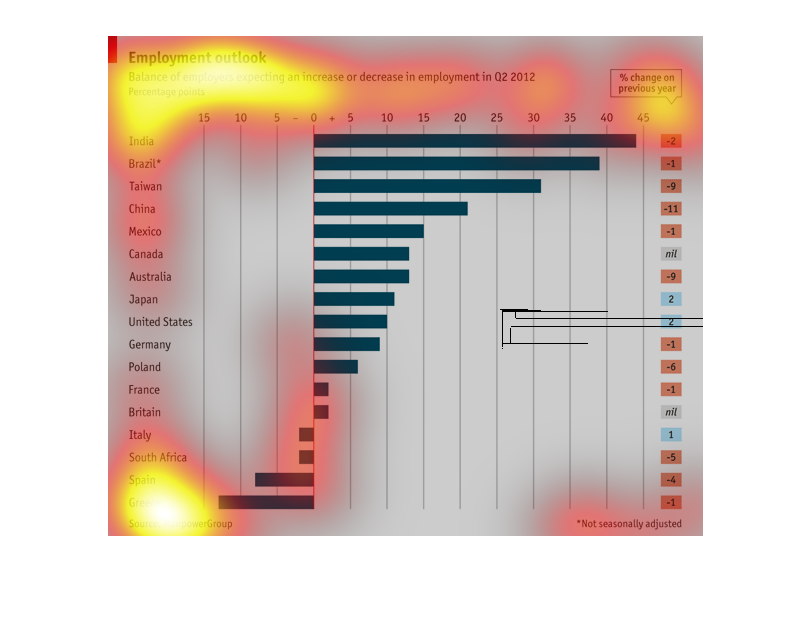
This chart depicts the employee outlook by showing the balance of employers expecting an increase
or decrease in employment in several different countries.
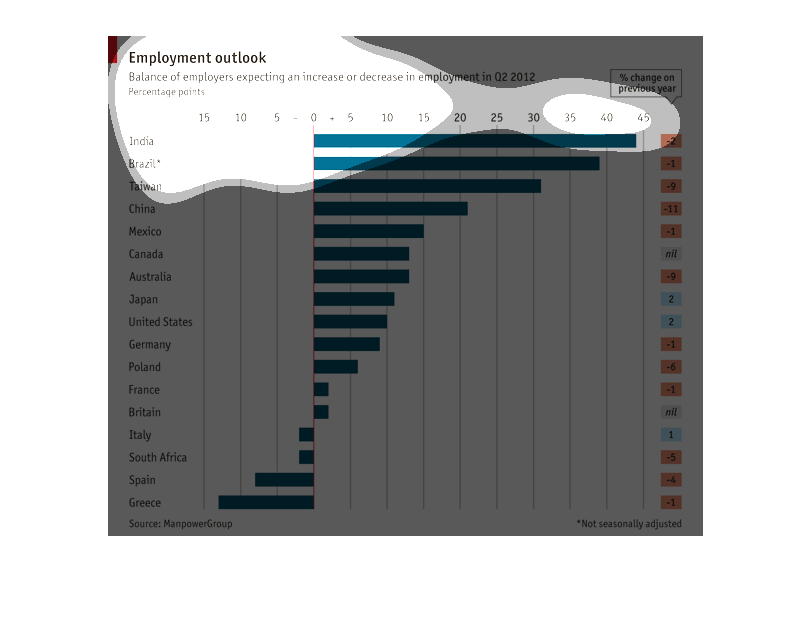
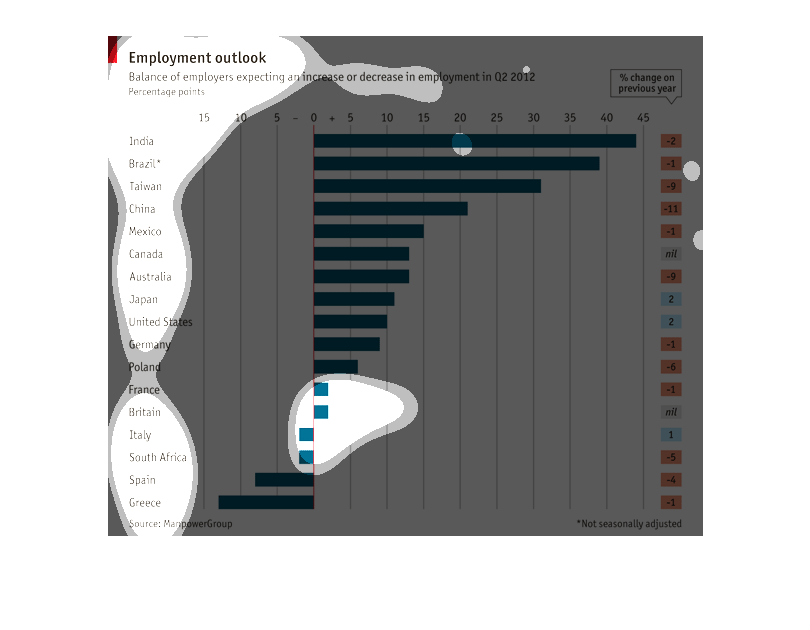
This shows the expected change in employment rates by country. India has the best looking
outcome and us is twards the middle. It looks like the countries in the U.K. Have the worst
negative outlook
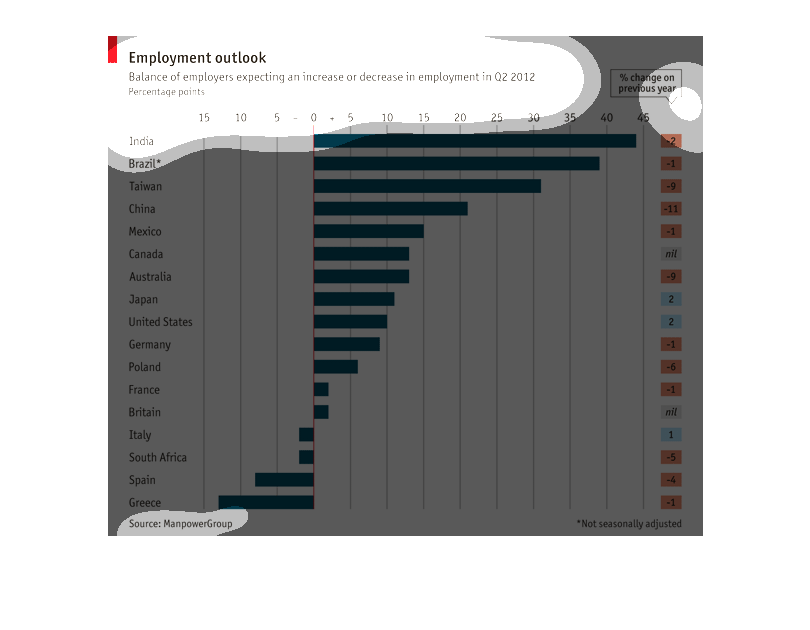
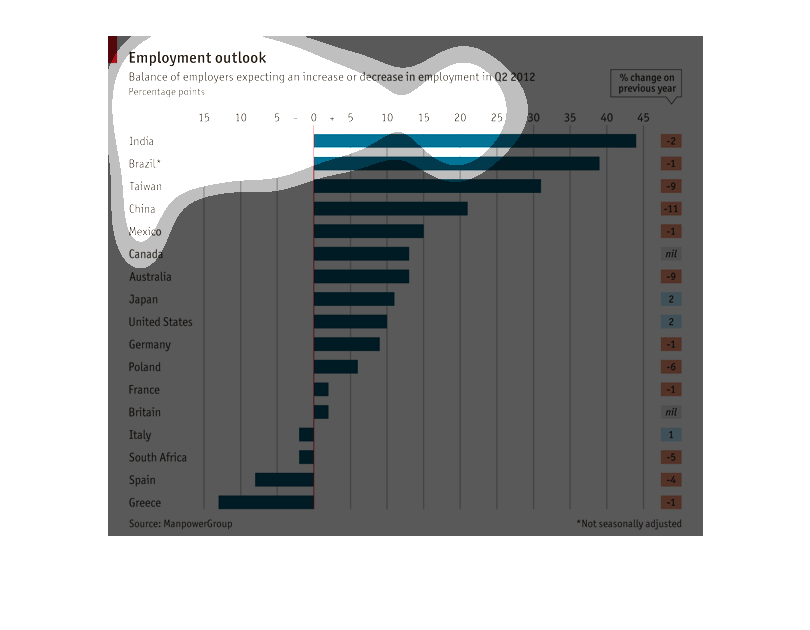
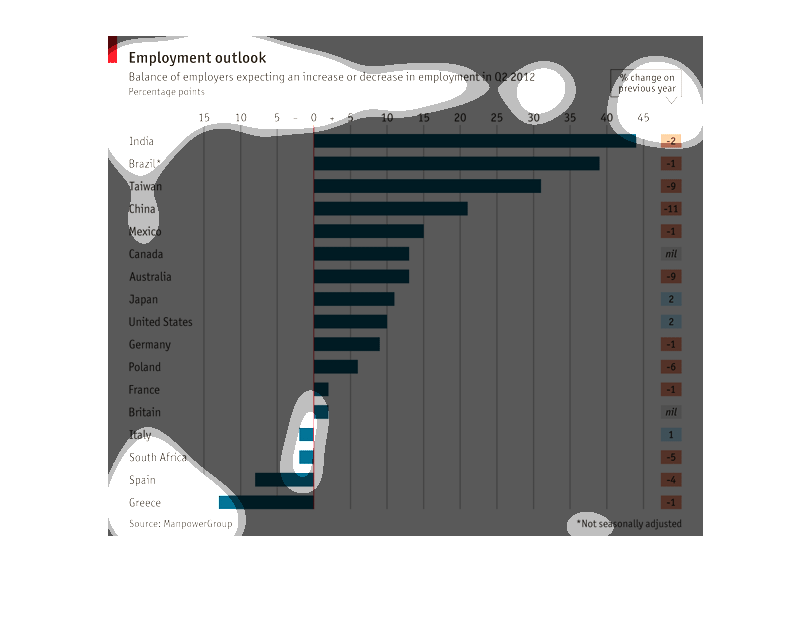
This graph, entitled "Employment Outlook" looks at "Balance of employers expecting an increase
or decrease in employment in 02 2012" based on percentage points.  It is looking at countries
and their expected change for this date.  On the right there is also a percentage of change
in the previous year.  It seems inconsistent with the expected changes.  The countries in
order from biggest expected increase to lowest are: India, Brazil, Taiwan, Mexico, Canada,
Australia, Japan, United States, Germany, Poland, France, Britain, Italy, South Africa, Spain,
and Greece.  Source is ManpowerGroup.
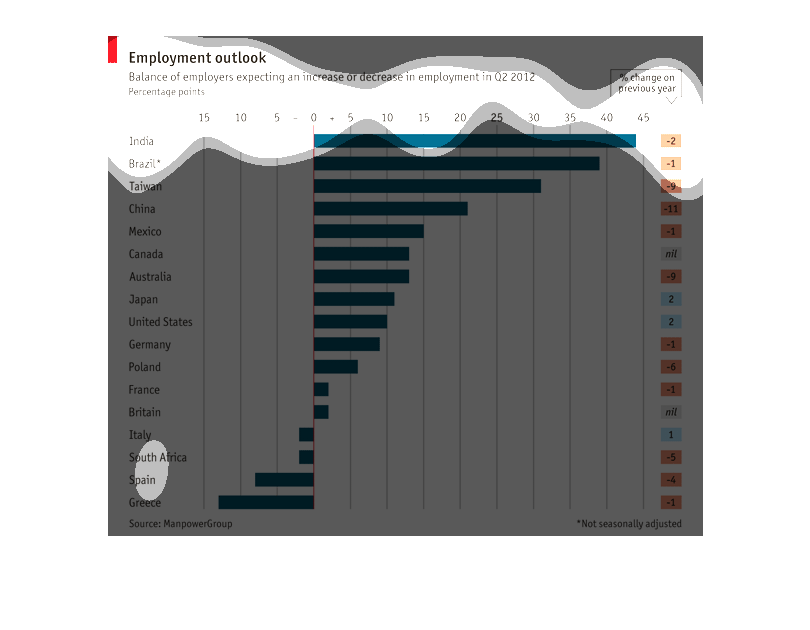
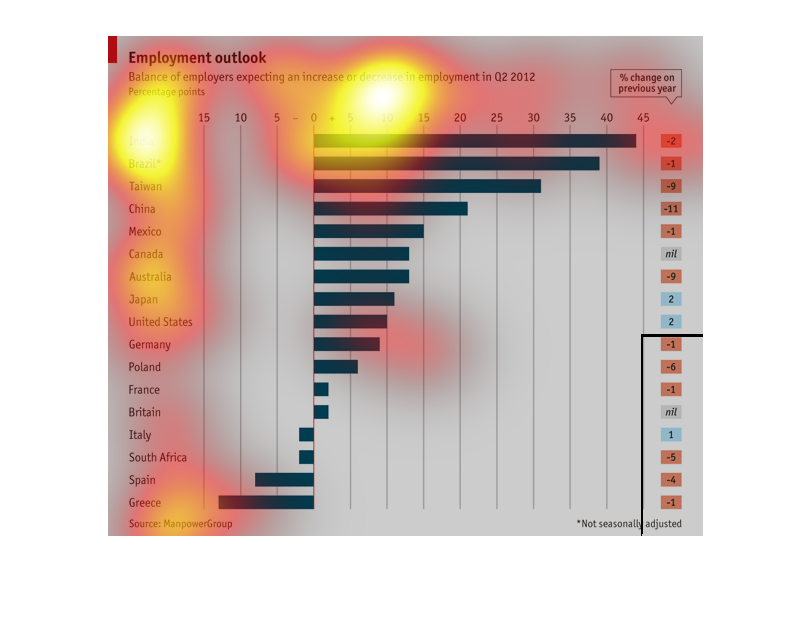
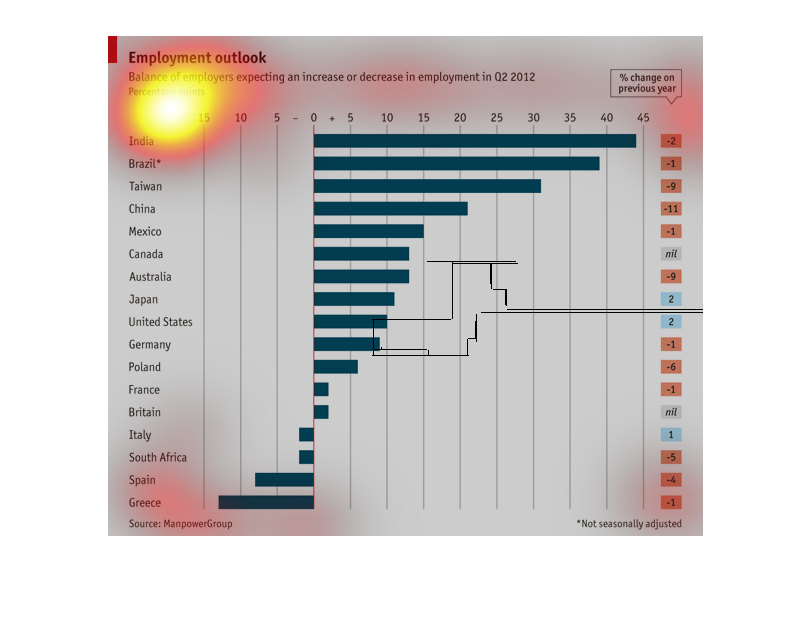
This image shows data on Employment Outlook, balance of employers expecting an increase of
decrease in employment in Q2 2012. It shows the comparison by country through the expected
percentage and a visual chart.
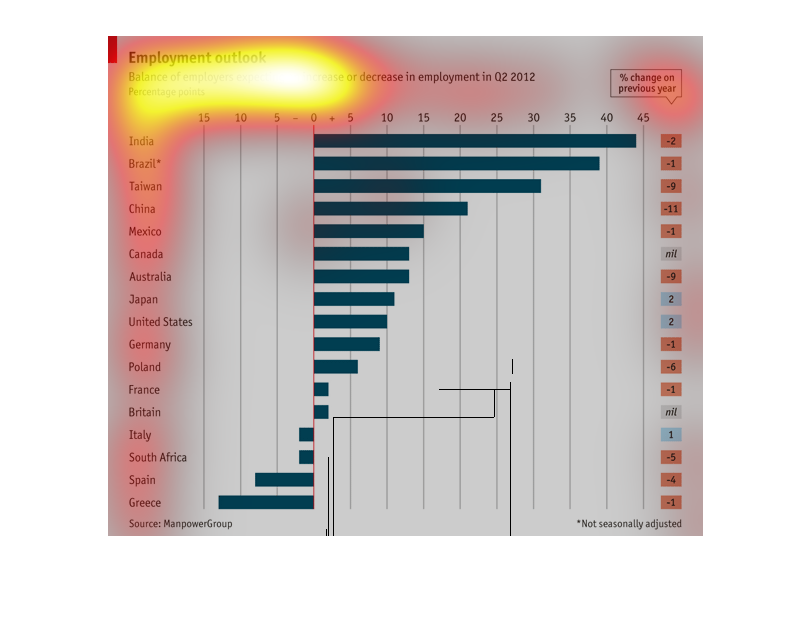
An employment outlook of employers for different countries expecting an increased or decreased
percentage of employment in the 2nd quarter of the year 2012.
This is a chart ranking Employment Outlook for several countries around the world. The chart
graphs Countries expecting either an increase or decrease in employment in Q2 2012.
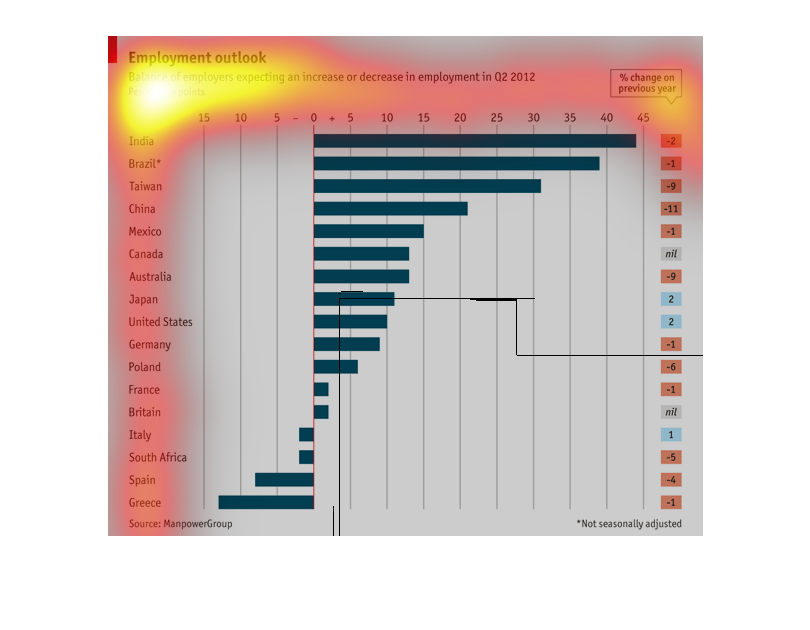
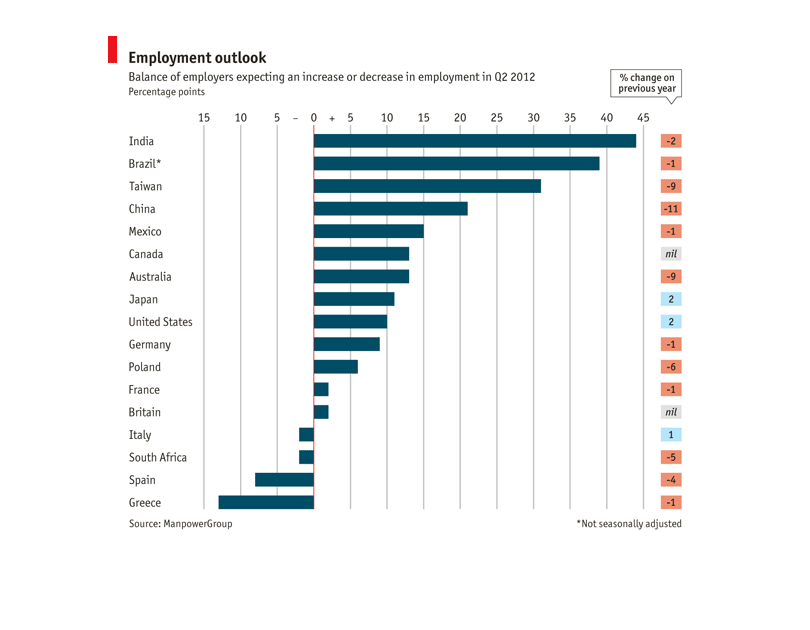
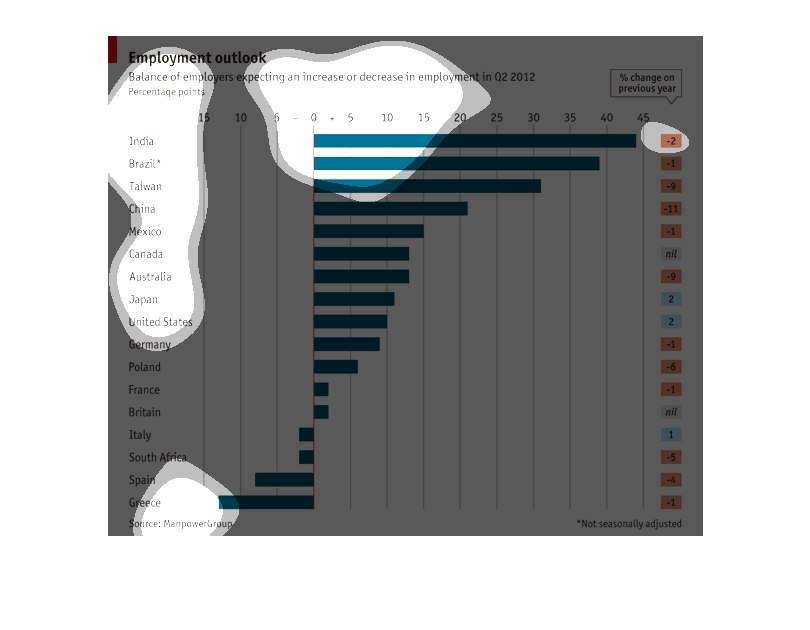
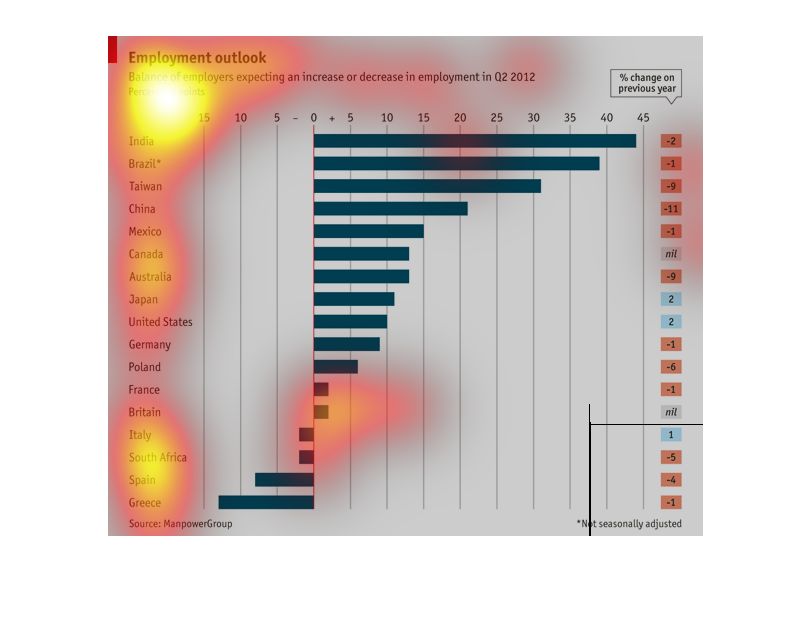
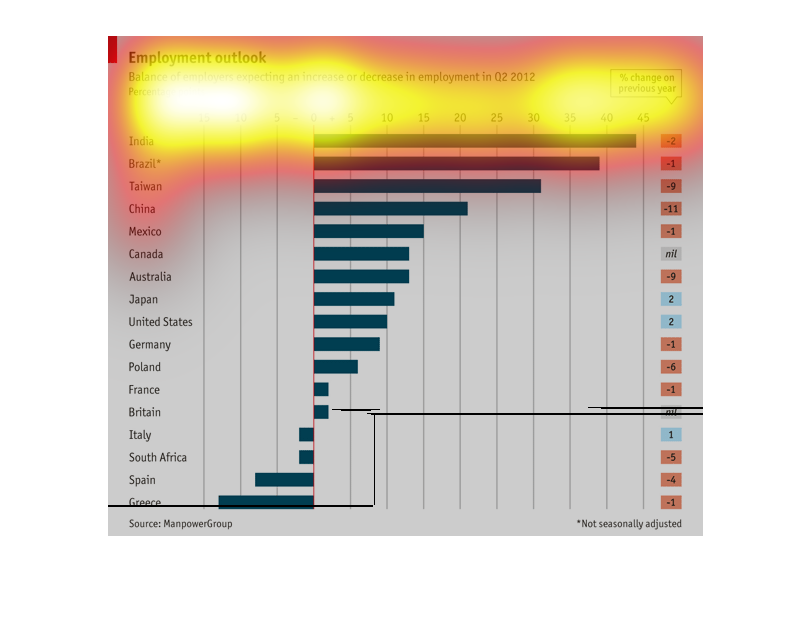
This graph shows the expected change in employment in various developed nations, as assumed
by employers. Countries in the European Union, whose economies are suffering currently, are
shown to have a decrease in expected employment whereas countries with developing or expanding
economies show the opposite result.
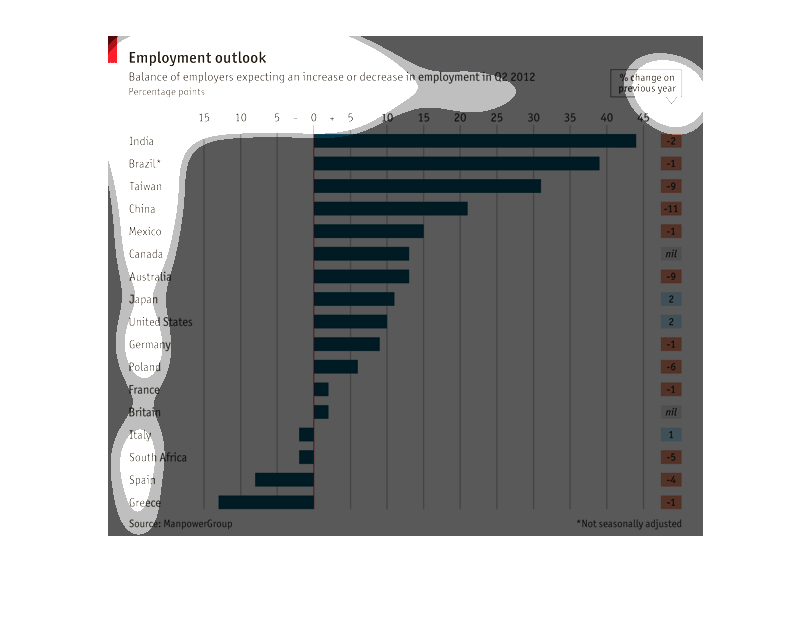
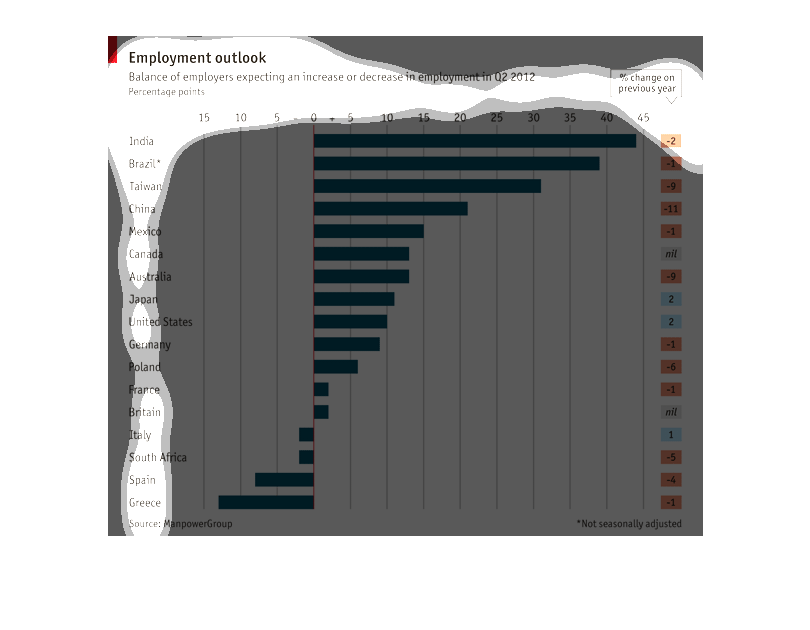
This graph shows the projected employment increase for businesses in 2012. Most countries
are projected to see at least some increase in employment, but Italy, South Africa, Spain,
and Greece are expected to see a decrease.
This is a chart for the employment outlook in 2012. Balance of employers expecting an increase
or decrease in employment are shown from highest to lowest.
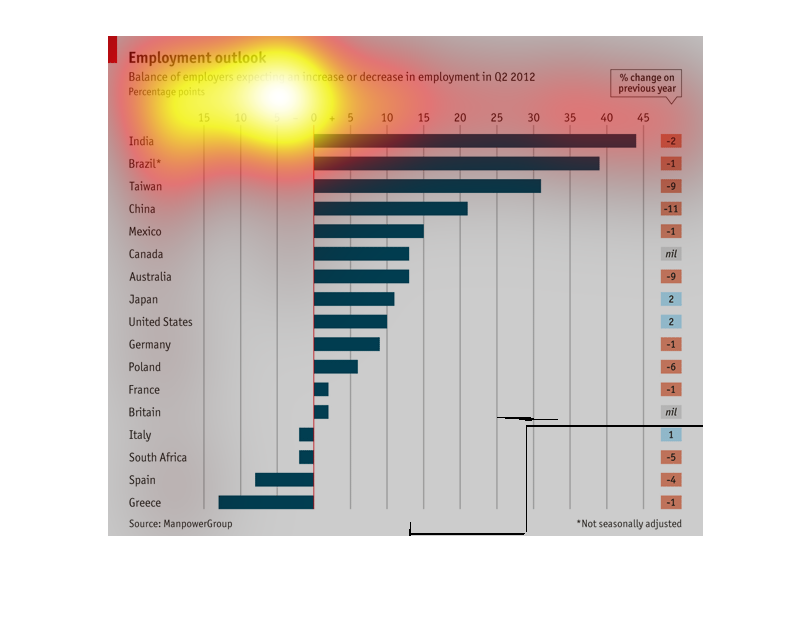
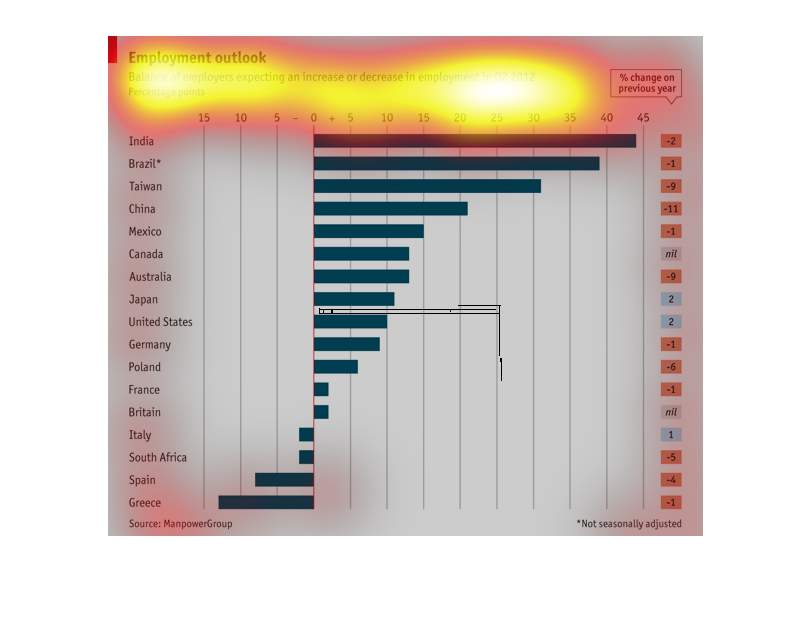
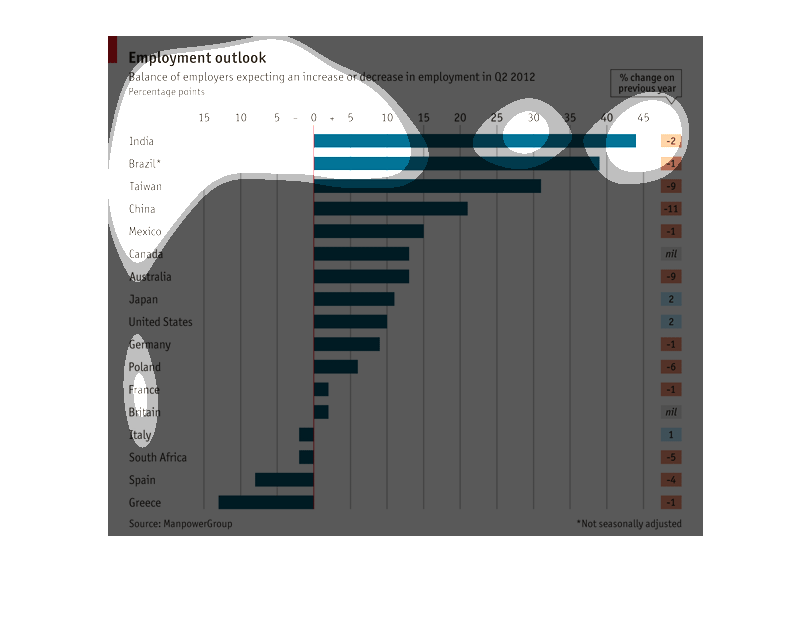
This chart describes the overall employment expectations regarding salary  increasing or decreasing
in the year 2012 in various countries across the world. India leads in the top position with
China not far behind. The United states is in the middle.

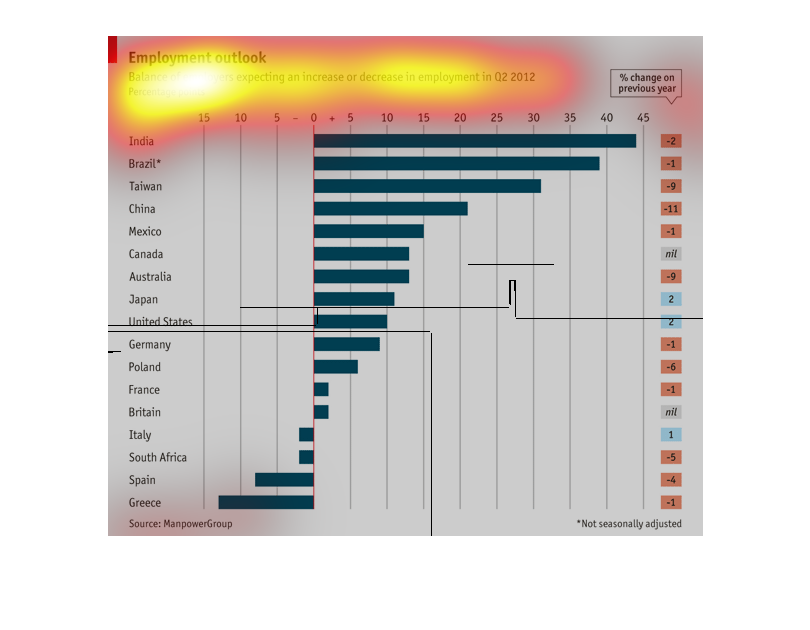
This chart shows he Employment outlook, and the balance of employers expecting an increase
of decrease in employment in 2012. Most of the countries listed on the chart are third world
countries.
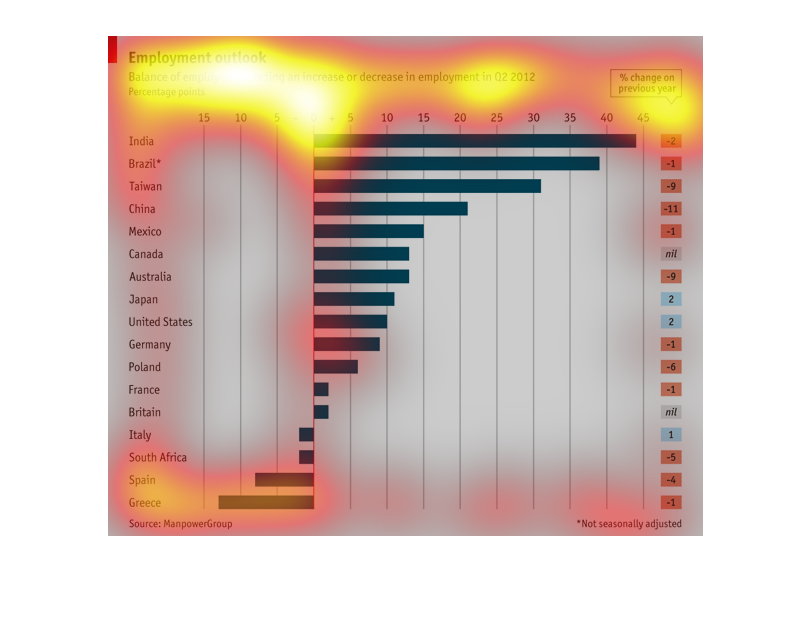
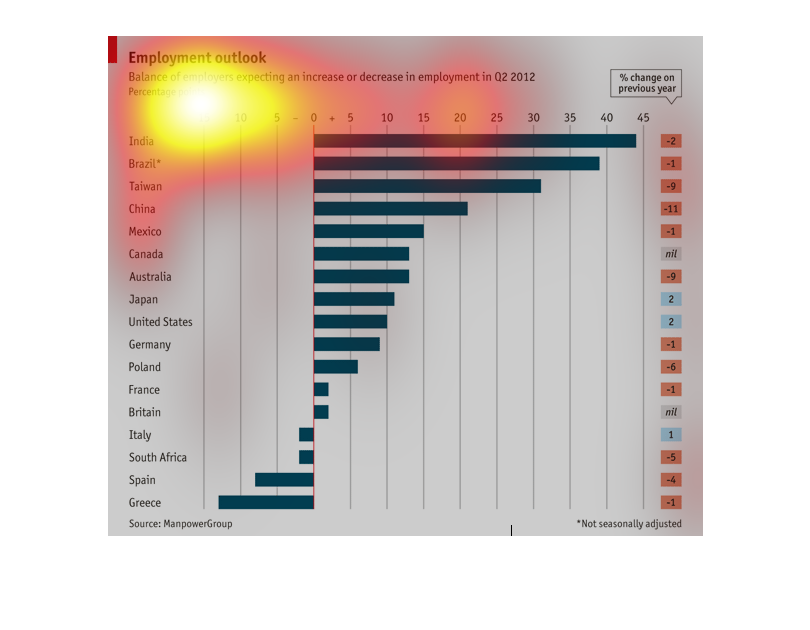
This is a graph of employment outlook for employers. India has the highest (with almost 45%),
while Greece is the lowest. There appear to be percentage changes on the right as well. There
are 4 countries looking at negative outlook. The graph focuses on Q2 in 2012.
Employment statistics for various countries from 2002 to 2012 adjusted seasonally ranged from
-15% to +45%. India was the +45% and Greece was the -15%.
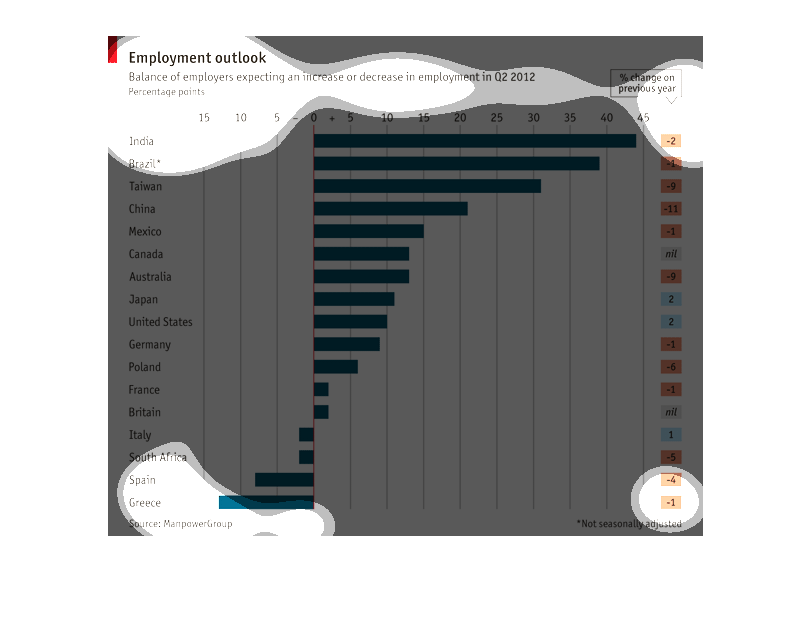
This graph depicts employment outlook. It shows employment trends expected according to employers.
It shows averages for multiple countries. The graph uses percentages to relay this information.