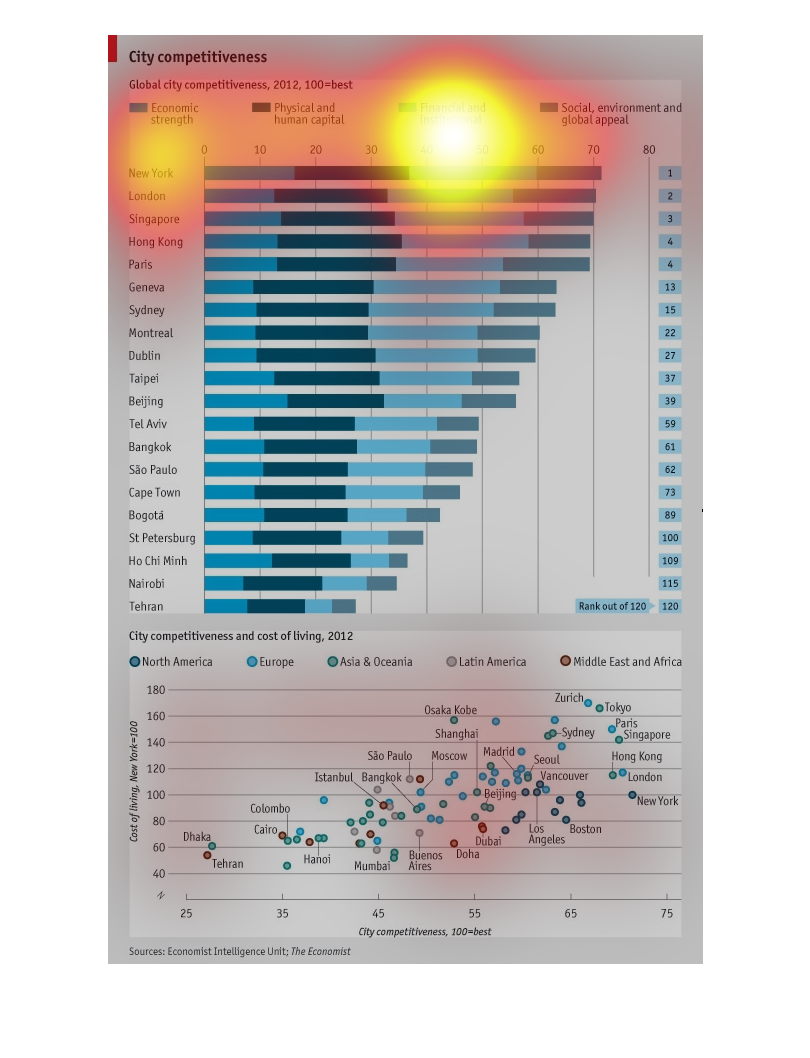
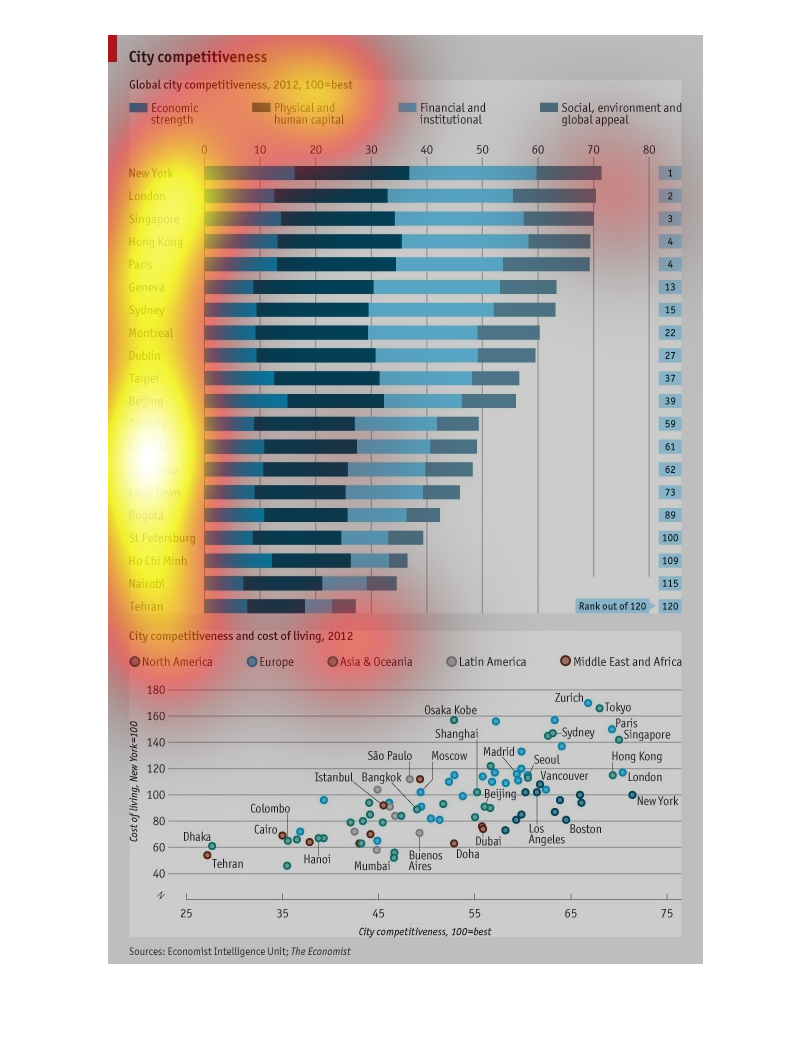
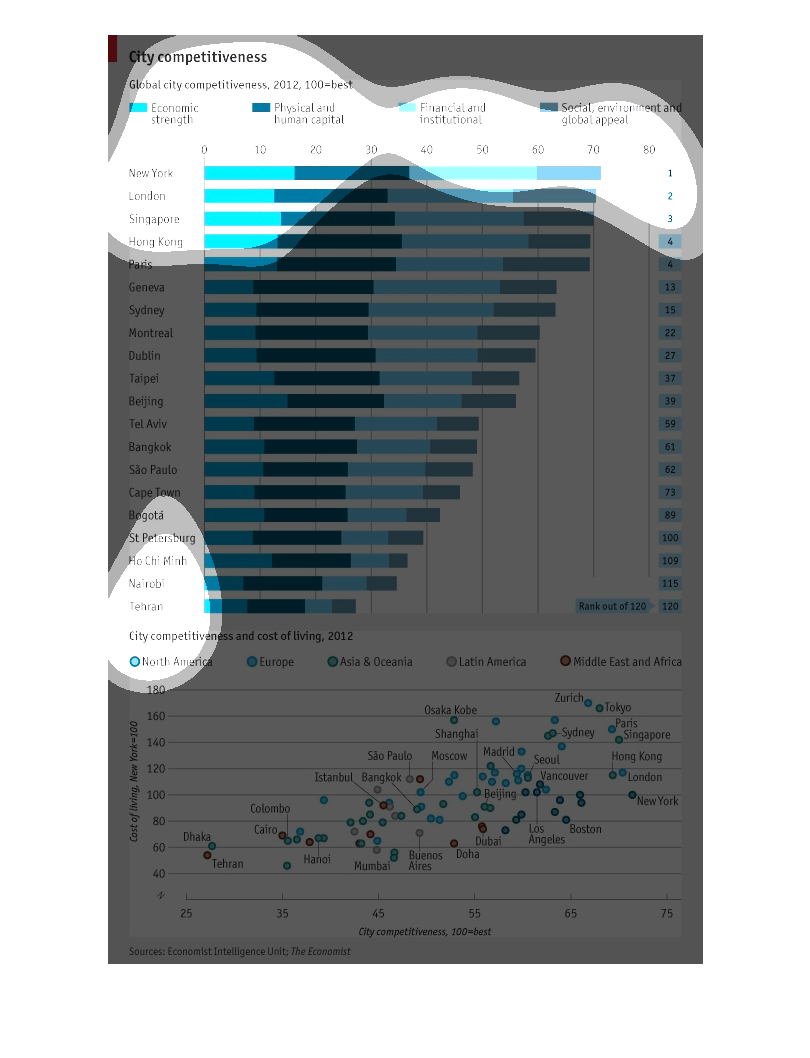
New York City has the strongest economic strength in comparison to other major international
cities. It's financial and institutional areas are also stronger
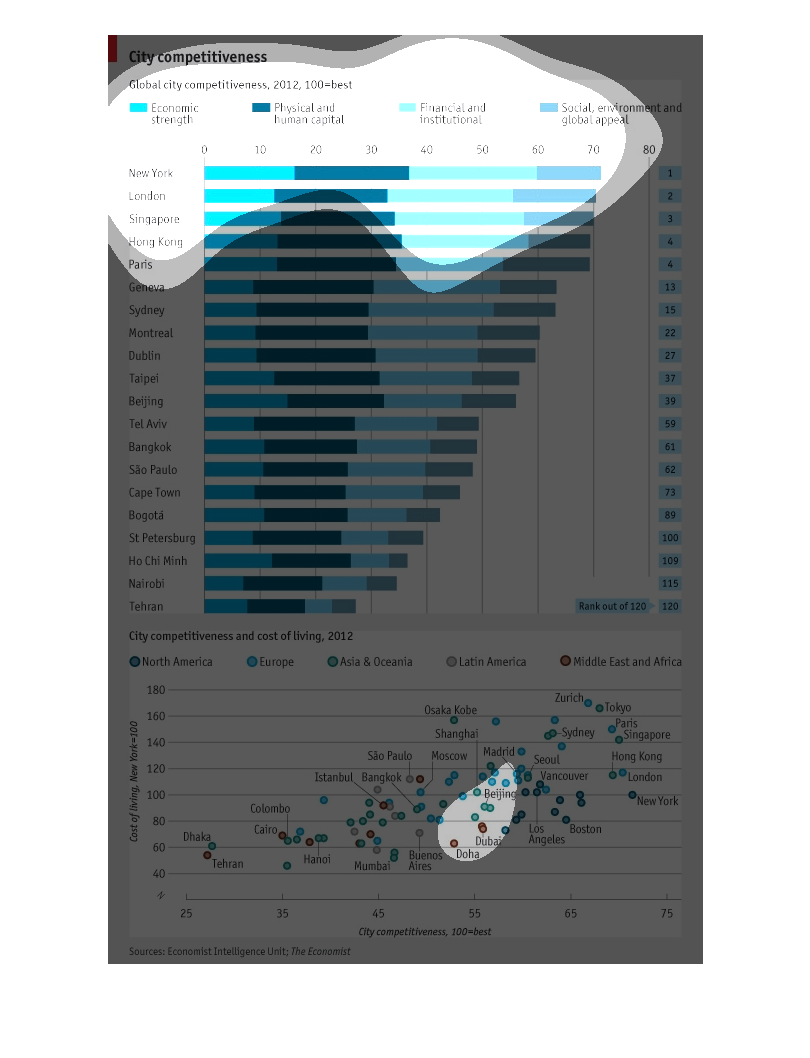
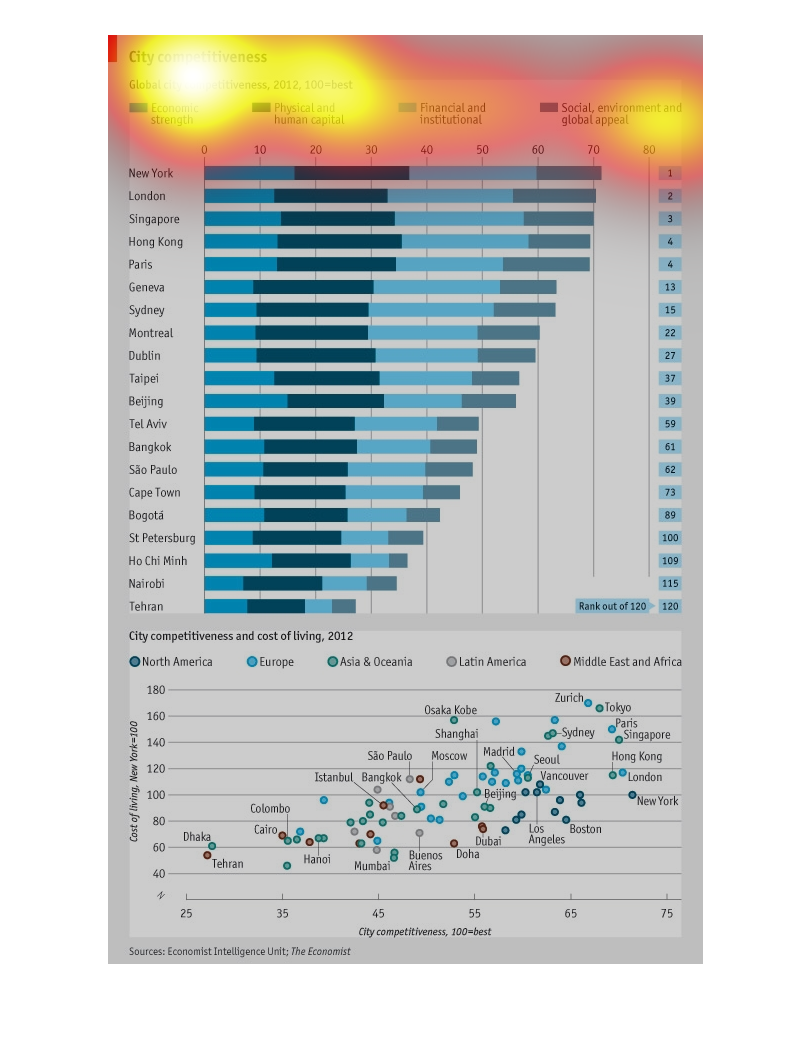
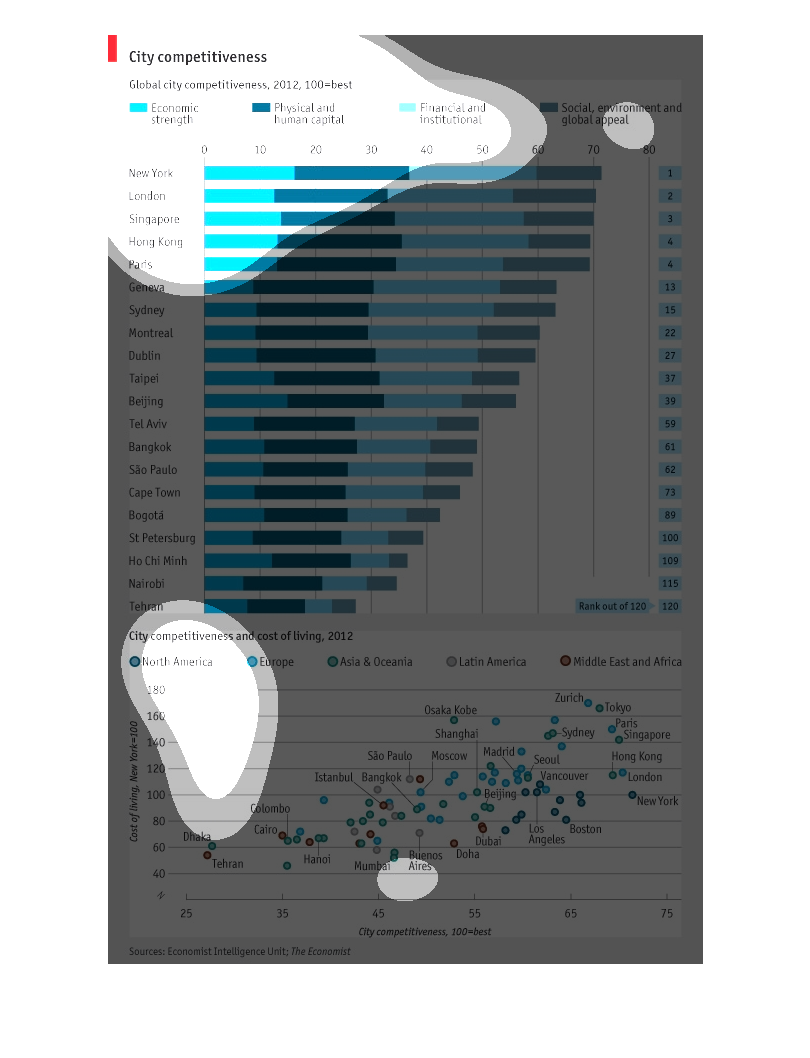
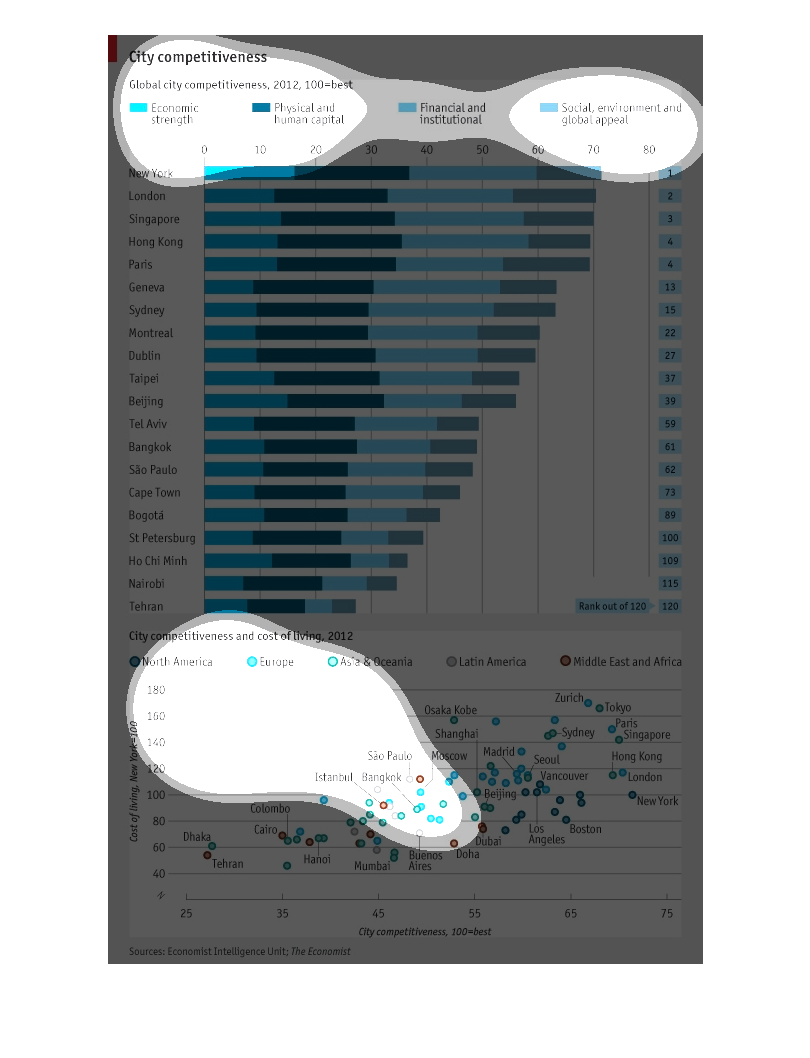
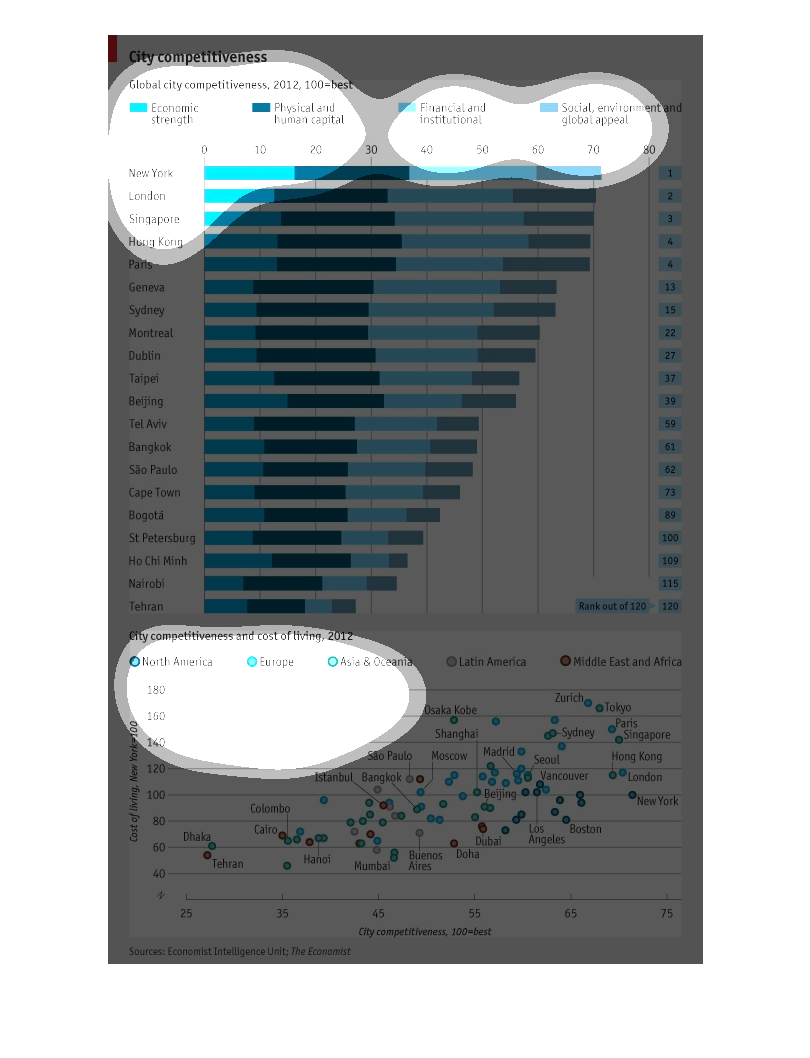
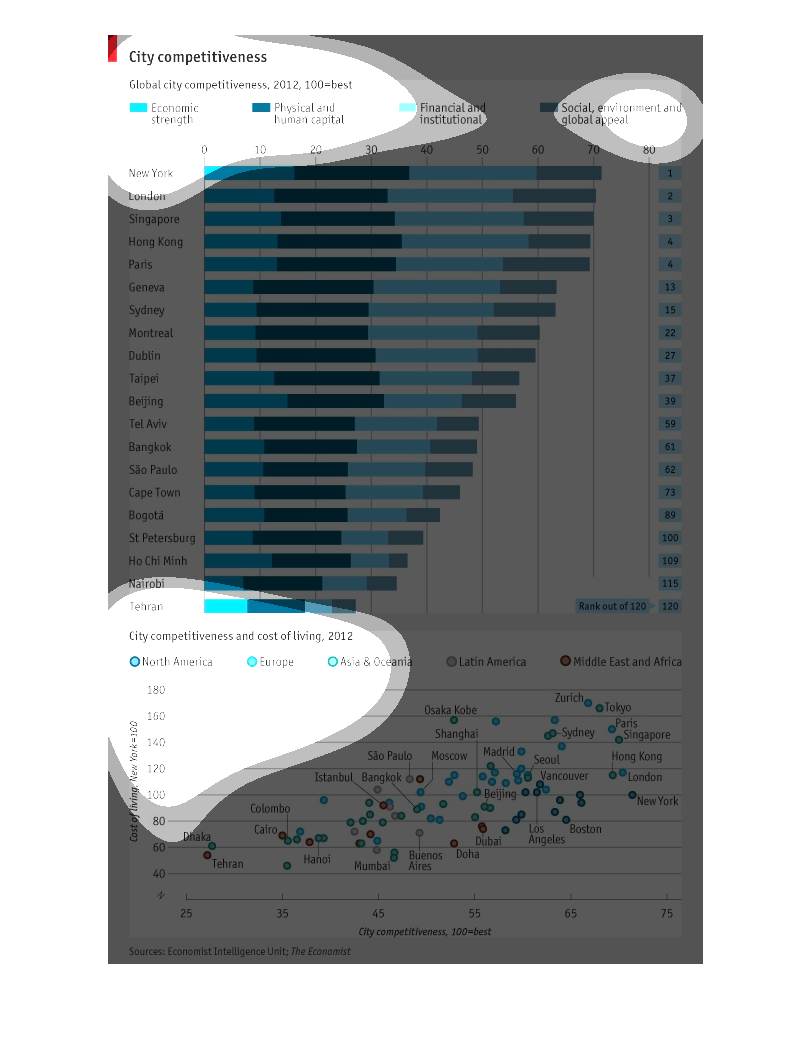
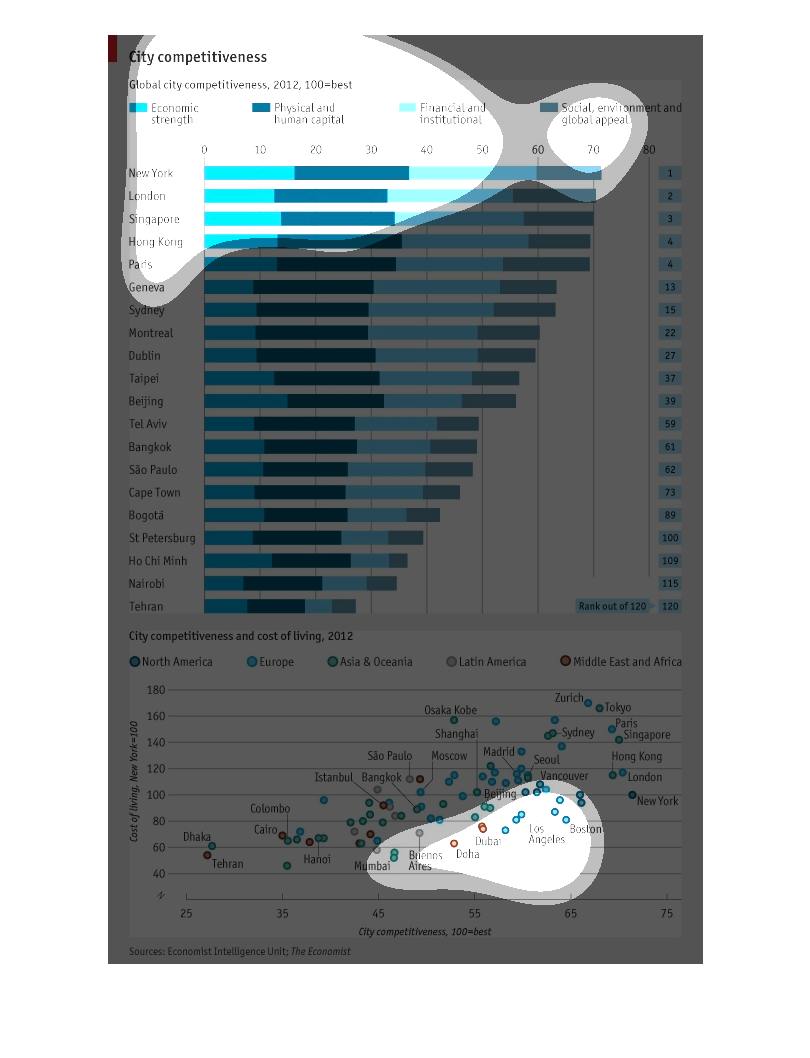
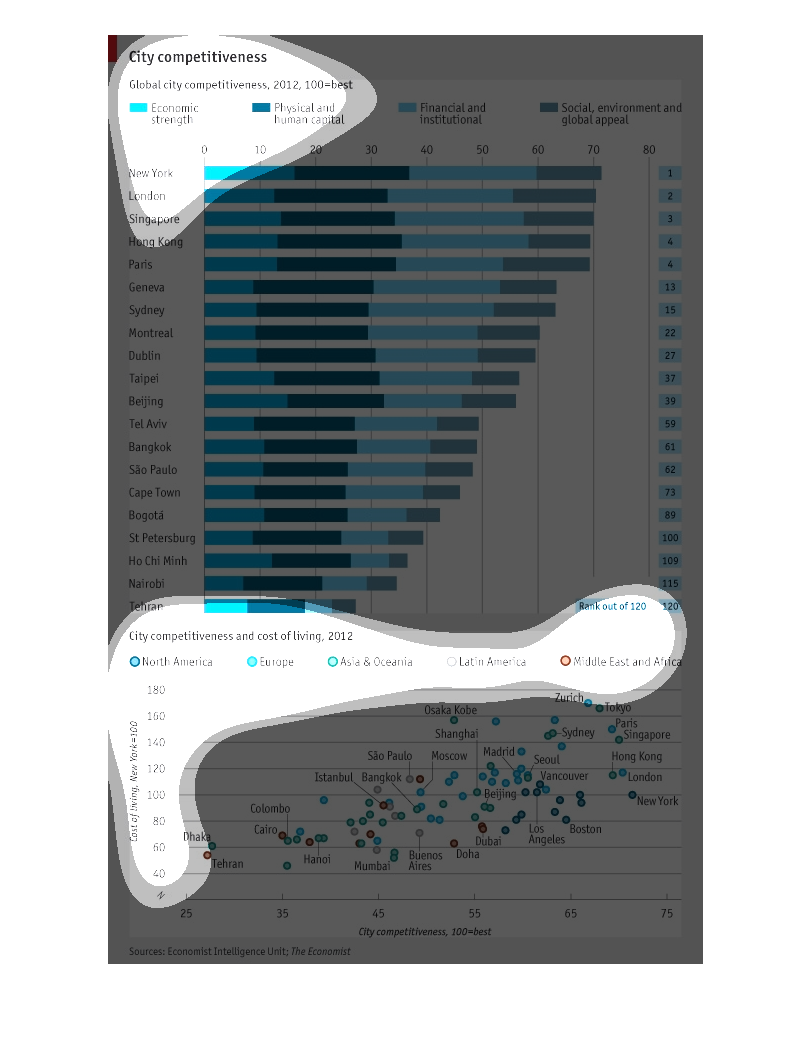
This graph is examining the competitiveness and ranking of major cities worldwide. It judges
economic strength, physical and human capital, financial and institutional strength and global
appeal.
This bar graph is a comparison of global city competitiveness based on economic strength,
physical and human capital, financial and institutional, and social, environment and global
appeal. Leading the cities in competitiveness is New York city.
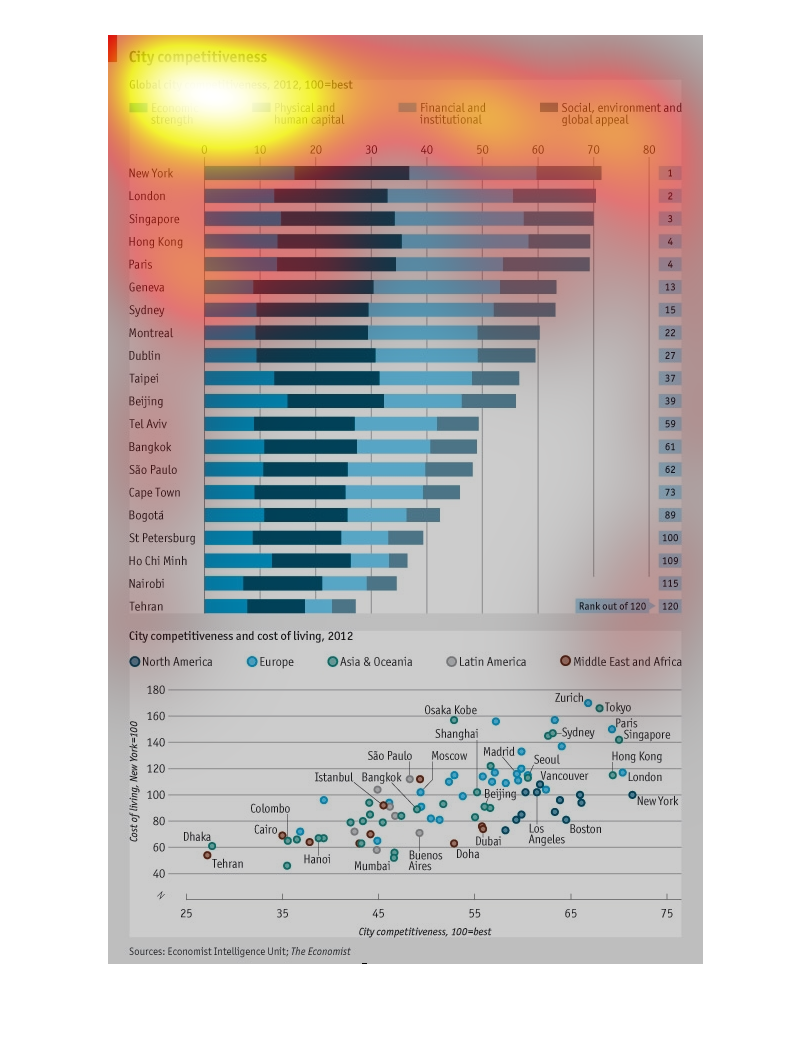
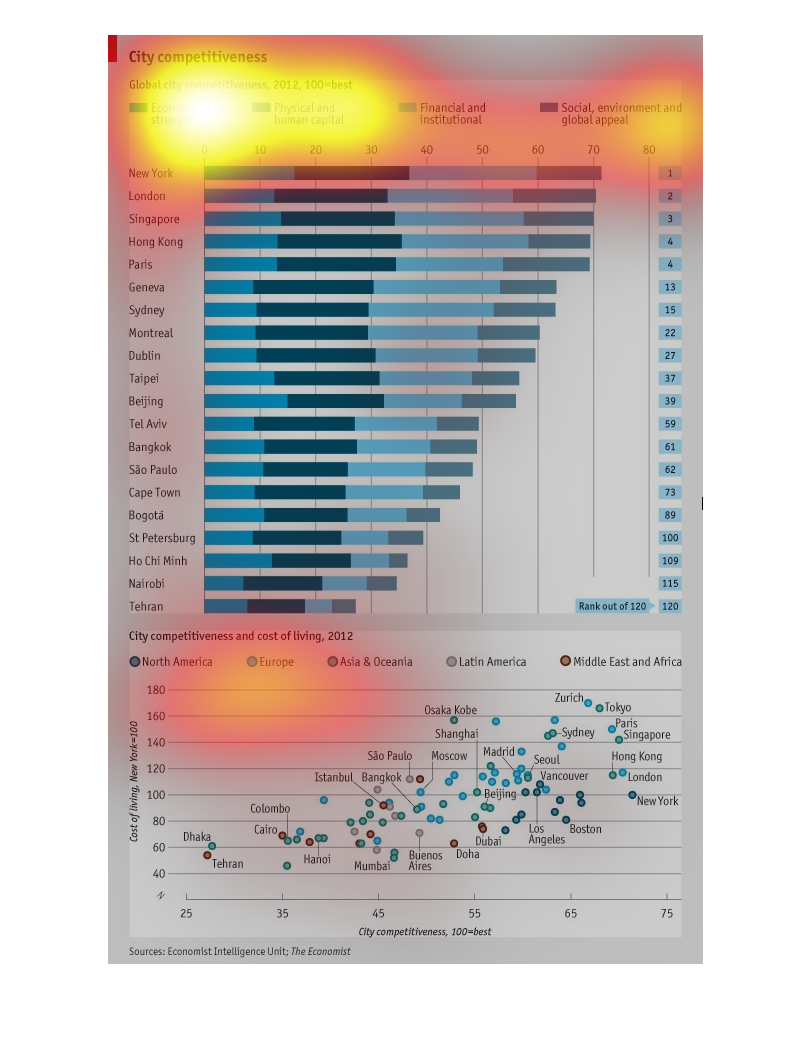
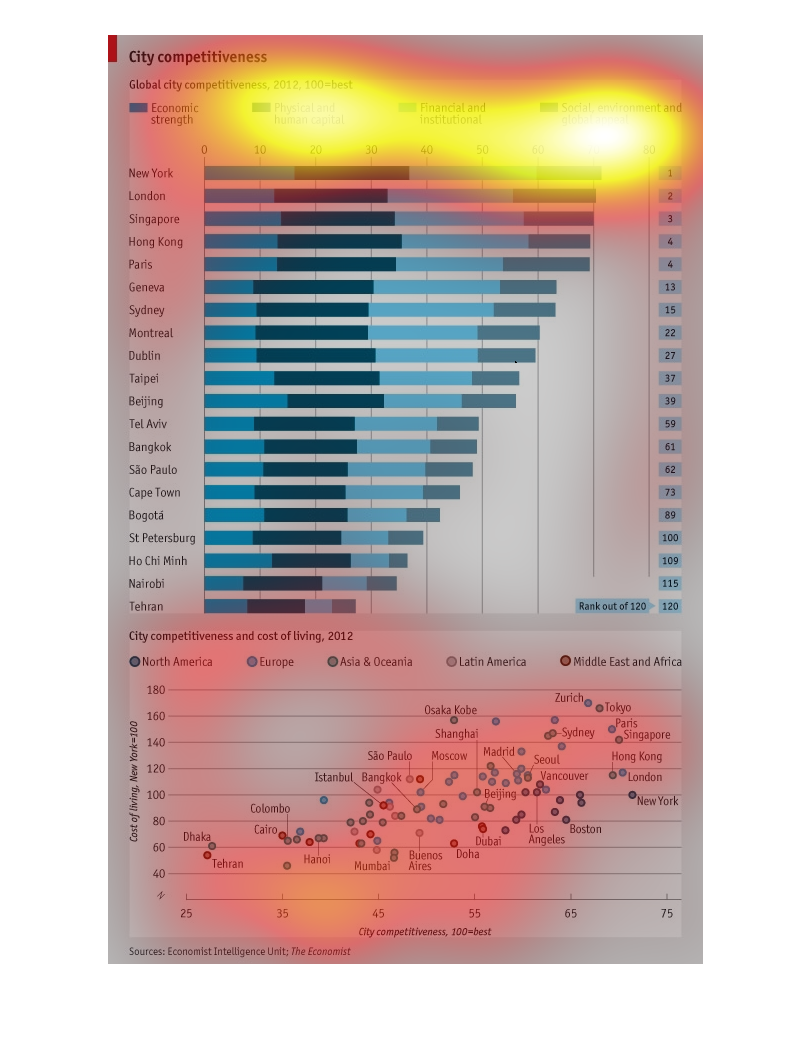
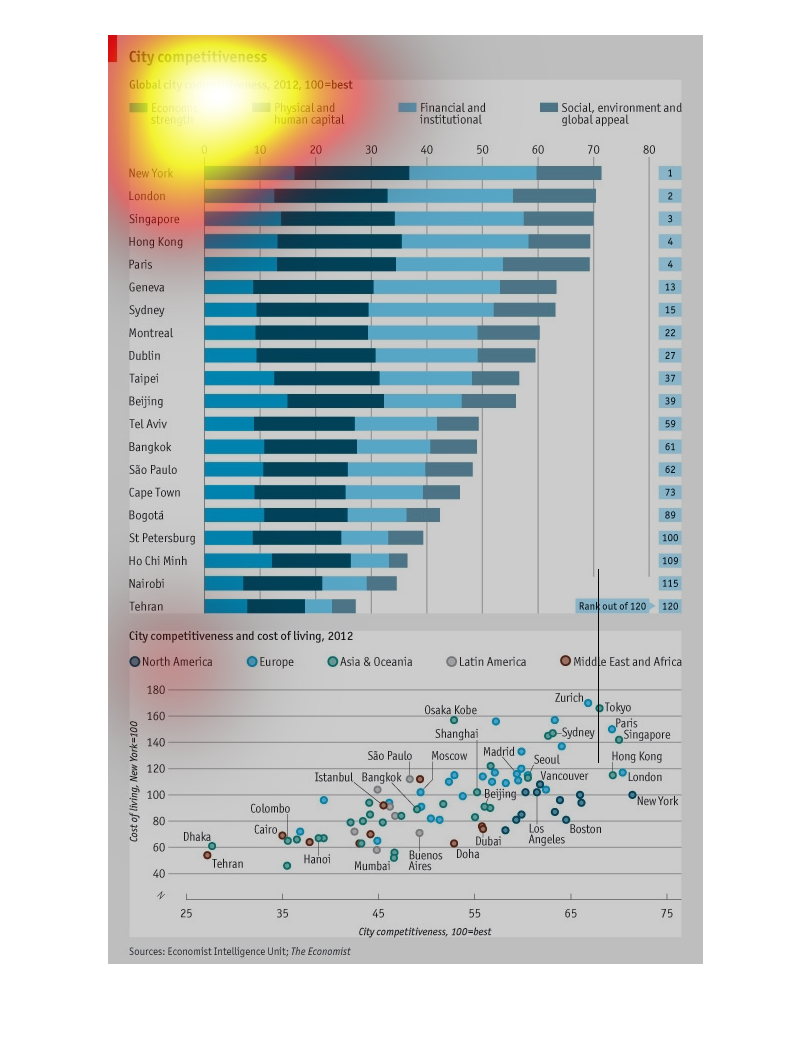
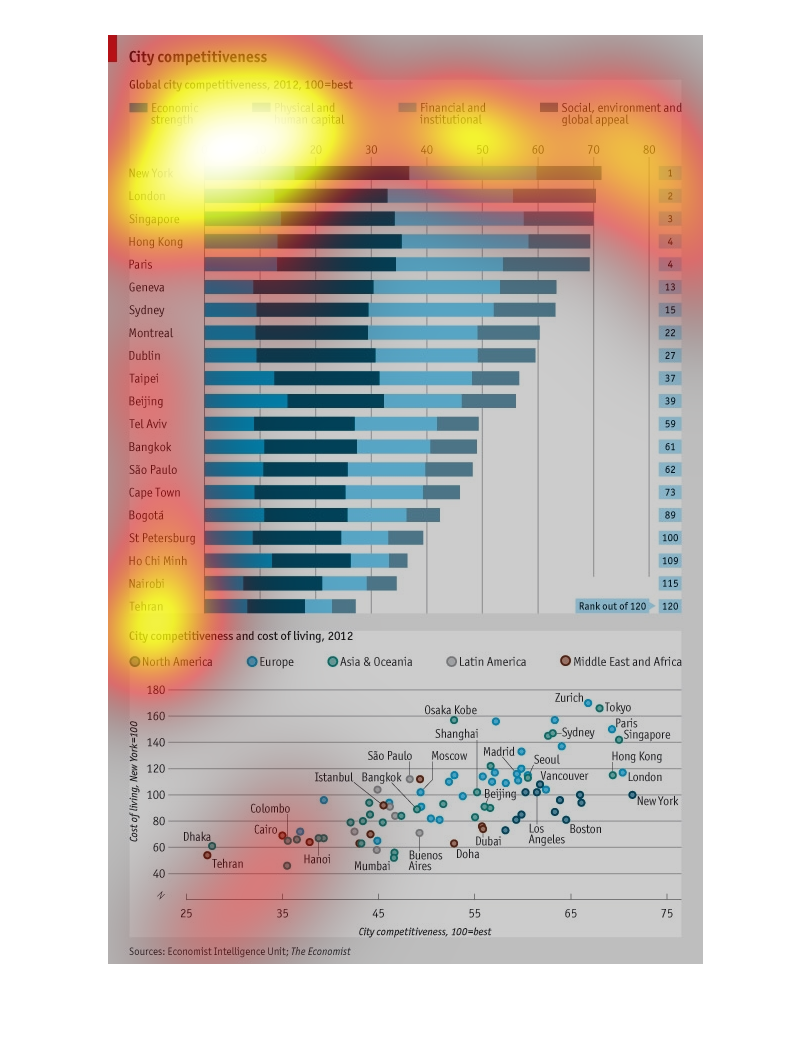
The image is a graph about how competitive different cities are.It is topped by New York,
then second by London. It runs through different cities, and the competitiveness goes down
slowly until the last city, which is Tehran. Tehran is almost 1/3 of the competitiveness of
the top cities.
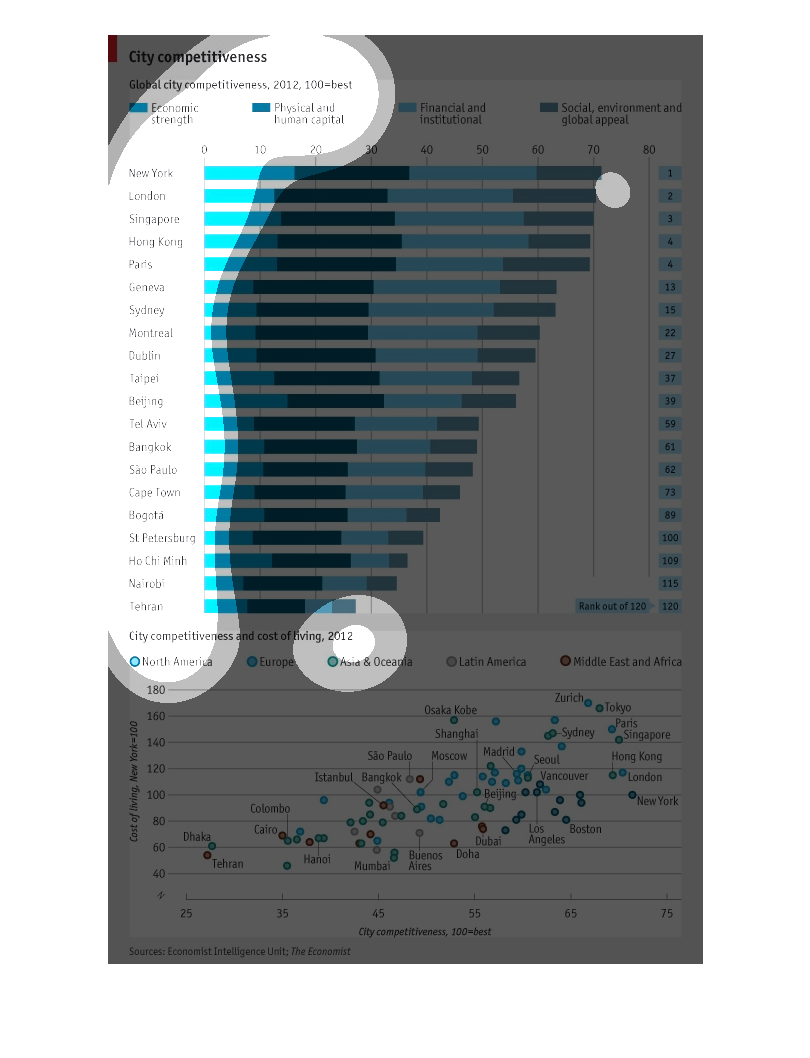
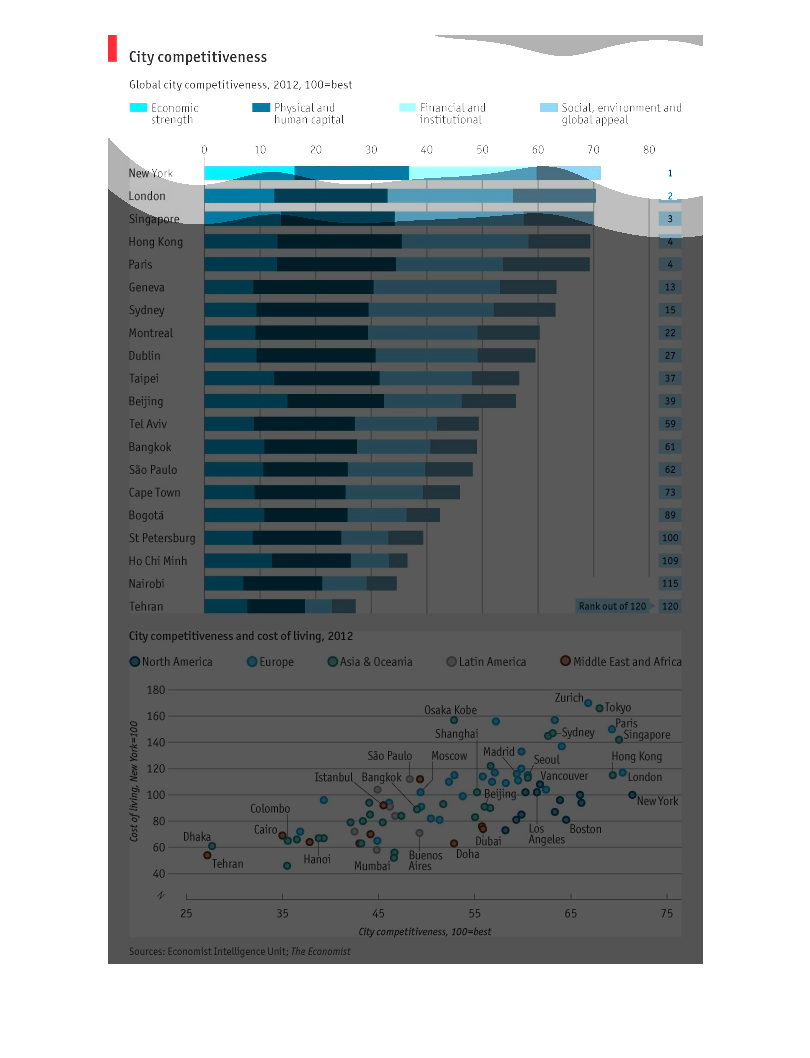
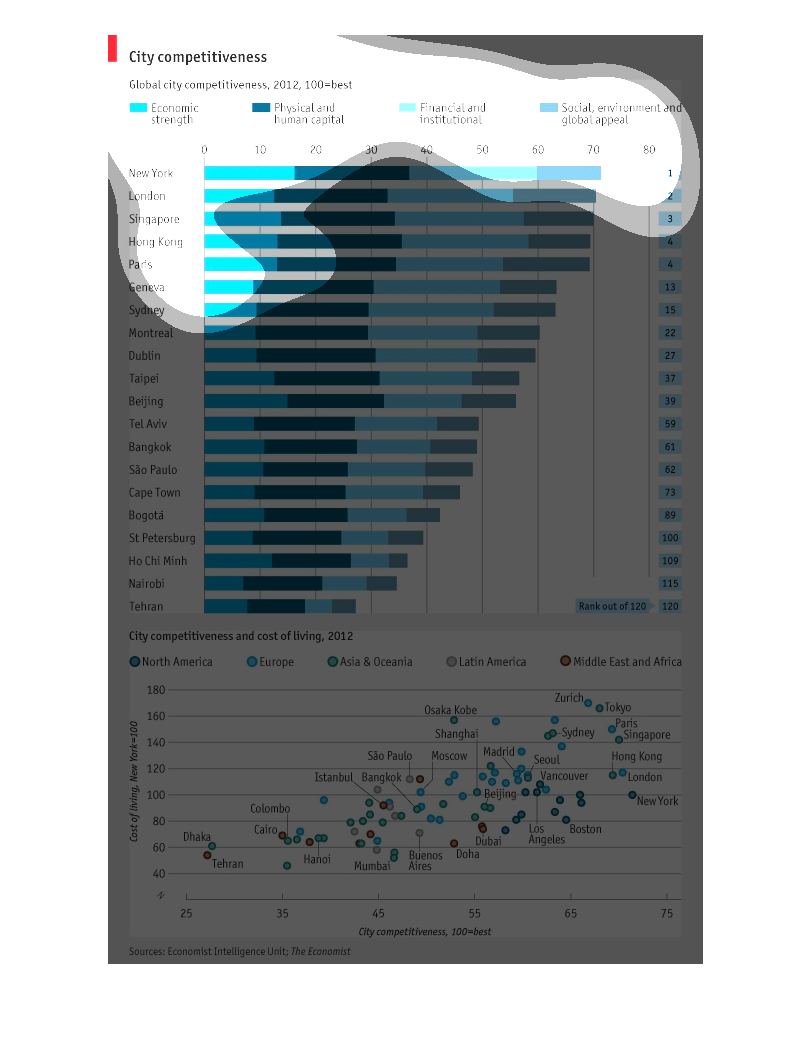
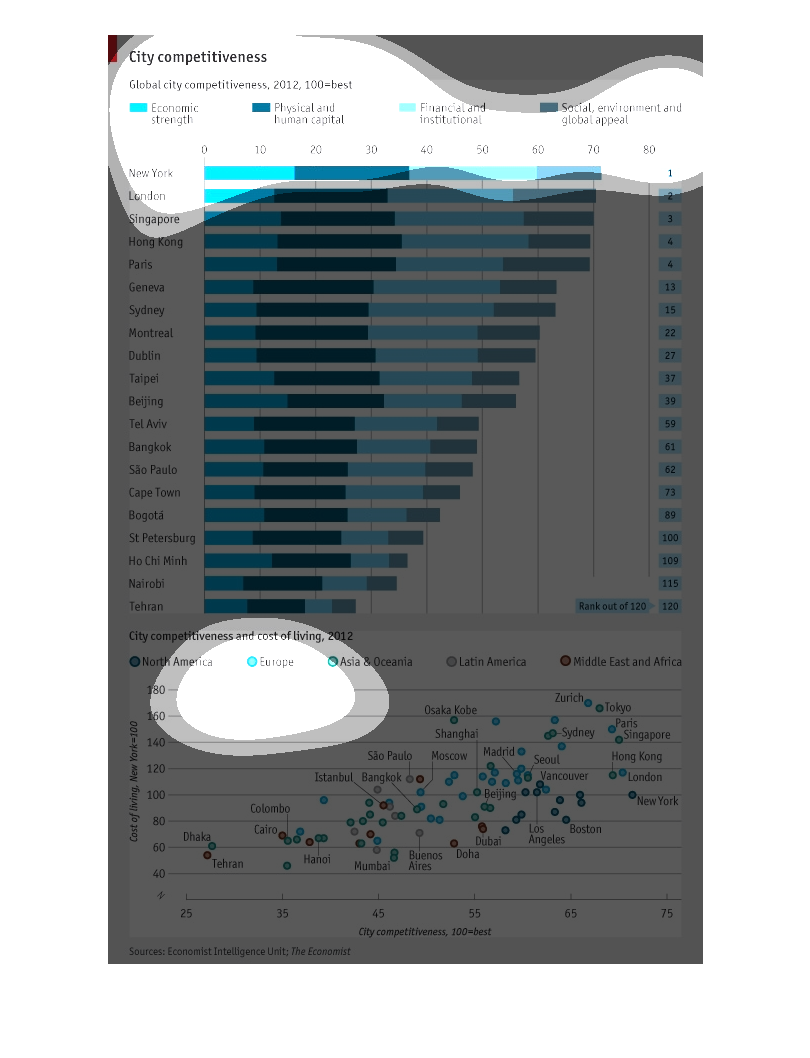
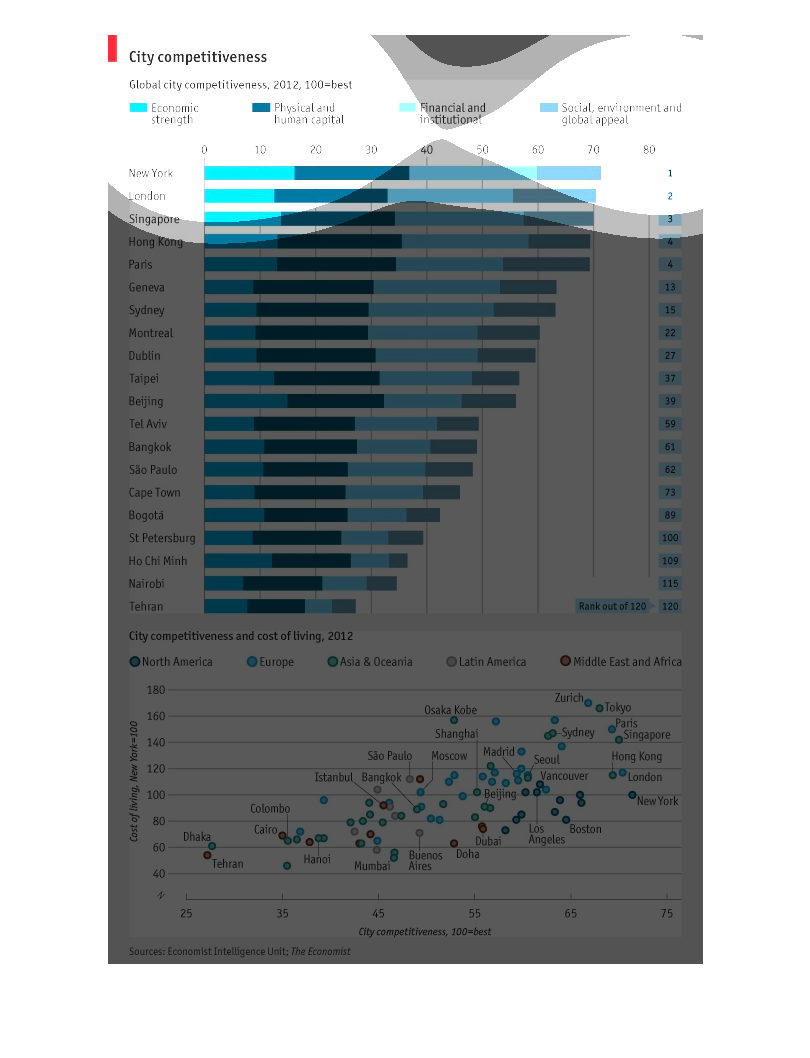
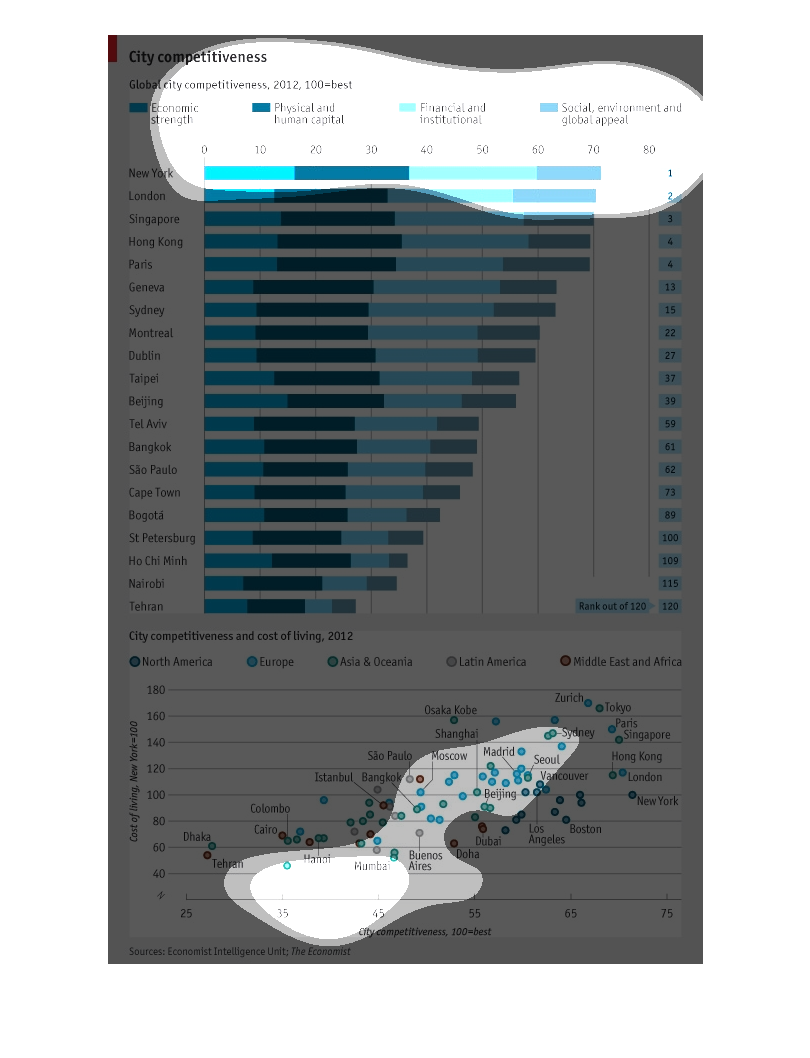
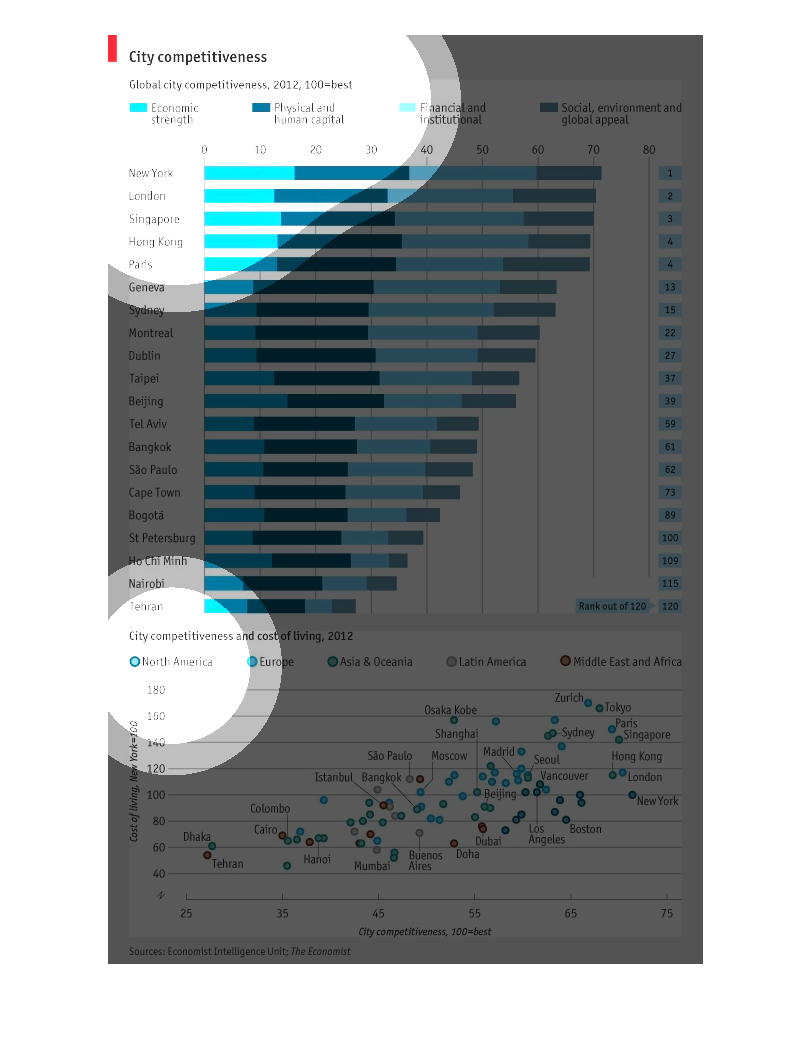
This chart maps global city competitiveness. It includes factors such as economic strength,
physical and human capital, financial and institutional, and social environment and global
appeal. This is a horizontal bar graph. There is also an additional spray chart that details
city competitiveness and cost of living for 2012.
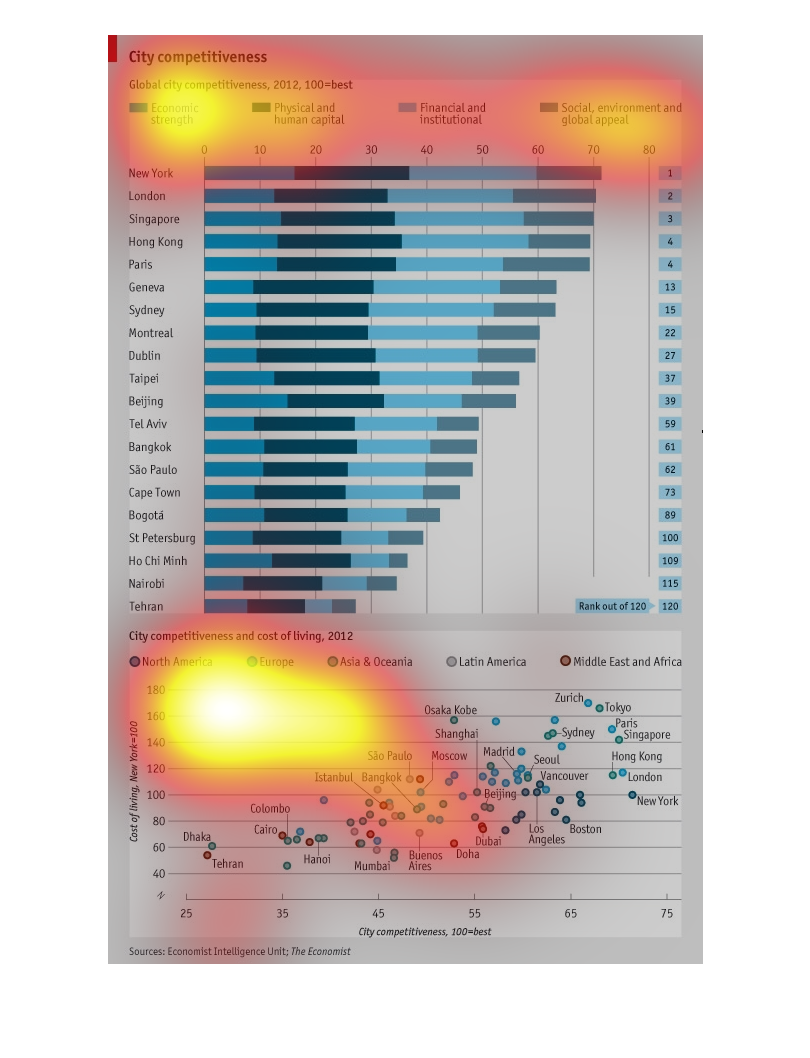
This graph describes and charts the competitiveness of several major cities across the planet
in three  aspects of the cities growth in the year 2012.
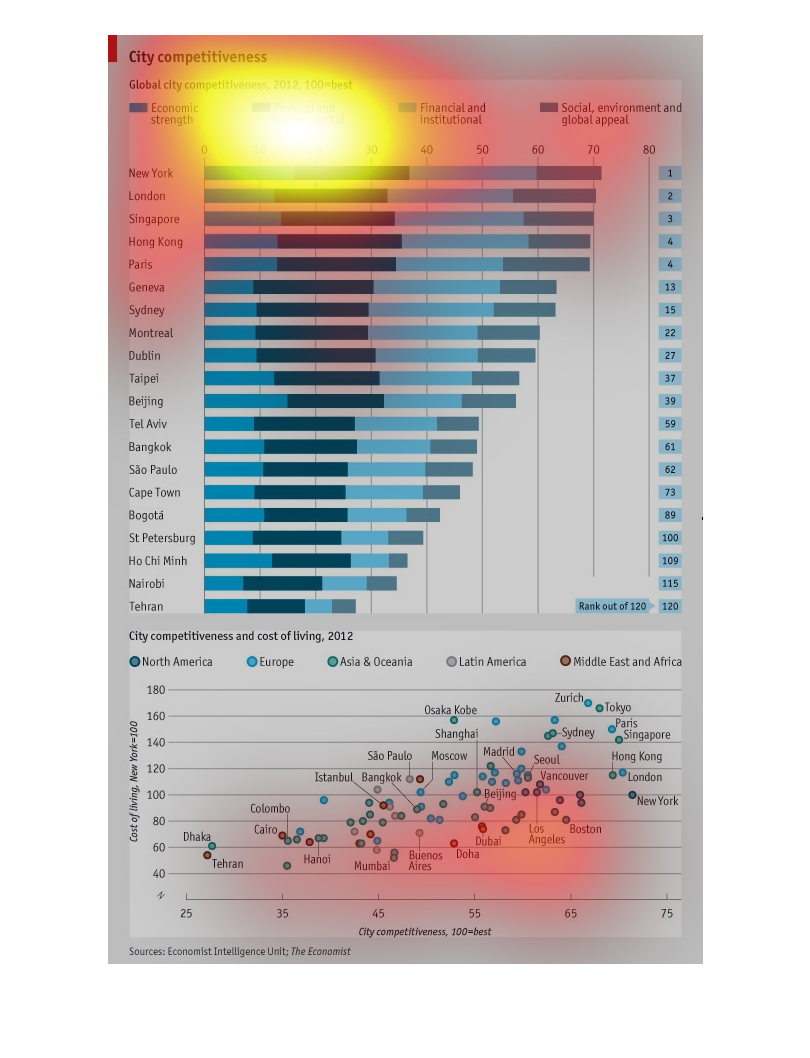
The first bar chart breaks down the competitiveness of various cities across the world for
various factors like economic strength, phyiscal and human capital, financial and institutional,
and various social appeals. The bottom chart compares competitiveness and cost of living for
several countries circa 2012.
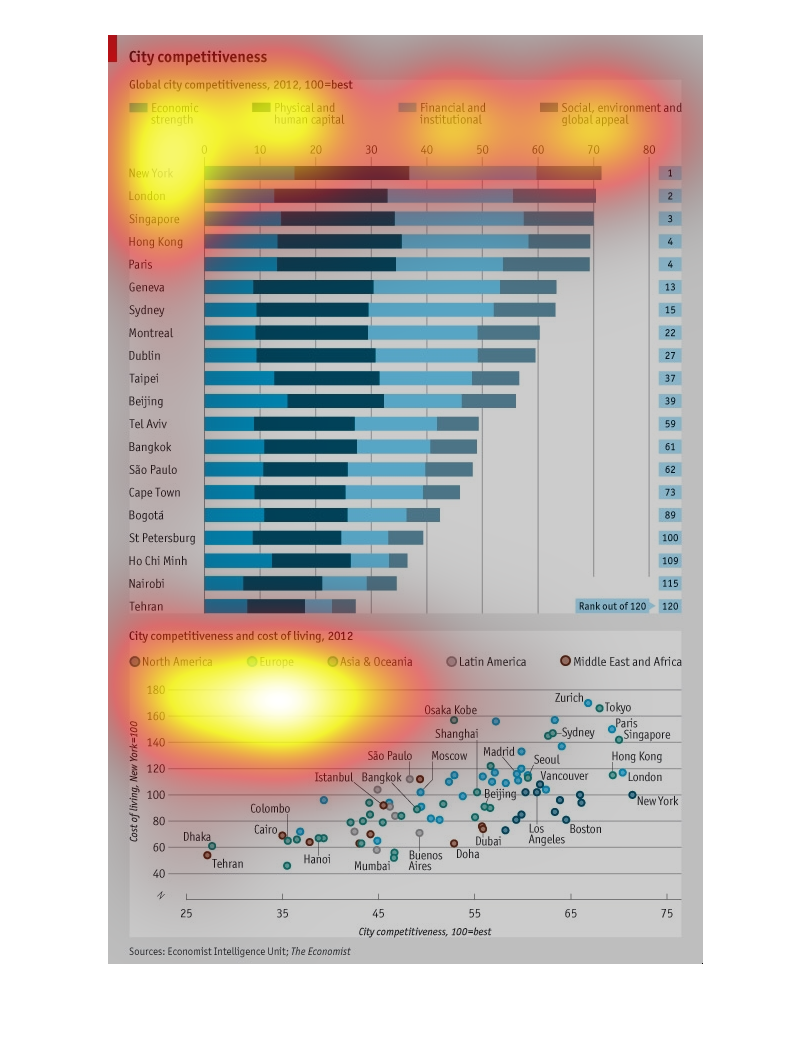
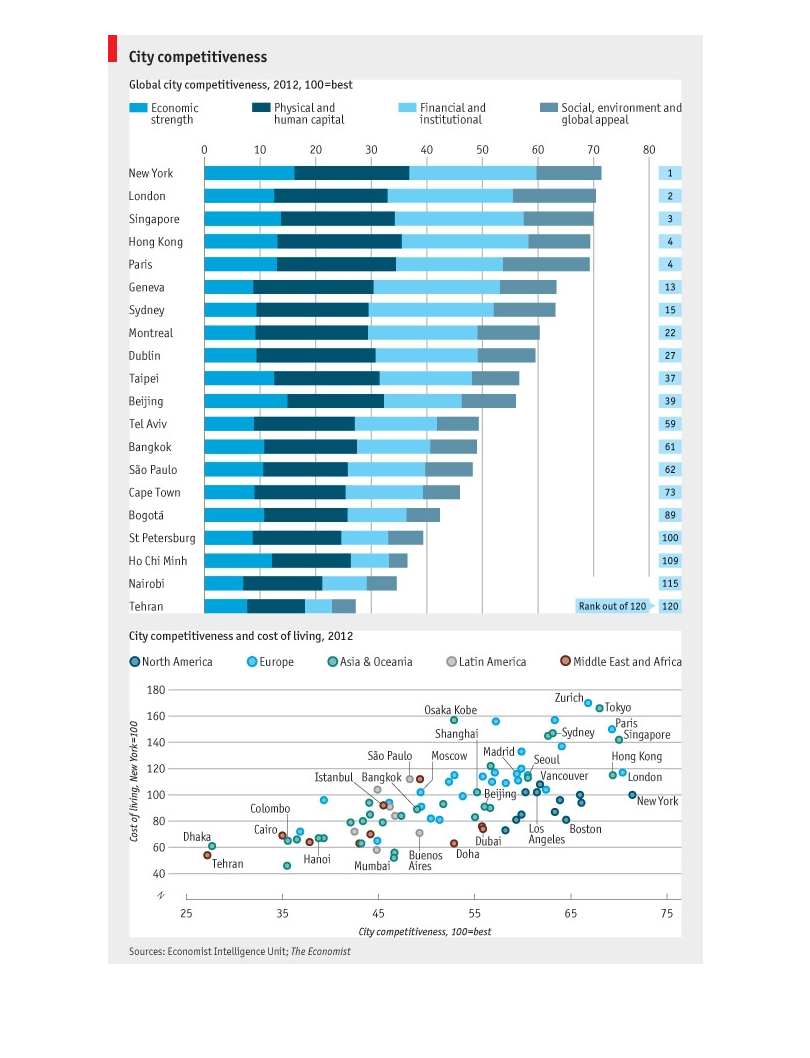
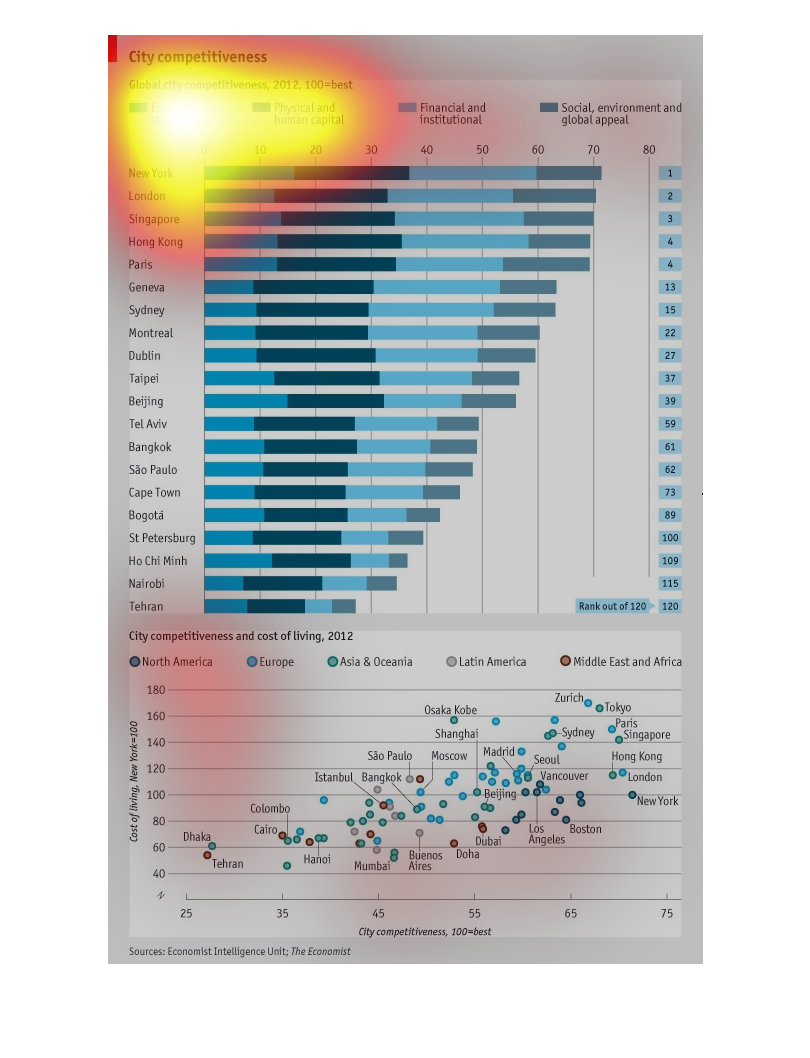
A city competetiveness chart for the year 2012. Competetiveness is measured in economic strength,
physical and human capital, financial, institutional and social, environment and world appeal.
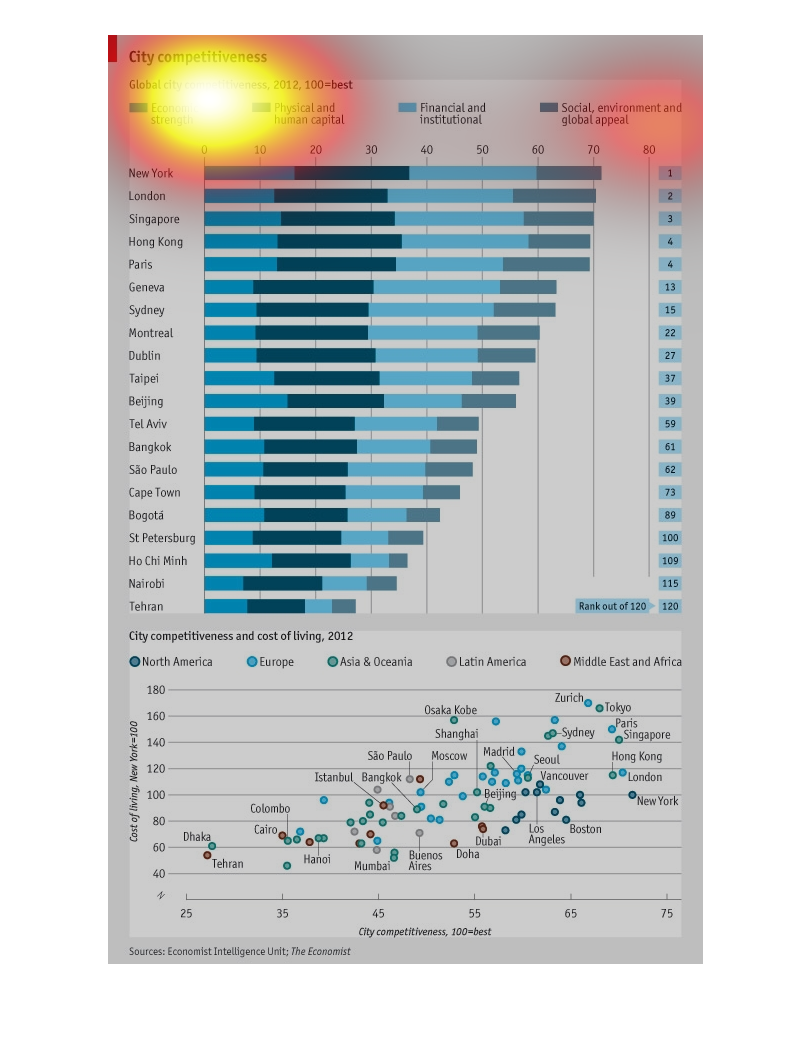
This graph describes global city competitiveness based on economic strength, physical and
human capital, financial and institutional capital, and social, environment and global appeal.
New York ranks highest overall, while Tehran ranks the lowest overall.
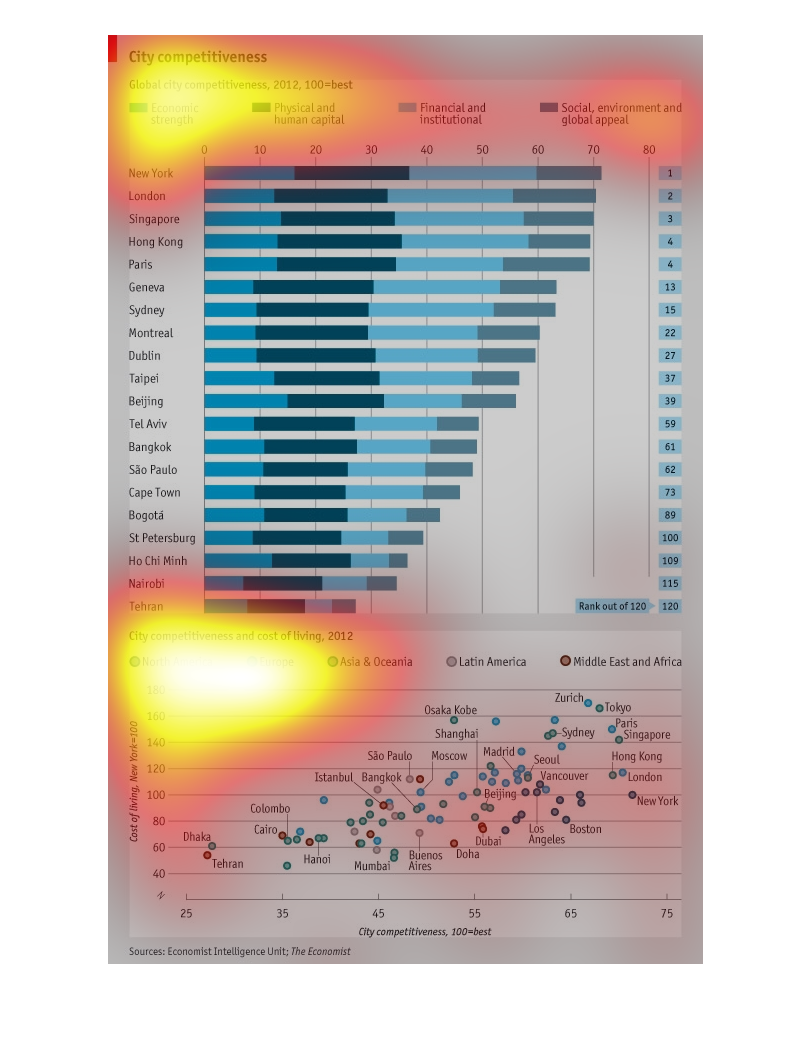
This graphic is a global city comparison of human and physical capital.   The top of the graph
lists financial and institutional inputs as well as social, environmental and global appeal.
 A secondary graph below the main graph appears to show some sort of scatter plot.
The City Competitiveness chart highlights some relationships between numerous cities around
the world. Various criteria, such as number of financial institutions and social appeal, are
examined.
This chart depicts city competitiveness across several metrics in 2012. The city with the
highest rating was New York and the city with the lowest rating was Tehran.
The following graph represents a 2012 study of global city competitiveness. The factors measured
include economic strength, physical and future capital, financial and institutional, social
environment and global appeal. In addition the graph provides the overall ranking of each
measured city out of 100. The bottom half of the graph provides information on the city competitiveness
and cost of living for the year 2012. Each marked point represents one of the 5 major continents
including North America, Europe, Asia & Oceania, Latin America and Middle East and Africa.
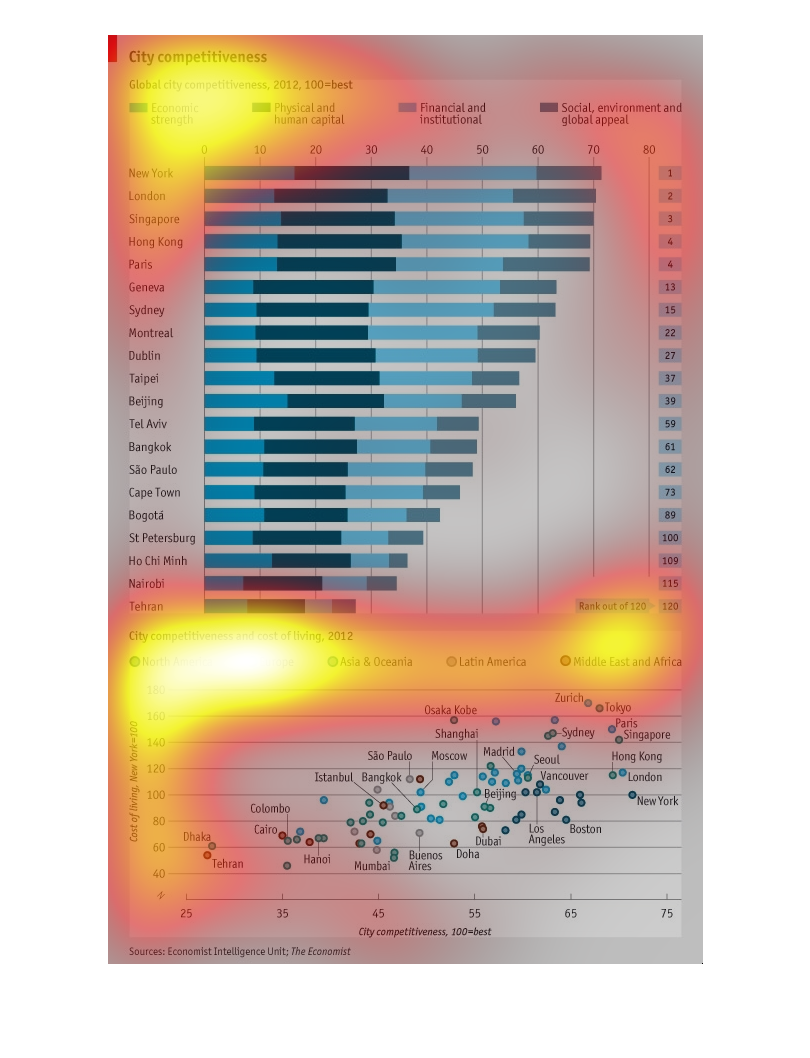
This maps major city competitiveness based on economic strength, capital, finances and institutions,
and appeal. The top three are New York, London, and Singapore. Of those measured, the lowest
are Tehran, Nairobi, and Ho Chi Minh, all in unstable areas.
This survey is about competitiveness by city. The categories each city is rated on is based
on the following areas: social environment and global appeal financial and institutional,
physical and human capital, economic strength.