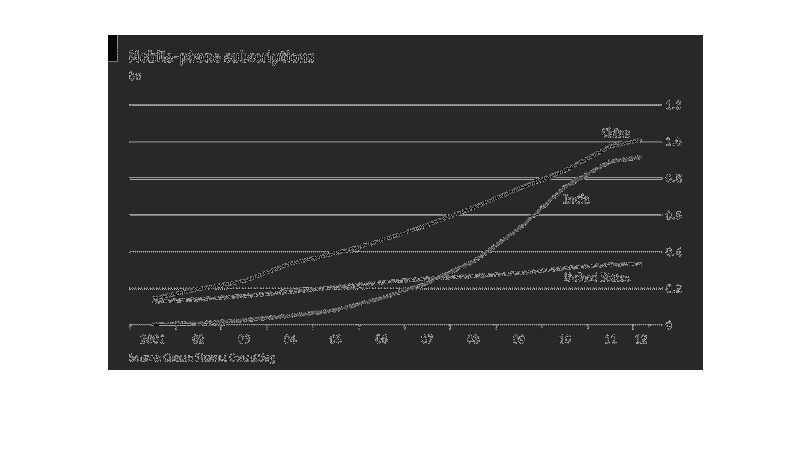
The chart shows mobile phone subscriptions in China, India, and the US. I'm not sure what
the scale is, but the highest value is around 1. If it said that somewhere, I didn't see it.
The data covers 2001 to 2012. China and India have increased much more than the US, with India
overtaking the US in 2007.
Error using .*
Matrix dimensions must agree.

Error in plotSpotlight (line 30)
    output = repmat(a,[1 1 3]).*single(im)/255;

Error in plot_individual_user_maps (line 49)
        [heat] = plotSpotlight(im,heatmap,3);