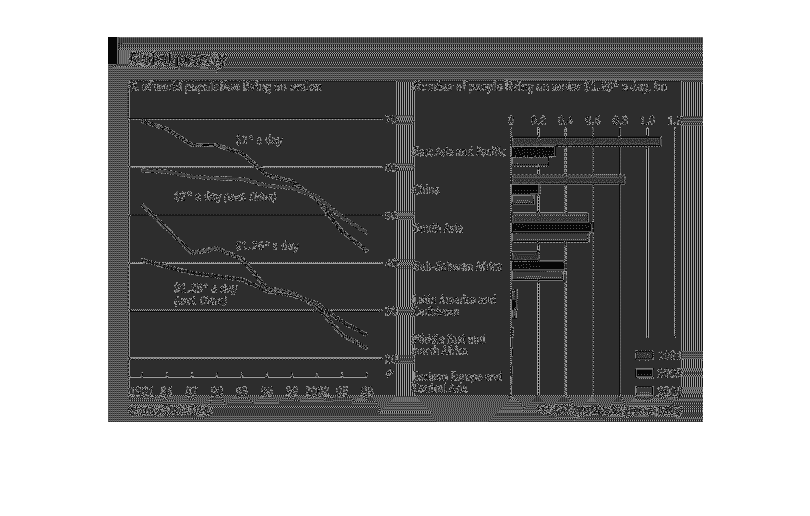
This is a graph describing global poverty throughout the world today I think not sure couldn't
see everything that it said.  This is a graph describing global poverty throughout the world
today I think not sure couldn't see everything that it said.
Error using .*
Matrix dimensions must agree.

Error in plotSpotlight (line 30)
    output = repmat(a,[1 1 3]).*single(im)/255;

Error in plot_individual_user_maps (line 49)
        [heat] = plotSpotlight(im,heatmap,3);