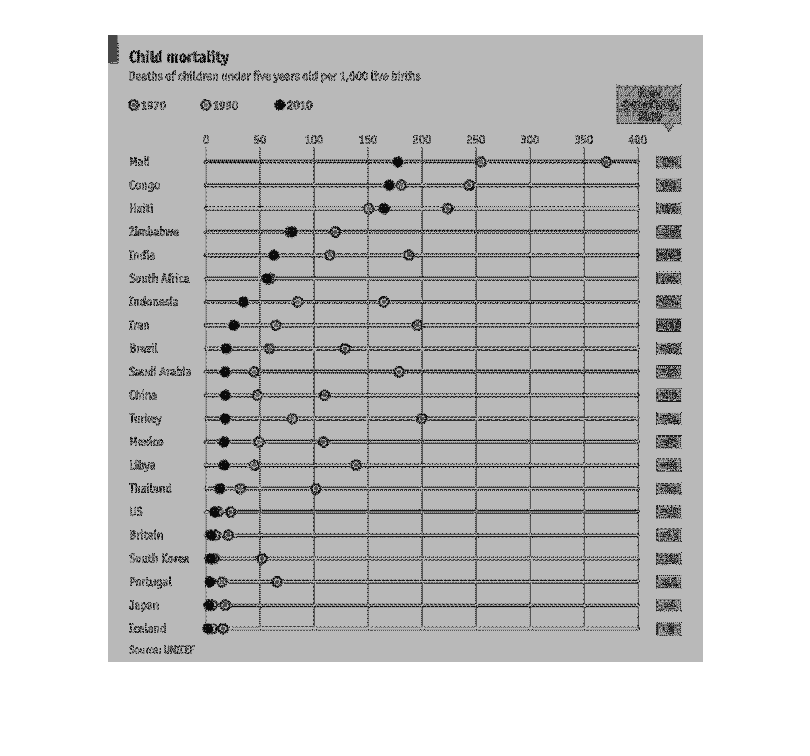
This chart is about chld mortality. Comparing it to 1000 live birhts. It shows year 1970,
1990,  and 2010 in comparison. As well as all the countrie that the study includes beginning
with the hightest mortality rates, Mali , Congo,-Haiti
Error using .*
Matrix dimensions must agree.

Error in plotSpotlight (line 30)
    output = repmat(a,[1 1 3]).*single(im)/255;

Error in plot_individual_user_maps (line 49)
        [heat] = plotSpotlight(im,heatmap,3);