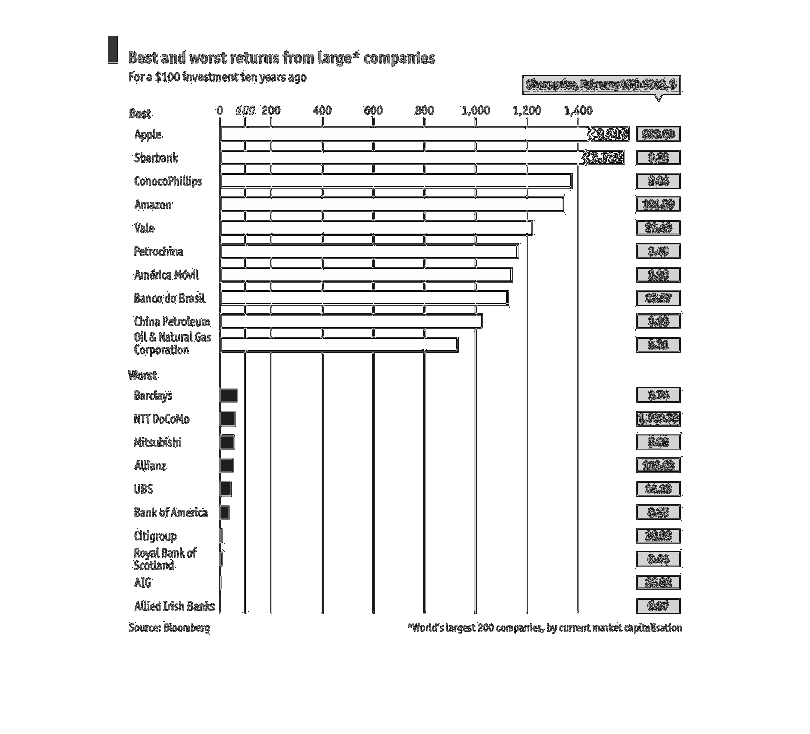
A chart that shows the best and worst returns from large companies. This is according to statistics
compiled by Bloomberg as of February, 2012. Companies on the list were some of the world's
largest 200 companies at the time of release.
Error using .*
Matrix dimensions must agree.

Error in plotSpotlight (line 30)
    output = repmat(a,[1 1 3]).*single(im)/255;

Error in plot_individual_user_maps (line 49)
        [heat] = plotSpotlight(im,heatmap,3);