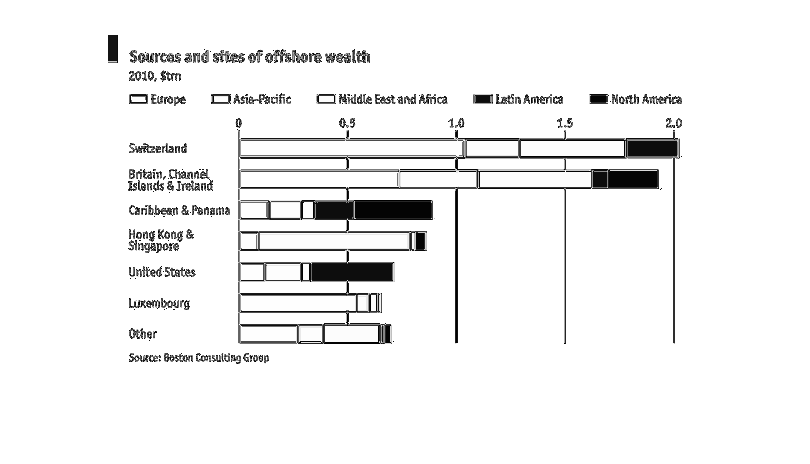
This table shows the sources and sites of offshore wealth. I am not sure what the numbers
represent. Each bar represents a country somewhere in the world.
Error using .*
Matrix dimensions must agree.

Error in plotSpotlight (line 30)
    output = repmat(a,[1 1 3]).*single(im)/255;

Error in plot_individual_user_maps (line 49)
        [heat] = plotSpotlight(im,heatmap,3);