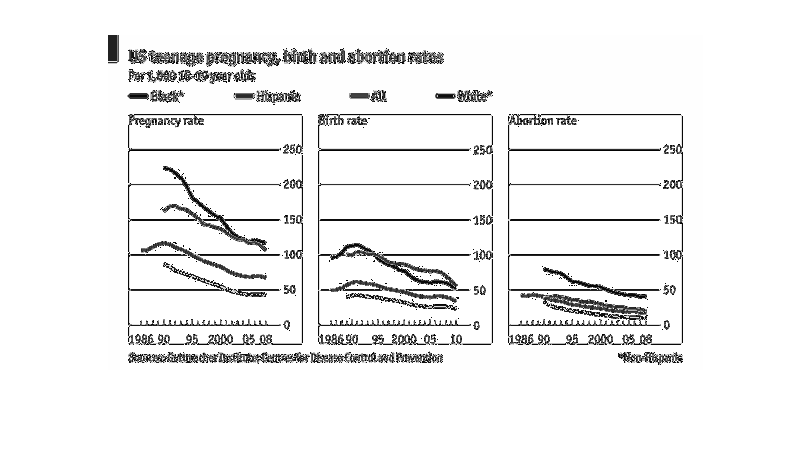
These three charts feature U.S pregnancy, birth and abortion rates, per thousand 15-19 year
olds from 1986 to 2008. Statistics from Guttmacher Institte and The Center for Disease Contol
and prevention.  It divides by white, black and hispanic as well as all. All three charts
show a decline in all three, with the most dramatic decline appearing to be on the pregnancy
chart.
Error using .*
Matrix dimensions must agree.

Error in plotSpotlight (line 30)
    output = repmat(a,[1 1 3]).*single(im)/255;

Error in plot_individual_user_maps (line 49)
        [heat] = plotSpotlight(im,heatmap,3);