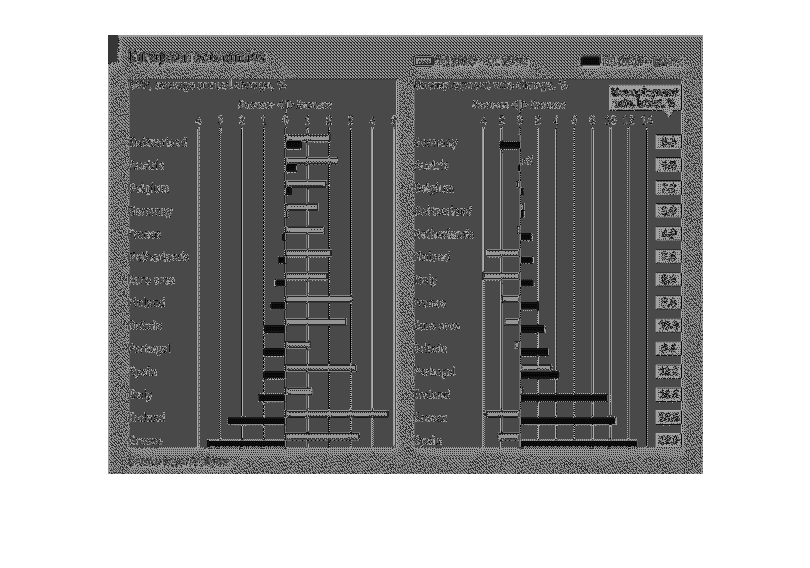
This visual bar graph shows European economies in relation to their annual percent change
in GDP over two time periods (Q1 2000-2008 and Q1 2008-latest) as well as the unemployment
rate change. Switzerland has had the slightest change in annual GDP % change with about  a
2% increase over the first time period and a 0.75% increase over the latter time period. On
the other hand, Greece had a 3.4% increase over the first time period, but the second time
period showed a huge loss in GDP of 3.7%. Germany has the lowest unemployment rate with near
0% change in the first time period and a decrease in the second time period of 2%. The latest
unemployment rate in Germany is at 5.5%. Spain has the highest unemployment rate, currently
at 22.9% and 1.25% decrease in unemployment during the first time period, but 13% increase
in the unemployment rate more recently.
Error using .*
Matrix dimensions must agree.

Error in plotSpotlight (line 30)
    output = repmat(a,[1 1 3]).*single(im)/255;

Error in plot_individual_user_maps (line 49)
        [heat] = plotSpotlight(im,heatmap,3);