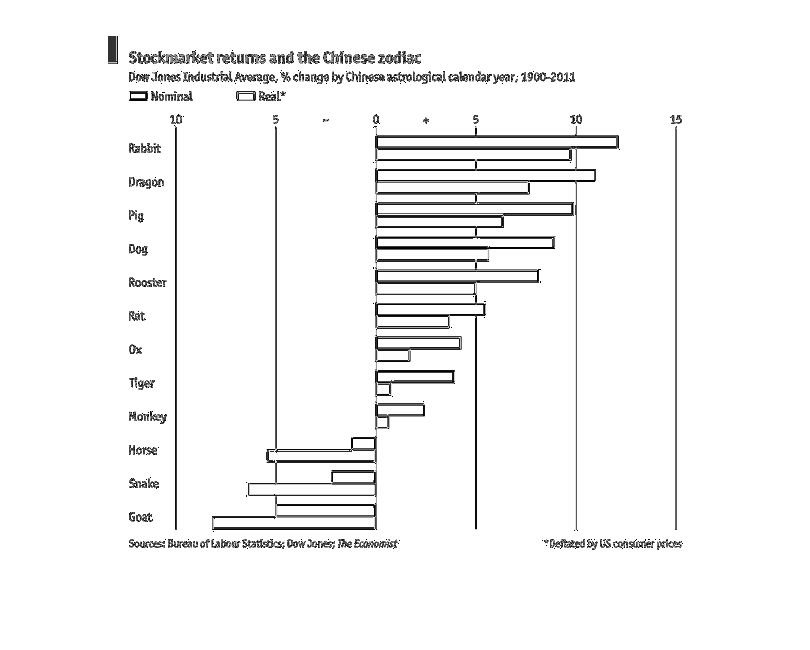
This graph shows the percent change in the Dow jones industrial averages as it correlates
to the Chinese astrological calendar between the years 1900 and 2011. It depicts both the
real and nominal values of the market as determined by the bureau of labor statistics.
Error using .*
Matrix dimensions must agree.

Error in plotSpotlight (line 30)
    output = repmat(a,[1 1 3]).*single(im)/255;

Error in plot_individual_user_maps (line 49)
        [heat] = plotSpotlight(im,heatmap,3);