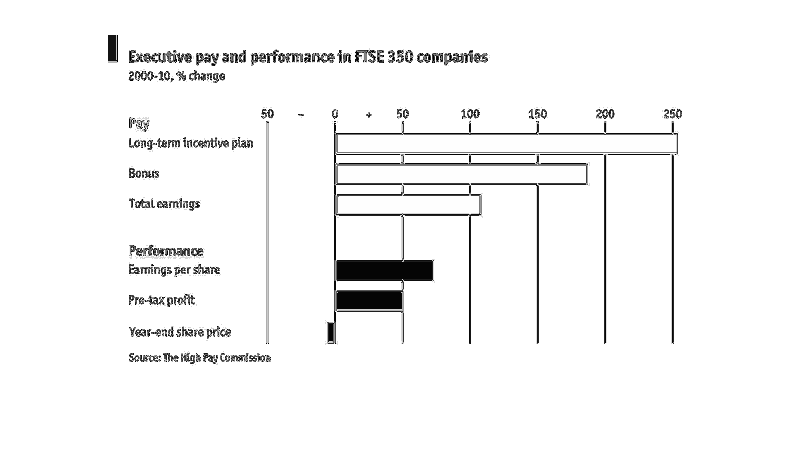
The graph shows the executive performance and pay in FTSE 350 companies from 2000-21010.
It looked at long term pay and bonus for the payment section. Performance looke at earnings
per share, pretax profit, and year end shae price.
Error using .*
Matrix dimensions must agree.

Error in plotSpotlight (line 30)
    output = repmat(a,[1 1 3]).*single(im)/255;

Error in plot_individual_user_maps (line 49)
        [heat] = plotSpotlight(im,heatmap,3);