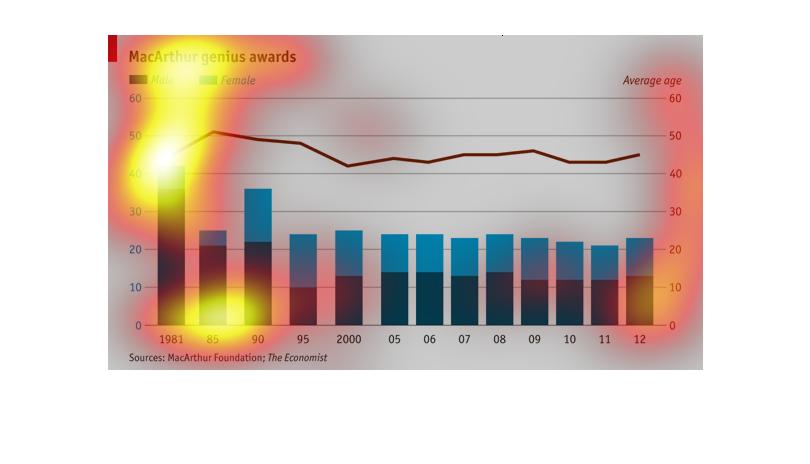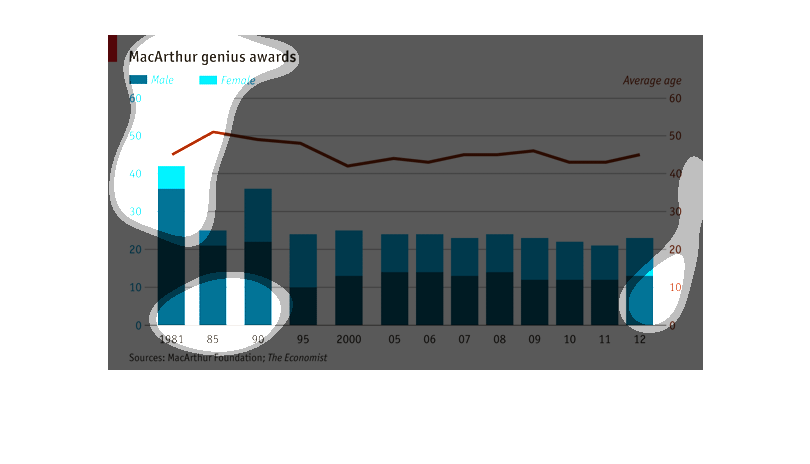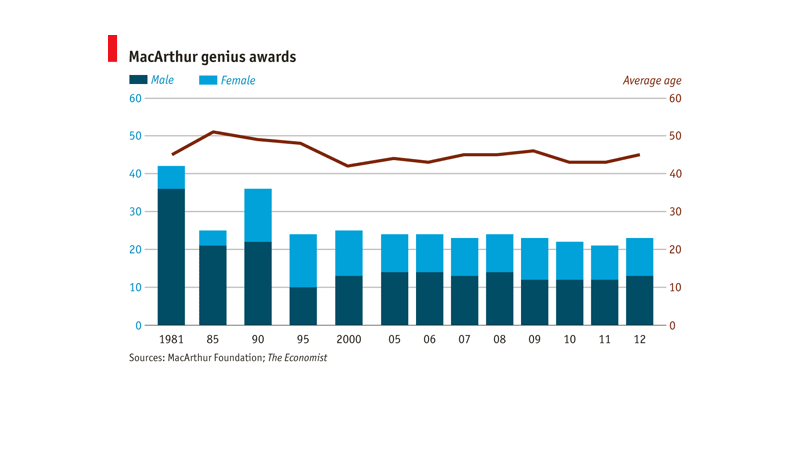
The mcarthur genius awards chart.comapres male vs females from year 1981 all the way to 2012.it
takes into consideration age 60 participants. And it shows males getting more awards than
females.
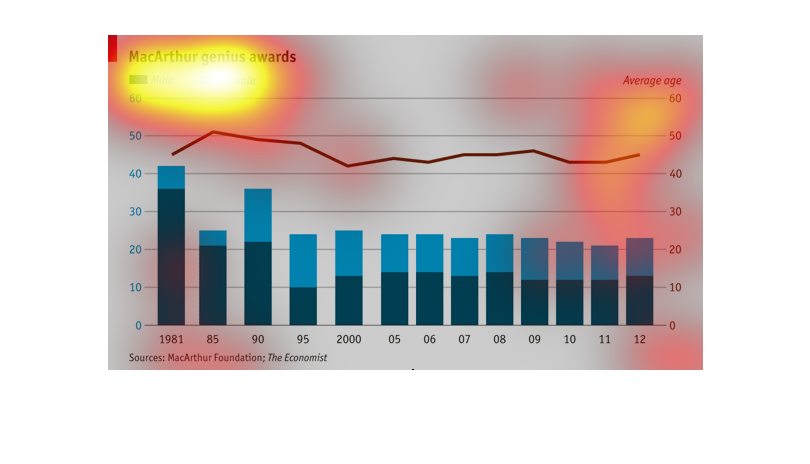
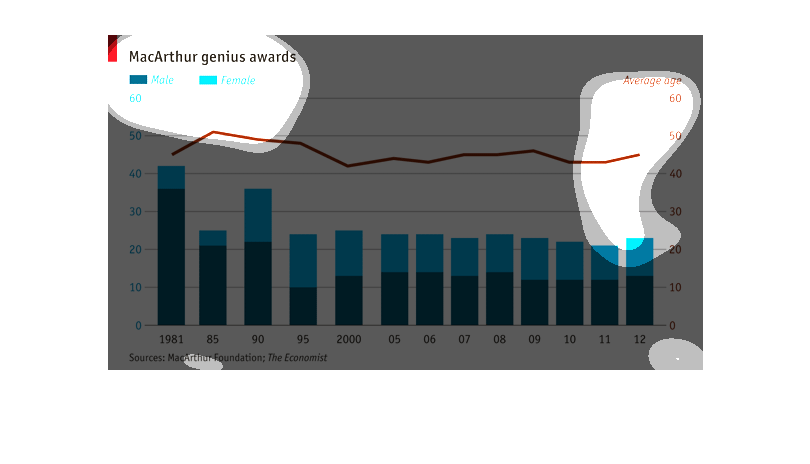
The graph displays the McArthur Genius Awards that men and women have received from 1981 to
2012. From 1981 to 1985, men had accounted for a majority of the awards won, however women
have become half of the award recipients.
It is a bar chart that shows the number of winners of the MacArthur Genius Awards showing
the winners by sex.  It also has a line chart that shows the average age of the winners.
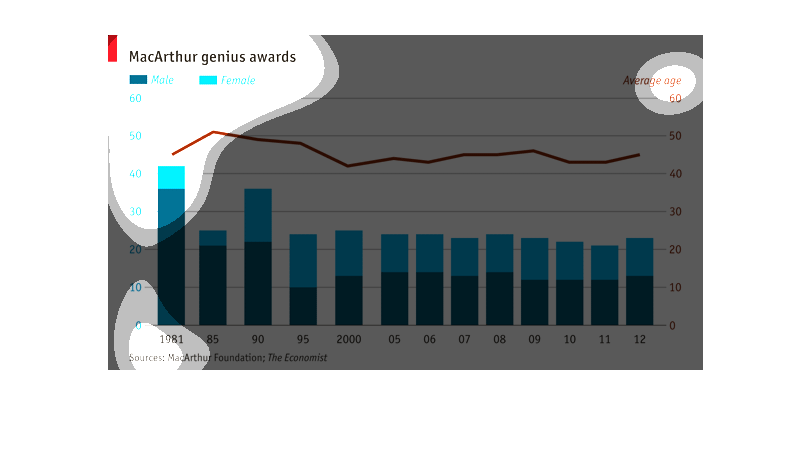
This graph displays the amount MacArthur Genius Awards given to males and females over the
years.  It also shows their age.  In 1981 there were more men getting awards but over the
years it looks like women have started to be awarded more of the awards.
This is a chart showing the MacArthur genius award with Male vs Female and an age range. When
it was started in 1981 it seemed to have a trend of being older and averaging 30-45 in age.
Women consistently seem to be a few years older then the men who won the award. It looks like
over the past twenty years the age has hovered around 20-30 years old which is a drastic drop
from the 80s.
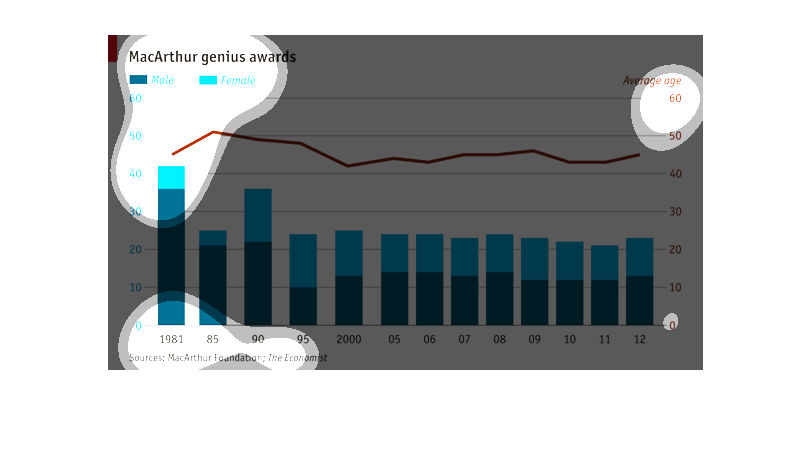
This lists the MacArthur Genius Awards based on how many were awarded and male/female, along
with average age. The average age remains somewhat consistent, between 40-50. Over time, there
has been greater gender equality.
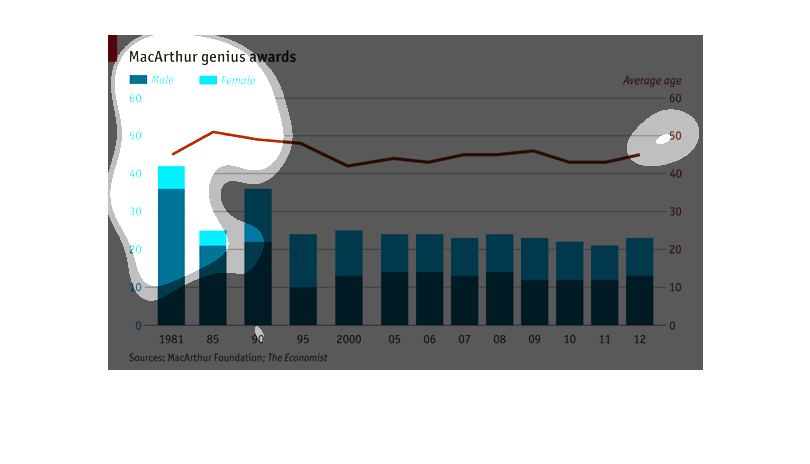
this chart contains information about the Macarthur genius awards and compares females to
males. the information starts from the year 1981 to 2012. in the early years males took most
of the awards but recently they are more or less even
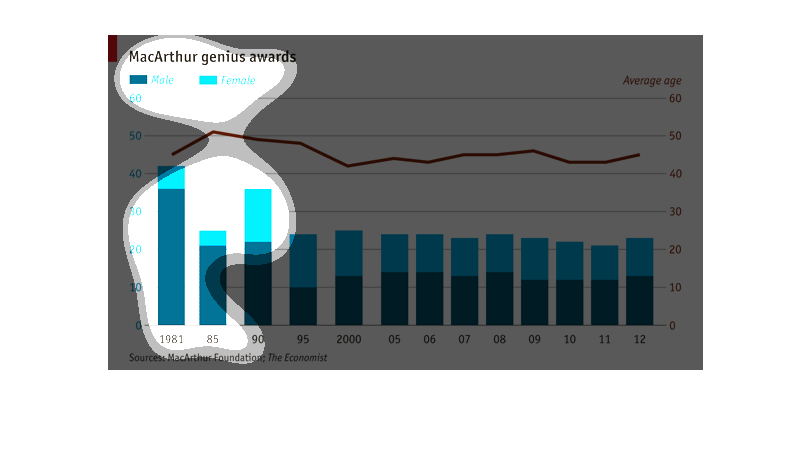
The chart details the relationship of MacArthur Genius Award recipients by gender, male and
female, and average age from 1981 to 2012. With the exception of 1995, there has been more
male recipients than female awardees per year.
The visual graph shows the estimated amounts of recipients for the MacArthur Genius award
and separates the recipient numbers by male and female genders.
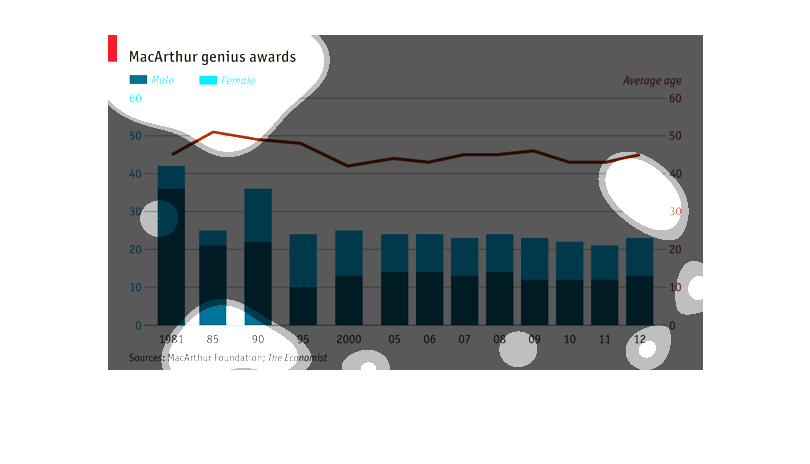
This chart shows the MacArthur Genius awards and how many have be prenseted broken down by
male and female from 1981 to 2012.  The number of females recieving this award has steadliy
been highr than males recieving..
This bar graph shows MacArthur genius awards. Males are shown in dark blue, and females in
light blue. It follows the years of 1981-2012. In the years 1981 and 1990 it was the highest.
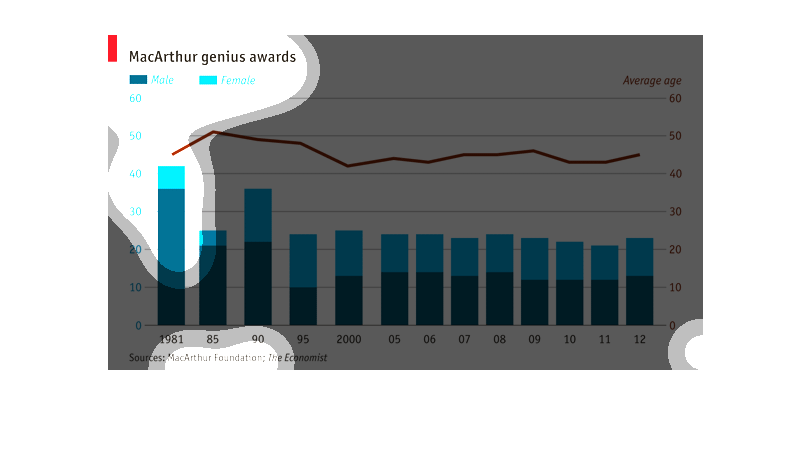
McArthur genius award graph. Male and Female with age group. Timeline is 1985-2012 and 0 to
60. The graph is blue and the background is white. The line indicator is red.
The image is a bar graph with two different colors of blue and a red line. The lighter blue
represents females and the darker blue represents males. There is a red line that represents
the average age. The chart is plotting the average age people had received the MacArthur genius
awards and in what years correlated with that.
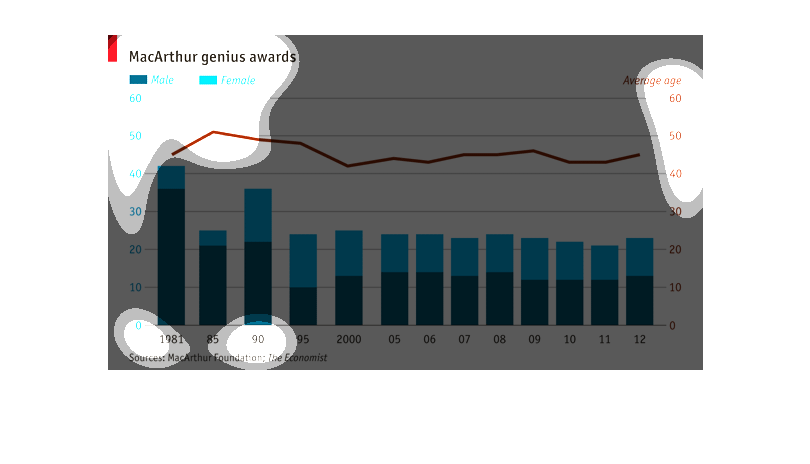
This chart tracks the MacArthur genius awards awarded to male and females. It is based on
the average age and the year is was awarded dating back to 1981.