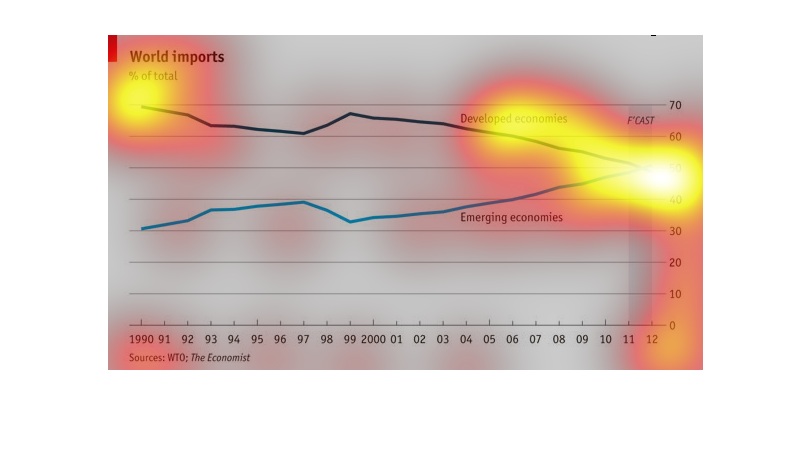
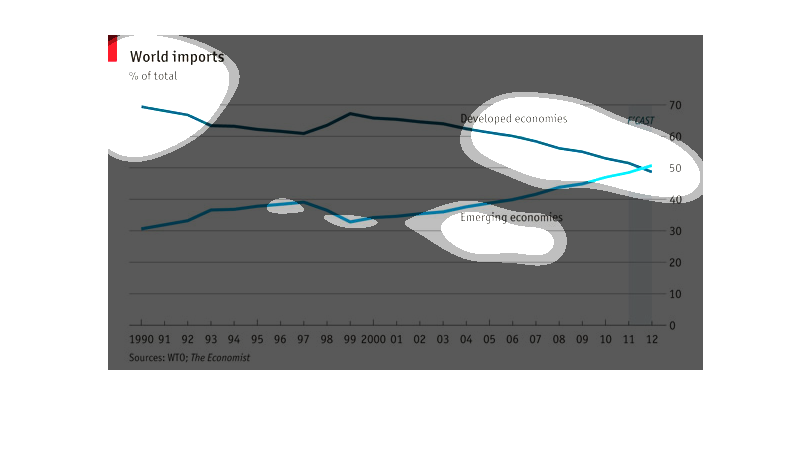
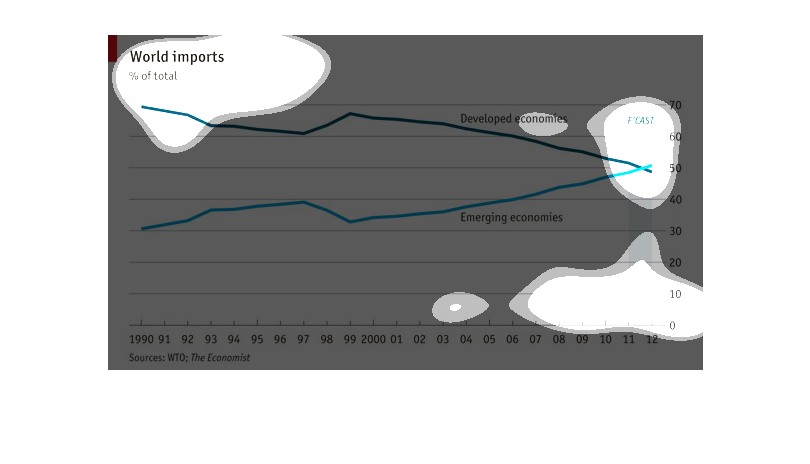
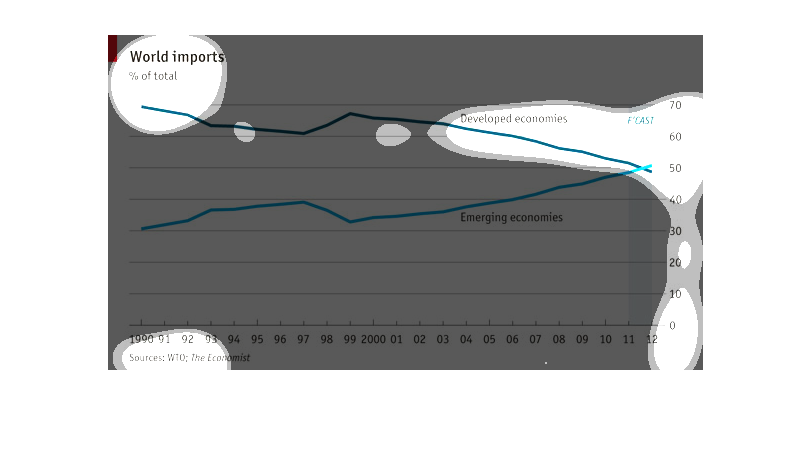
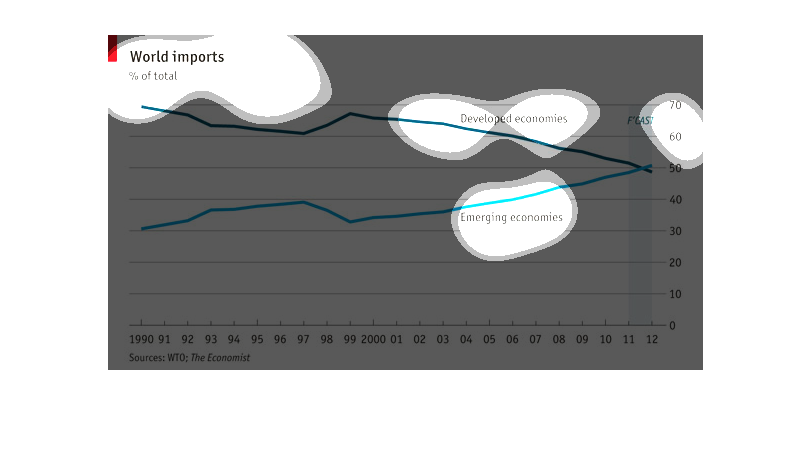
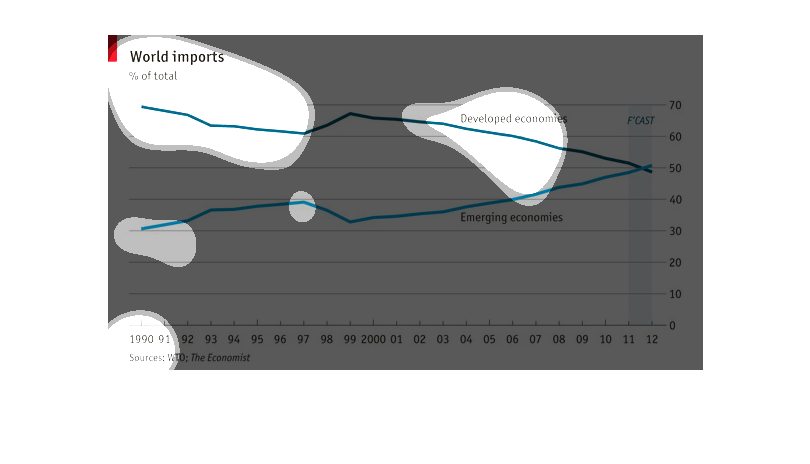
This graph shows world imports and percent of total. This shows the time period from 1990
to 2012. It compares developing economies versus emerging economies. In 2012 they appear to
converge.
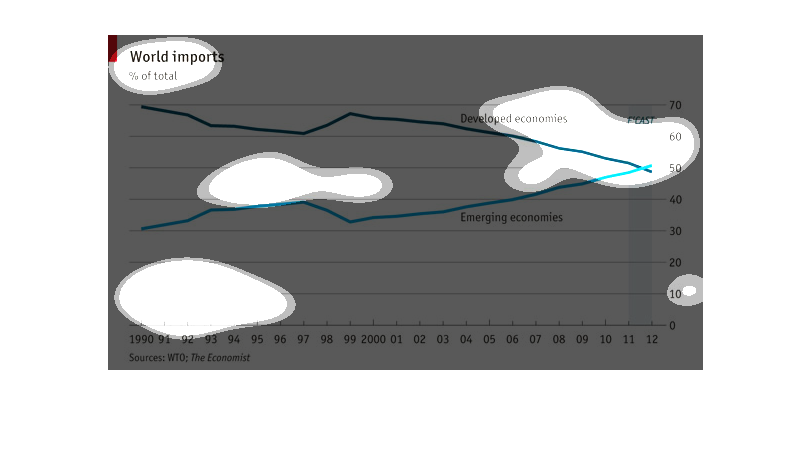
World Imports percentage total. Shows emerging economies vs  already developed economies on
a graph. From 1990 until 2012 the emerging economy started low at 30 and now has risen above
the 50 mark. Where as the developed economies started at 70 in 1990 and plummeted to right
below 50 f'cast.
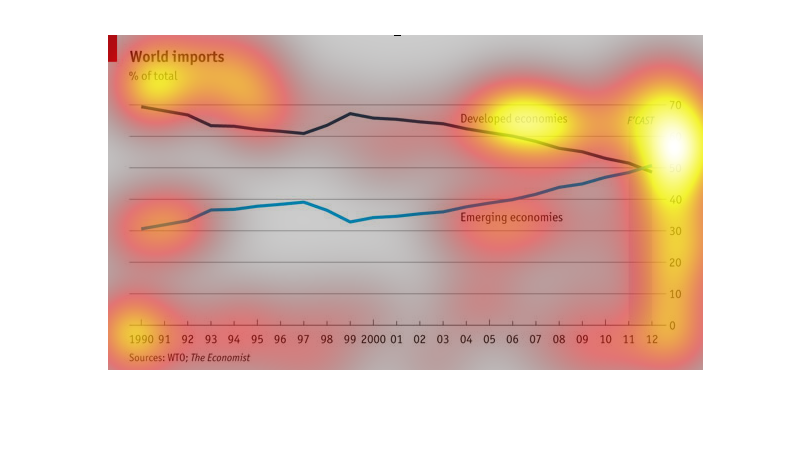
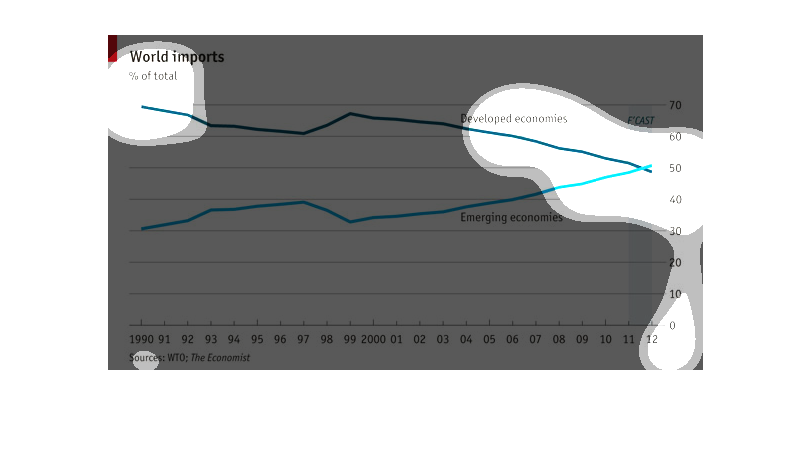
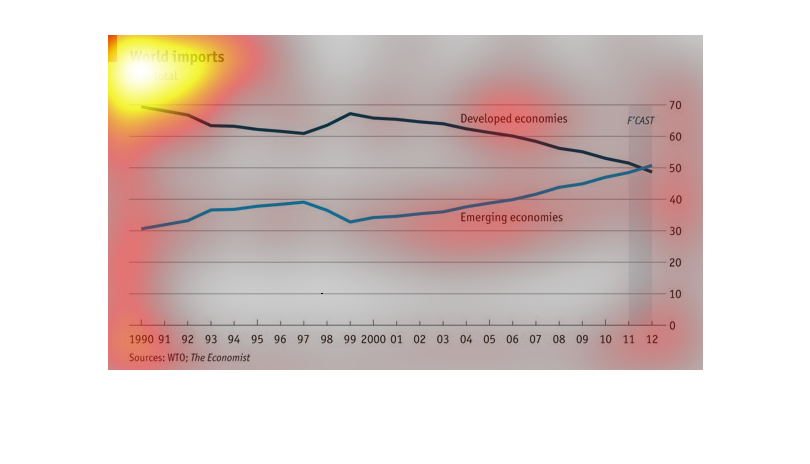
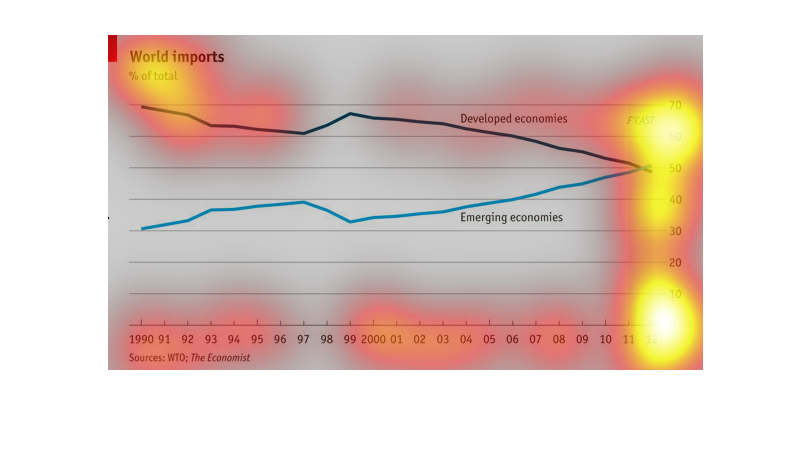
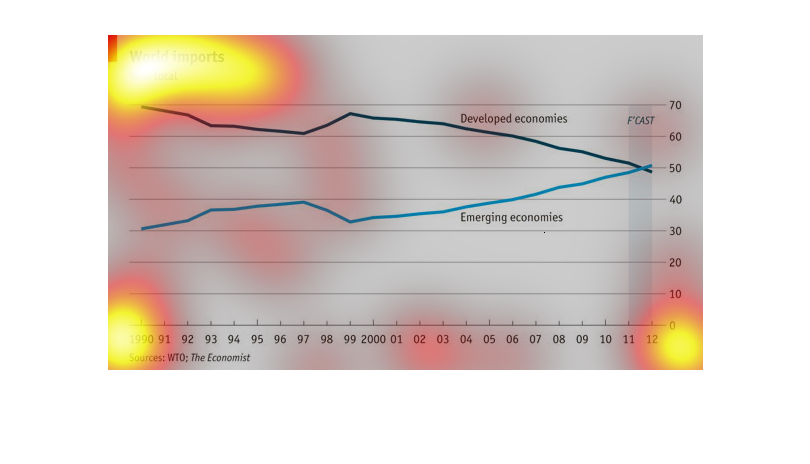
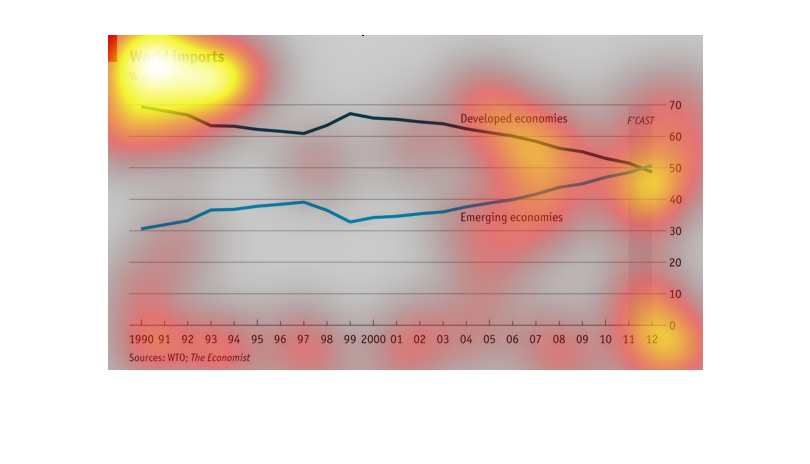
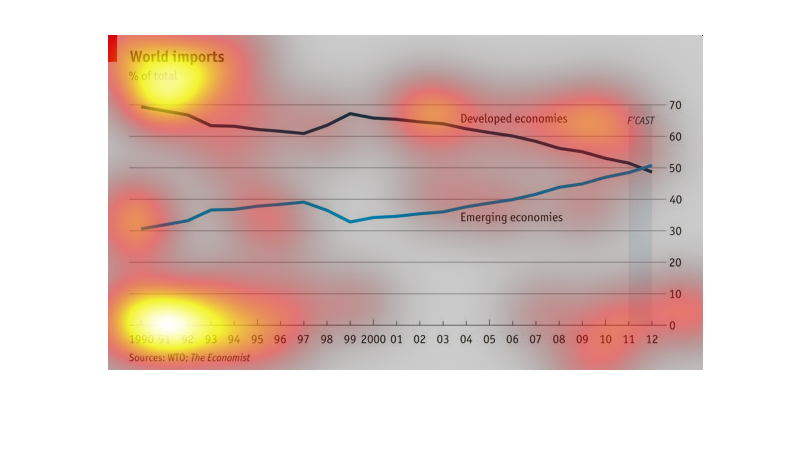
This image shows the percentage of total for world imports. Imports are on the decline for
developed countries. However, they are increasing for emerging countries.
This chart shows world imports as a percentage of total (which is ambiguous, in my opinion)
from 1990 through 2012 for developed countries and emerging economies.   In general, world
imports as percentage is increasing for emerging economies and decreasing for developed countries.
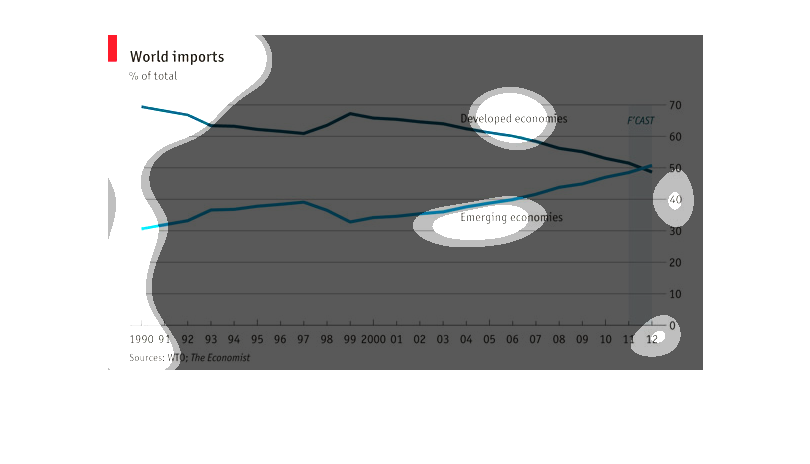
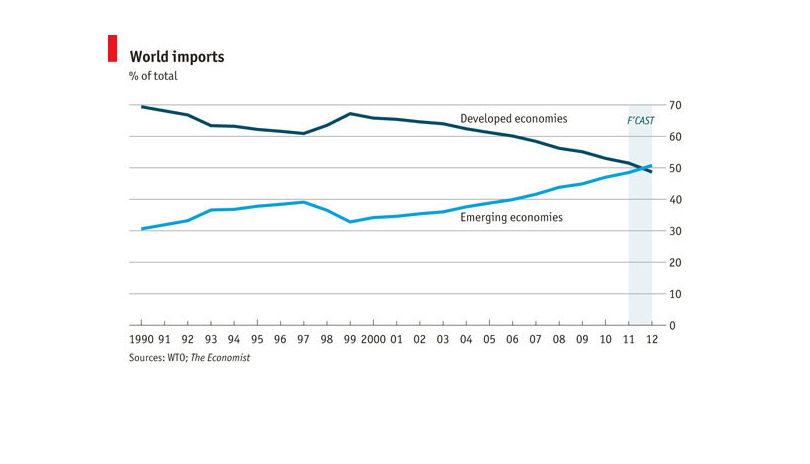
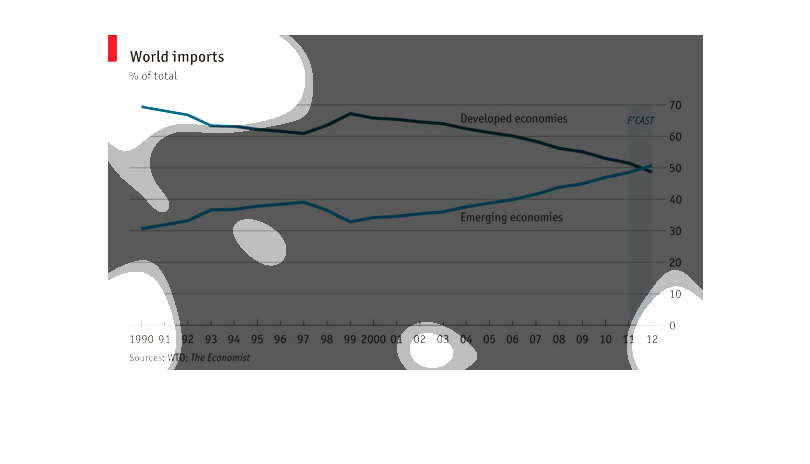
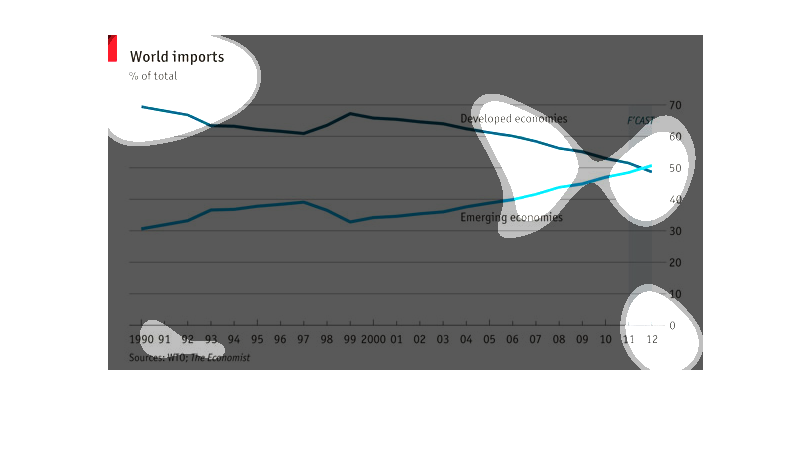
This chart describes and depicts the world imports from emerging economies and developed economies
from the year nineteen ninety to the year two thousand and twelve.
This graph is explaining world imports and the changes that have occurred over the last several
years.  It begins at the year 1990 and continues through every year until 2012.
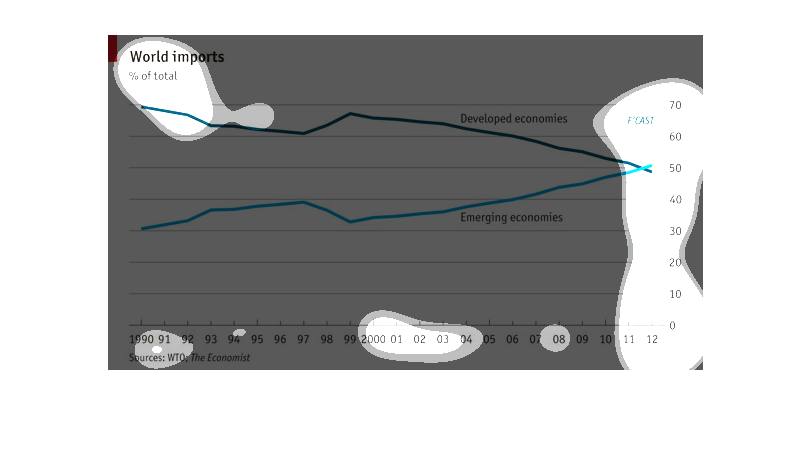
This image is a graph of World imports as a percentage of total from 1990 to 2012. It then
further divides the graph between developed countries and developing countries.
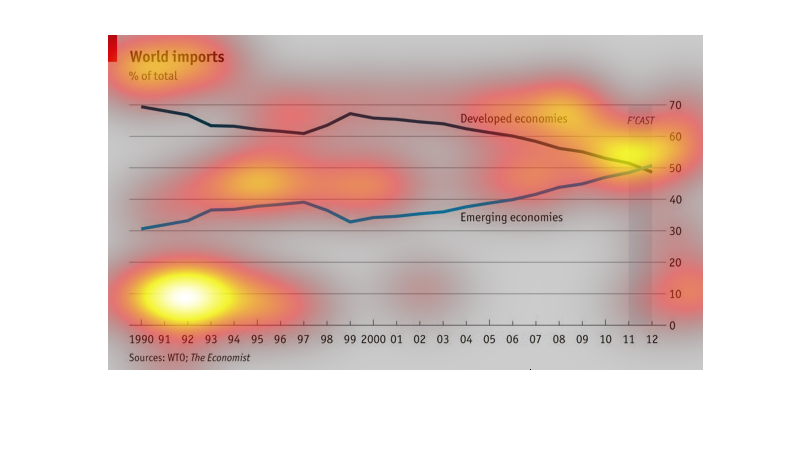
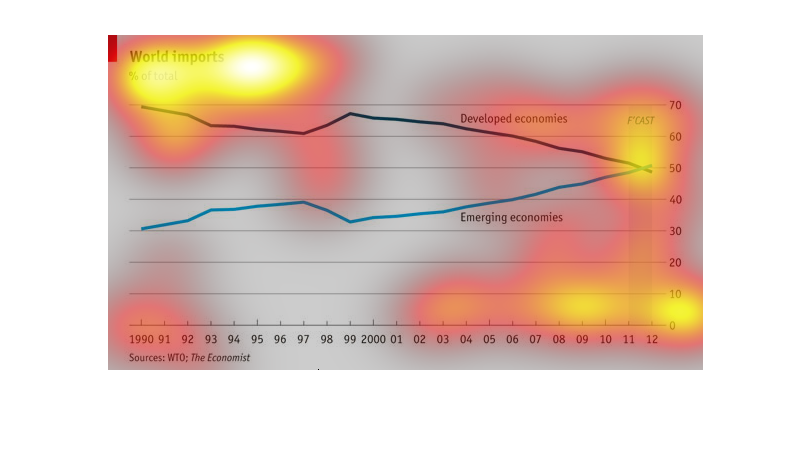
The graph sows the global imports between several years over a wide range. The years covered
are from the year 1990 to the year 2012. The totals are in the form of percentages.
This is a graph showing world imports based on the comparasion of of world economies that
are developed and world economies that are emerging economies. The trends that this chart
has had in recent years.
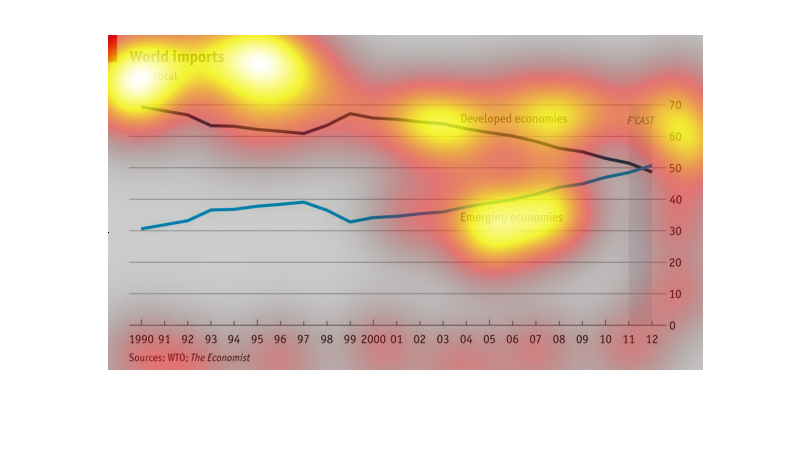
The chart is a line graph focusing on World Imports based on percentage.  It focuses on developed
versus  emerging countries in the years from 1990 to 2012.
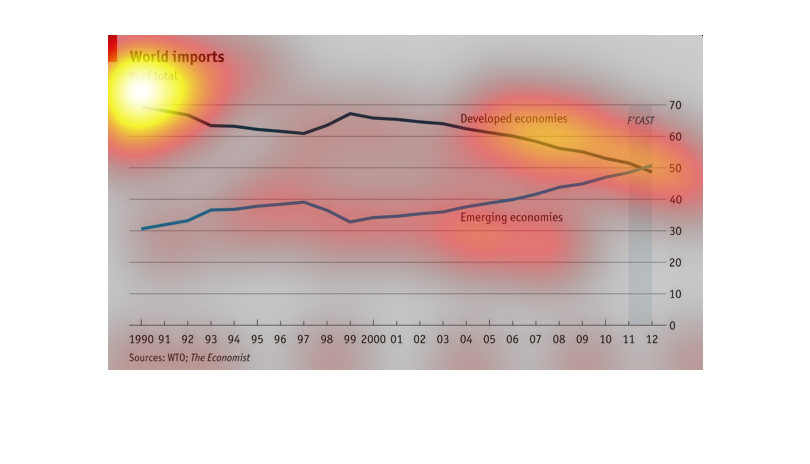
The title of this graph, parked in the top left hand corner of the page is World imports.
 Data begins in 1990-2012.  The two main streams of data seem to show an increase in imports
among developing economies, and a downward trend among developed and established economies.
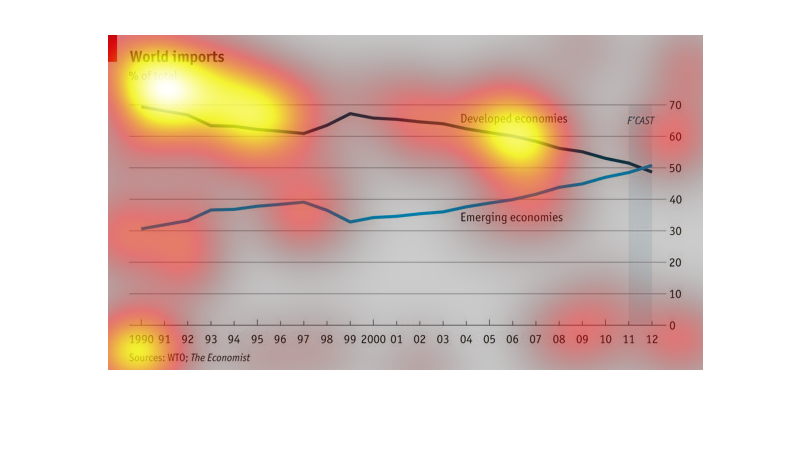
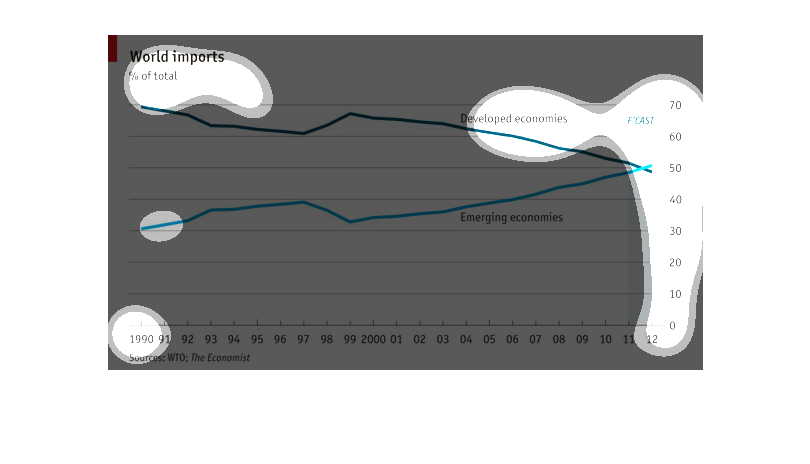
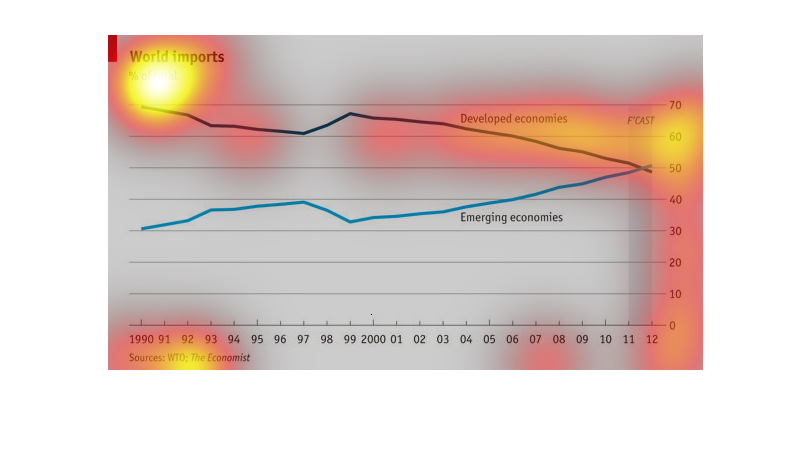
This chart shows World Imports with the total %. It covers from the year of 1990 to 2012.
The sources are from the WTO: the economist. It dark blue the line is for developed countries,
and in light blue it is for emerging economies.
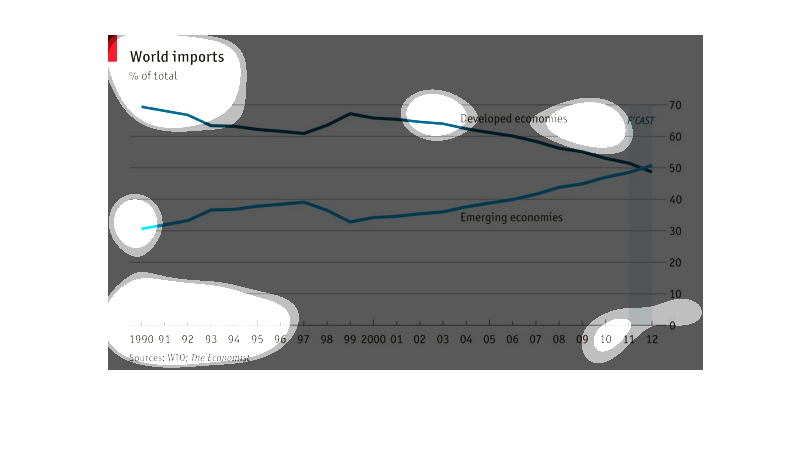
The chart represents the World imports from year 1990 through 2012 by both the developed and
emerging countries.  The trend is interesting showing that the imports are declining for the
developed countries and rising in imports for the emerging countries. Sometime between 2011
and 2012 the imports for developed and emerging countries were the same or the point of intersection.