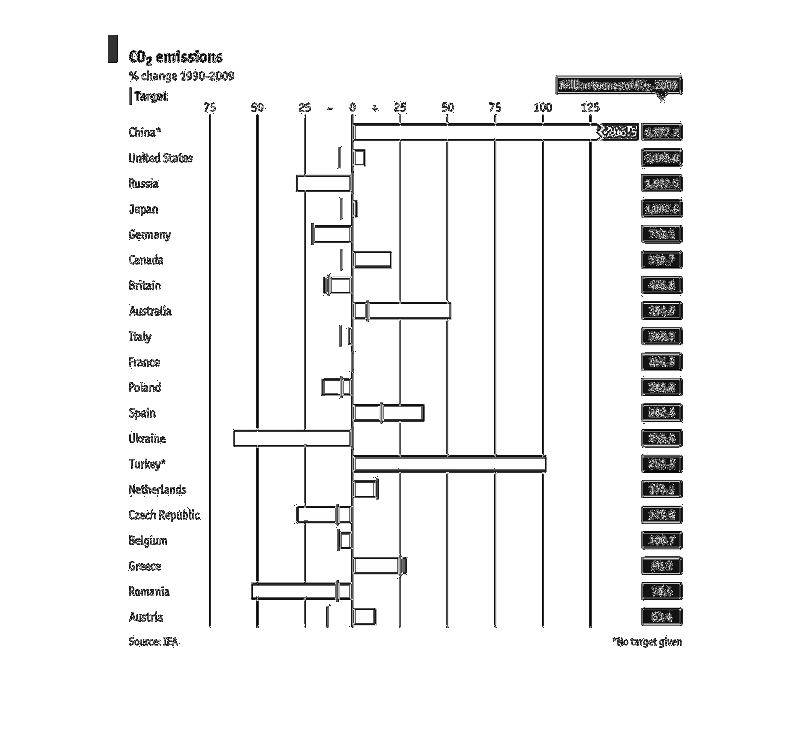
These graph presents detailed information on C02 emissions from 1990 through 2009.  On the
left side of the graph are listed countries from around the world.  Across from each country
is that countries C02 pollution in tons.
Error using .*
Matrix dimensions must agree.

Error in plotSpotlight (line 30)
    output = repmat(a,[1 1 3]).*single(im)/255;

Error in plot_individual_user_maps (line 49)
        [heat] = plotSpotlight(im,heatmap,3);