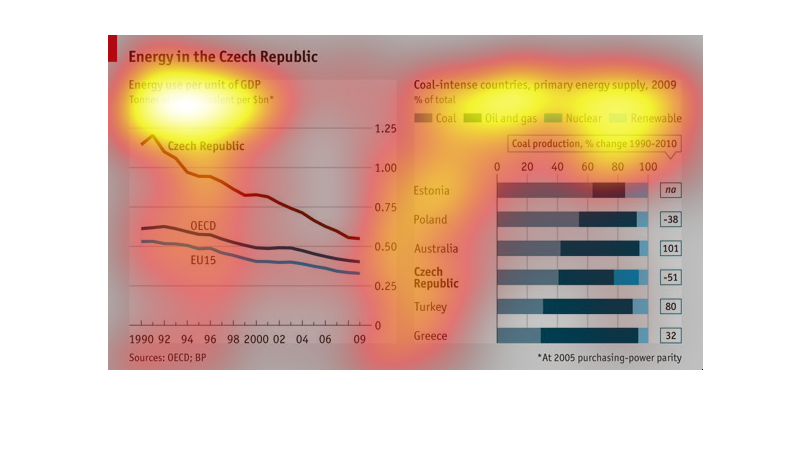
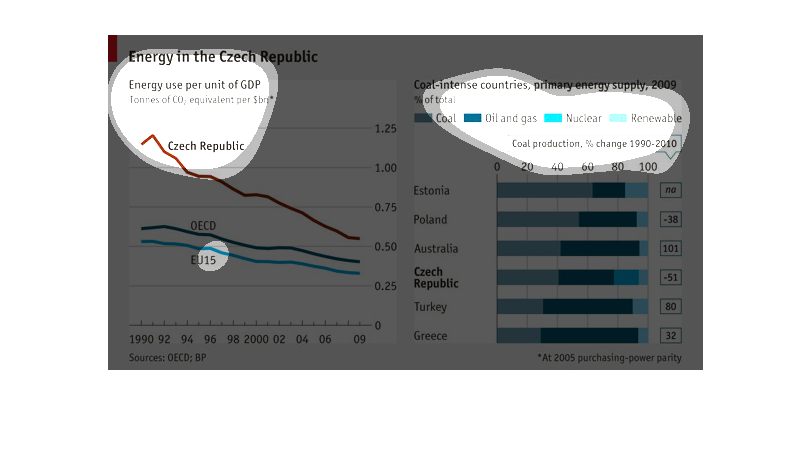
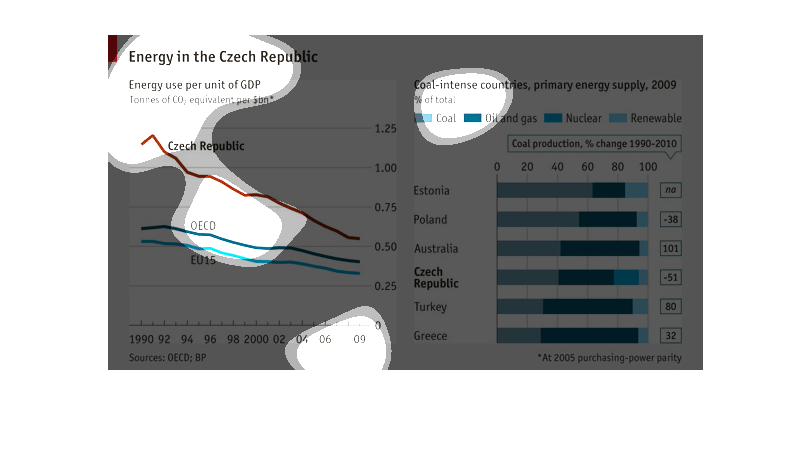
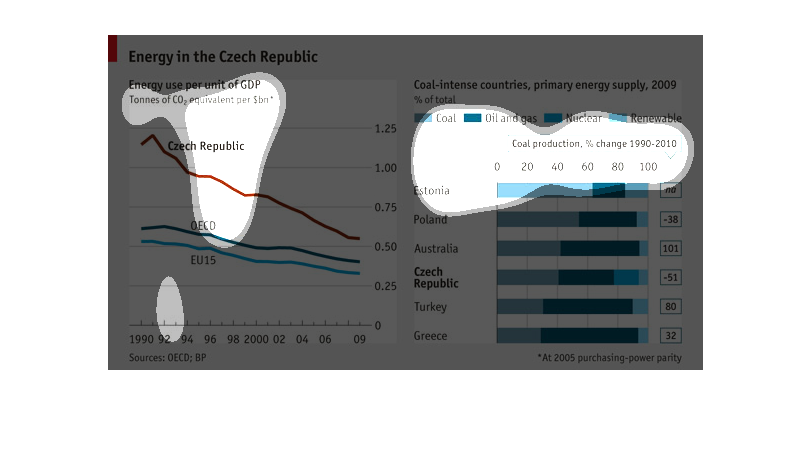
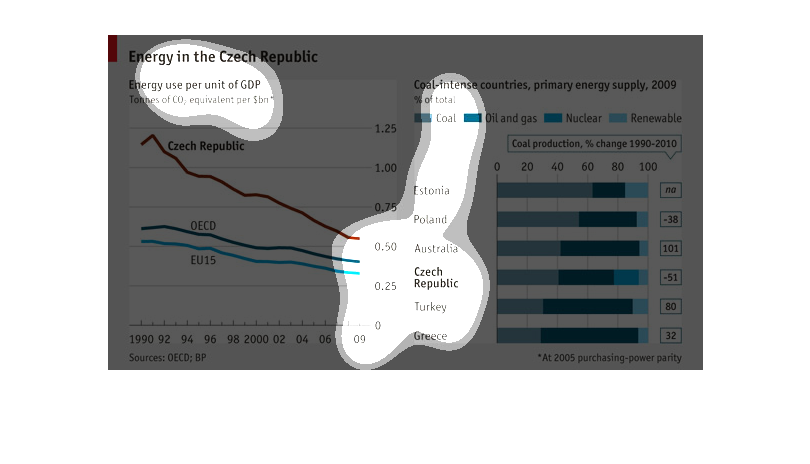
This describes the energy use in the Czech Republic as a percentage of GDP, or Gross Domestic
Product. and it covers the years from 1990 to 2009. It also shows coal intense primary industries
countries such as Estonia, Poland, Australia, Turkey and Greece and compares their usage with
the Czech Republic.  in 2009 and looks at the percentage of coal, oil and gas, nuclear and
renewable fuels and the percentage of change from 1990 to 2009
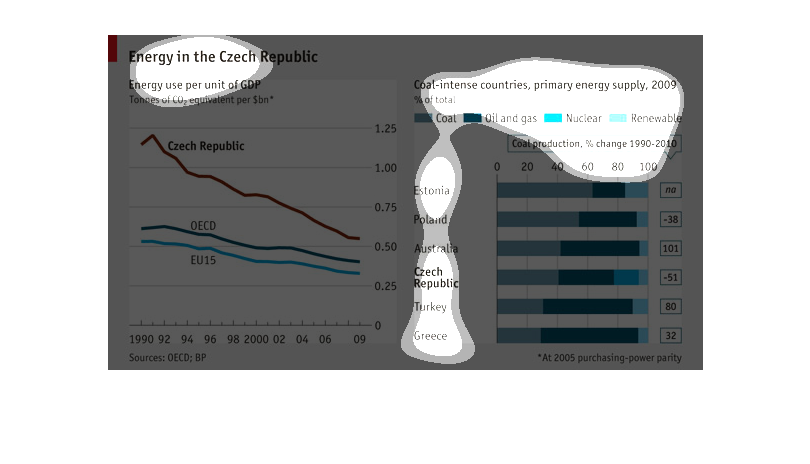
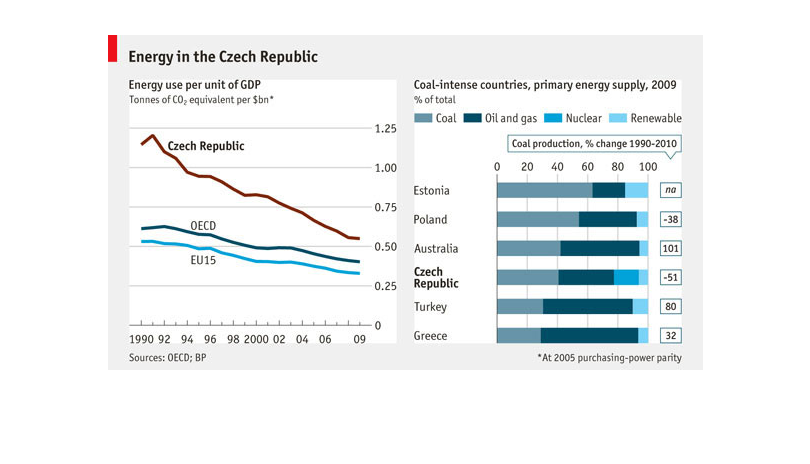
These are two energy charts. This charts illustrate Energy in the Czech Republic.  The one
on the left shows Energy use per Unit of GDP, Tonnes of CO2 equivalent per billion, from 1990
to 2009. The scale starts at 0 and ends at 1.25. The right shows Coal Intensive Countries
primary energy supply, with bars colored for coal, oil and gas, nucular and renewable. The
chart features Estonia, Poland, Austria, Czech Republic, Turkey and Greece. this chart is
comparing Czech Republic coal production percent change to the other countries.
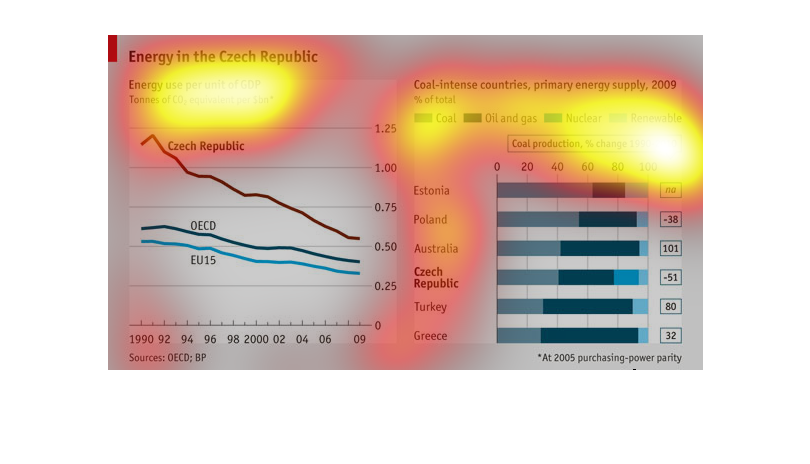
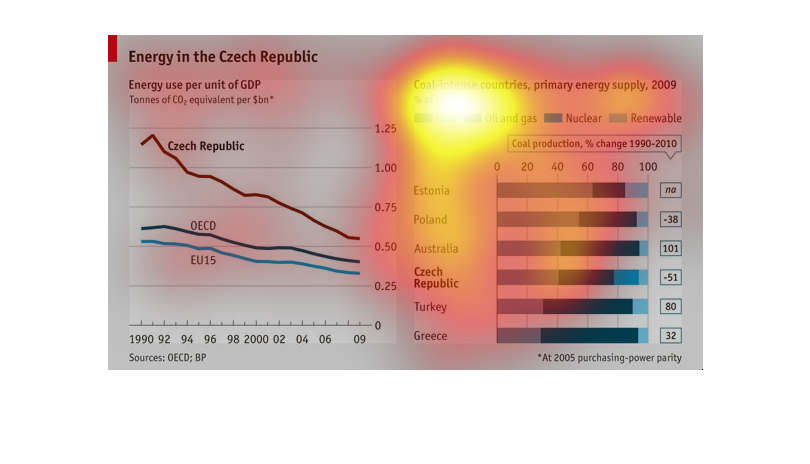
energy in the Czech republic. chat of energy use per unit of GDP. tons of co2 equivalent per
$bn in the Czech republic.  graph of coal intense countries, primary energy supply, 2009.
coal, oil and gas, nuclear, renewable. coal production % change 1990-2010.
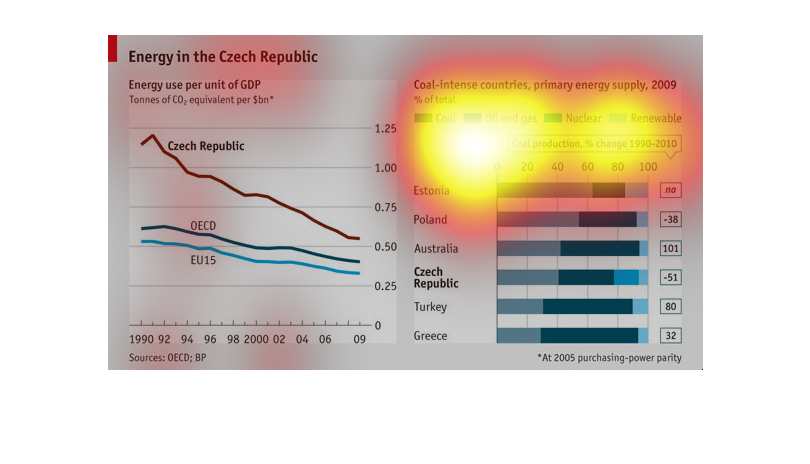
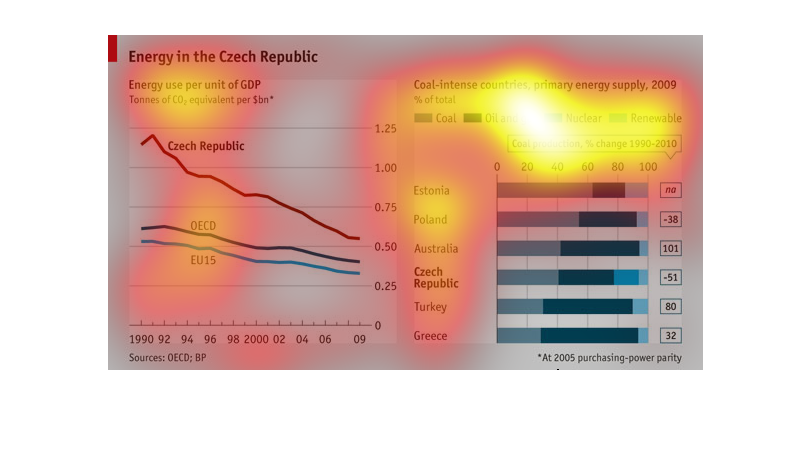
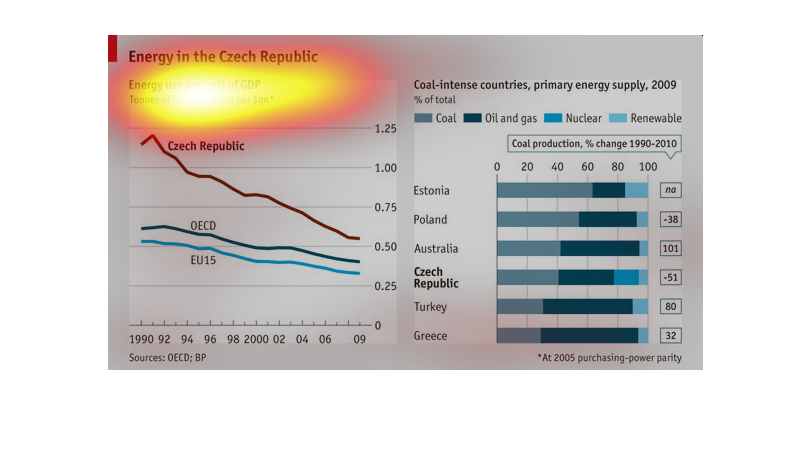
The image is about energy in the Czech republic as related to GDP. It also shows information
about coal usage in countries where coal is a primary energy source. It's about 60% in Estonia,
50% in Poland, 40% in Australia and the Czech republic, and 25% in Turkey and Greece.
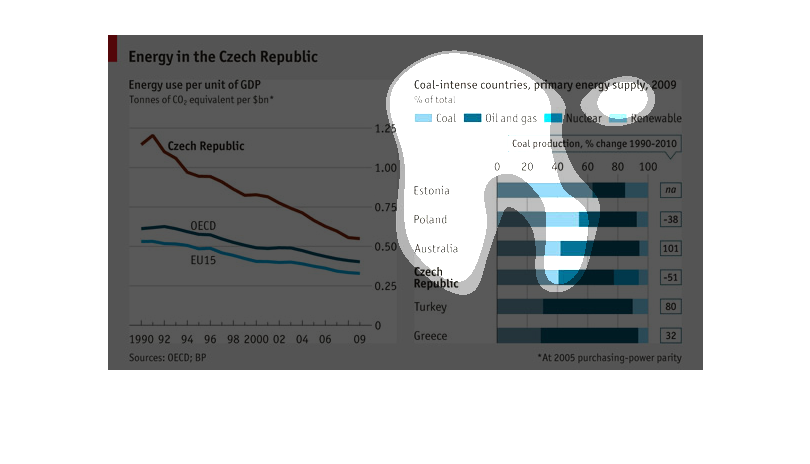
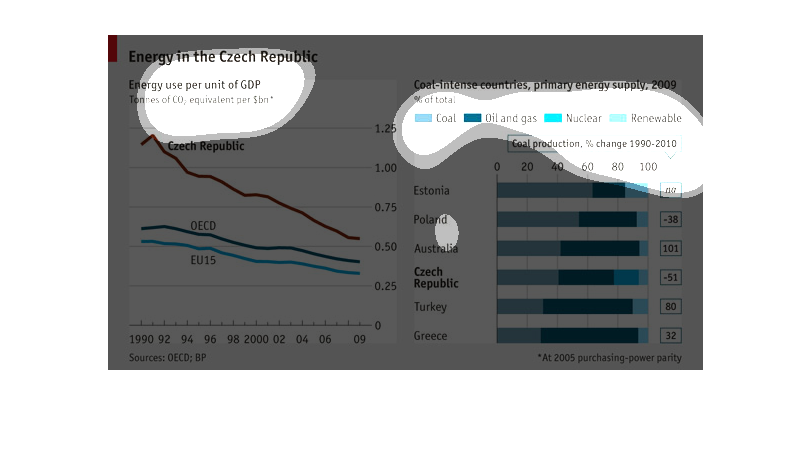
This line graph depict the energy used per unit of GDP in the Czech Republic from 1990 to
2009. Also to the right is a bar graph showing the countries that us coal as an energy\y source.
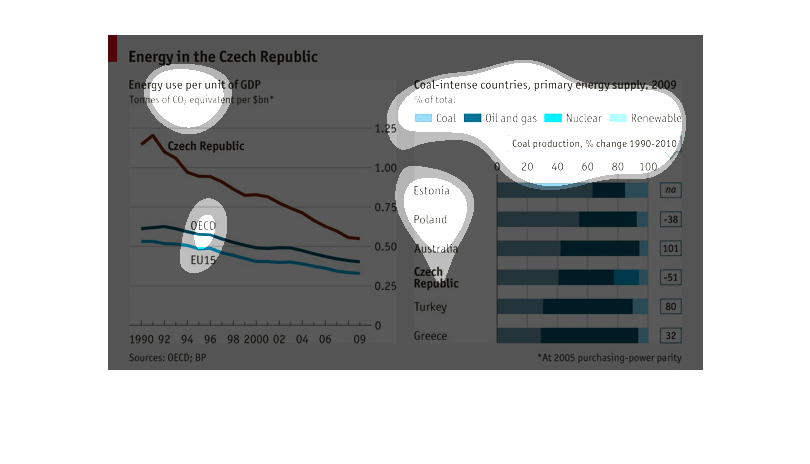
This chart shows Energy in the Czech Republic. It show Coal-intense, primary energy supply,
2009. The energy sources shown are: Coal, Oil, and gas, Nuclear, and Renewable.
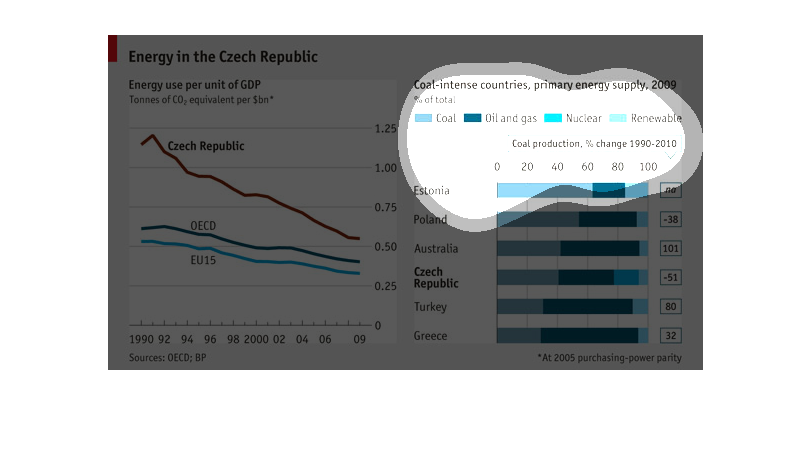
This infograoph shows energy usage per unit of GDP in the Czech republic. it compares the
use of coal, natural gas, nuclear and renewable energies from 1990-2010.
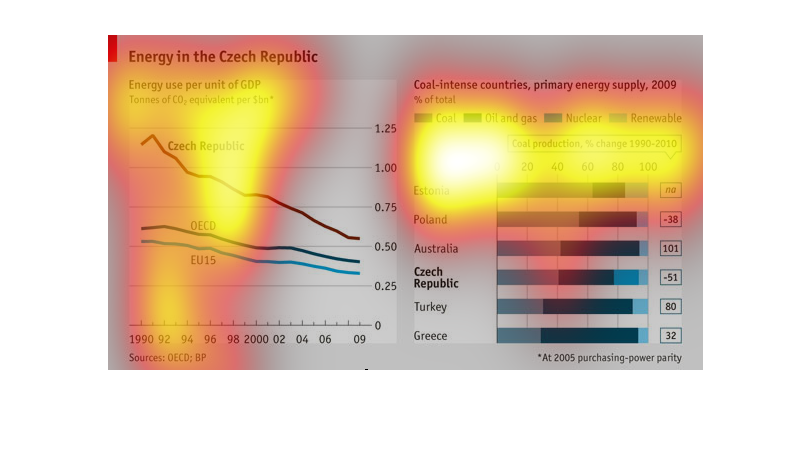
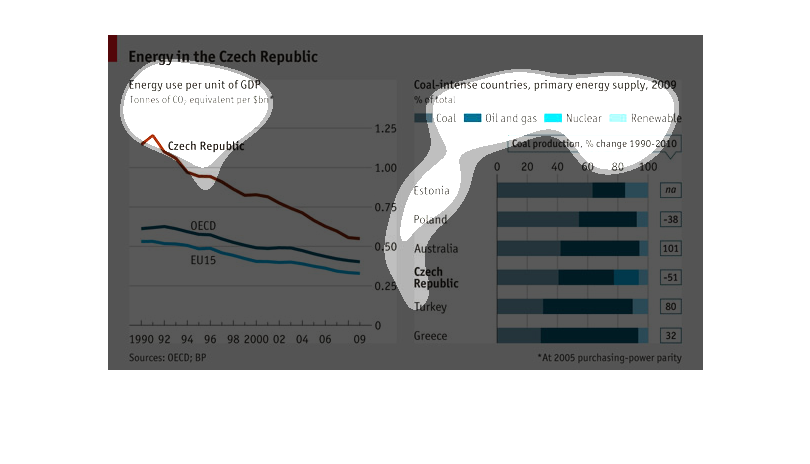
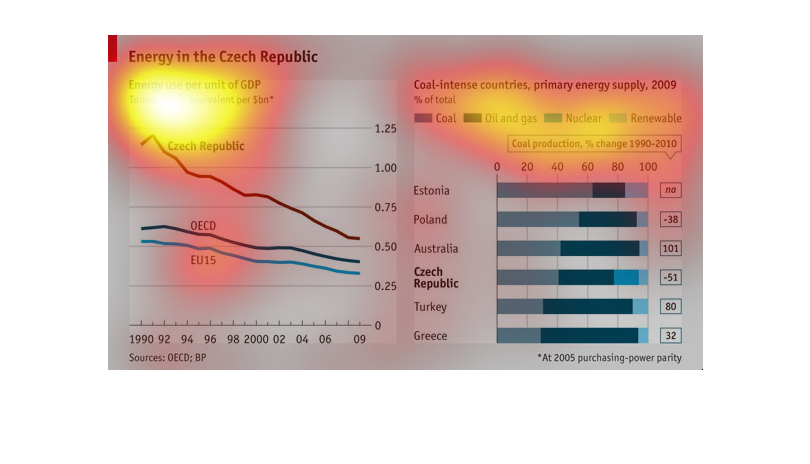
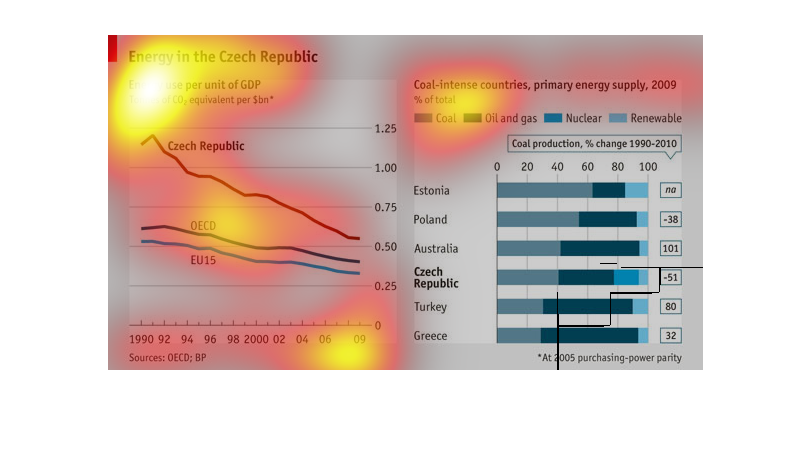
The title is Energy in the Czech Republic and it consists of two separate items.  The first
is a chronological representation of energy use of the Czech Republic compared to the EU15
and OECD.  The second is labelled coal-intense countries and compares the Czech Republic's
coal production change against other countries.
This chart depicts energy use in the Czech Republic compared to other European countries in
relation to GDP. Usage in the Czech Republic has been declining in this relationship as its
GDP has grown from 1990 to 2009.
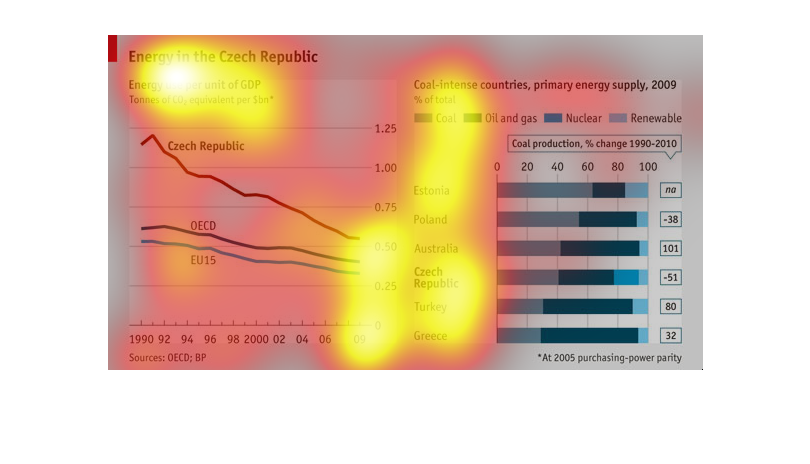
This chart describes and depicts the energy consumption in the Czech Republic by showing the
energy use per unit of GDP from the year 1990 to the year 2009.
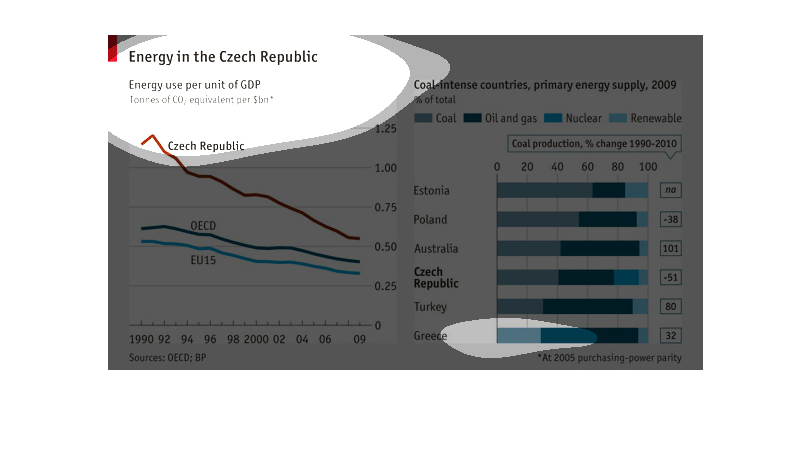
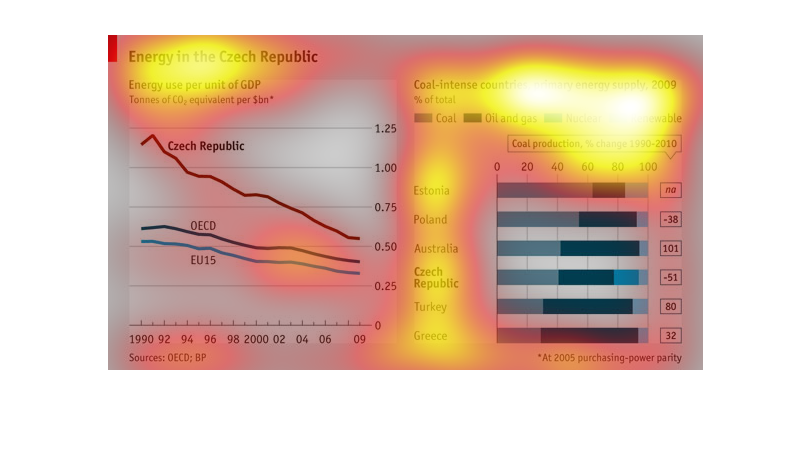
This chart offers two different graphs both of which refer to energy usage in the Czech Republic.
    The left hand graph measures energy use per unit of gross domestic product between 1990
and 2009.   The graph on the left, which is a bar graph, measures Coal intensive countries
primary energy supply for 2009.  These countries are Estonia, Poland, Australia, Czech Republic,
Turkey and Greece.  Additionally, this chart measures coal production percentage changes for
the years  1990-2010.  The colors used on this chart are dark blue, light blue and brown.