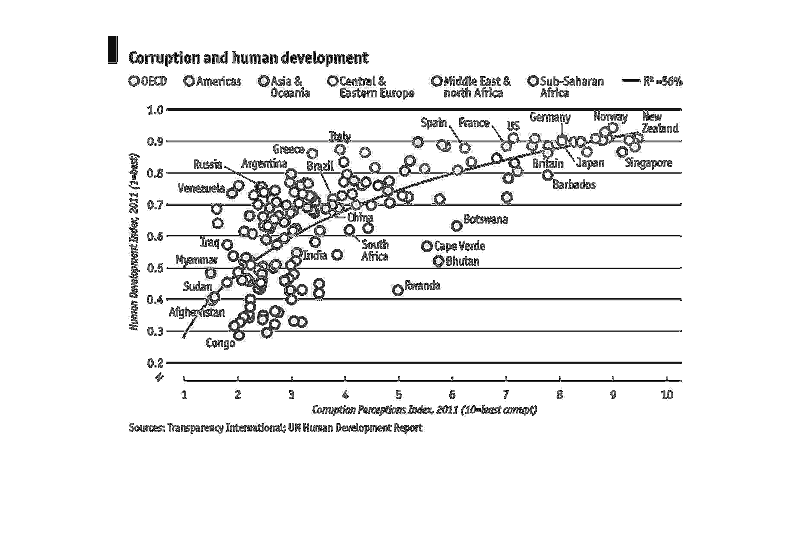
This graph compares Corruption and Human Development. and covers a wide range of areas around
the world. According to the chart as the world has been developing it has also been corrupted.
The more development there is the more corrupt it has become.
Error using .*
Matrix dimensions must agree.

Error in plotSpotlight (line 30)
    output = repmat(a,[1 1 3]).*single(im)/255;

Error in plot_individual_user_maps (line 49)
        [heat] = plotSpotlight(im,heatmap,3);