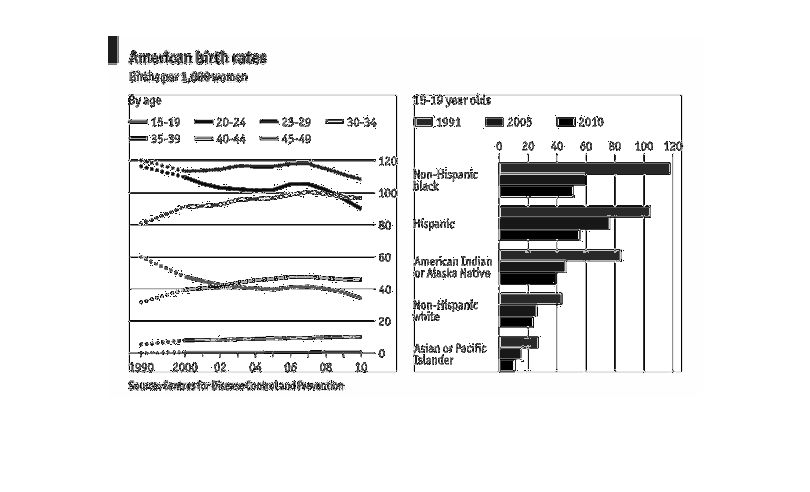
This chart measures American birth rates, the highest being ages 25-29, followed by 20 to
24, 30-34, 35-39, and then finally 40-44. This means that birth rates lessen with older age.
Birth rates have also gone down from 2006 to 2010. Non-Hispanic Black had the highest birthrates.
Error using .*
Matrix dimensions must agree.

Error in plotSpotlight (line 30)
    output = repmat(a,[1 1 3]).*single(im)/255;

Error in plot_individual_user_maps (line 49)
        [heat] = plotSpotlight(im,heatmap,3);