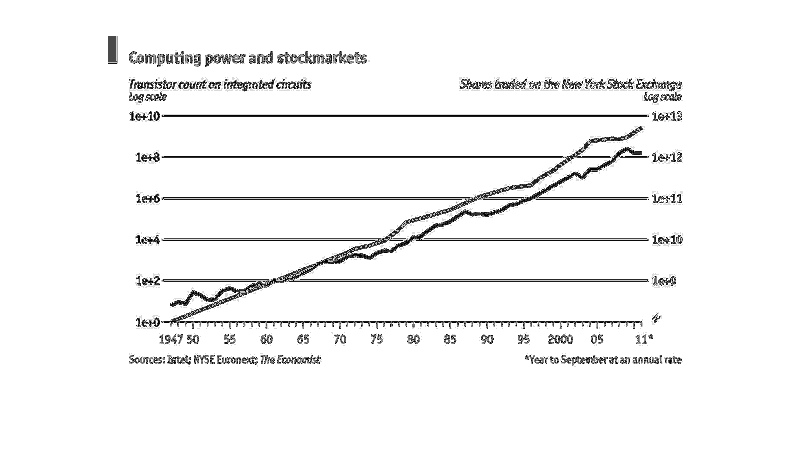
This chart shows a relationship between computing power and the stock market. As every year
passes, the computing power has gone up. The blue line almost touches the peak of 1e+13 and
the black line touches a notch above 1e+12.
Error using .*
Matrix dimensions must agree.

Error in plotSpotlight (line 30)
    output = repmat(a,[1 1 3]).*single(im)/255;

Error in plot_individual_user_maps (line 49)
        [heat] = plotSpotlight(im,heatmap,3);