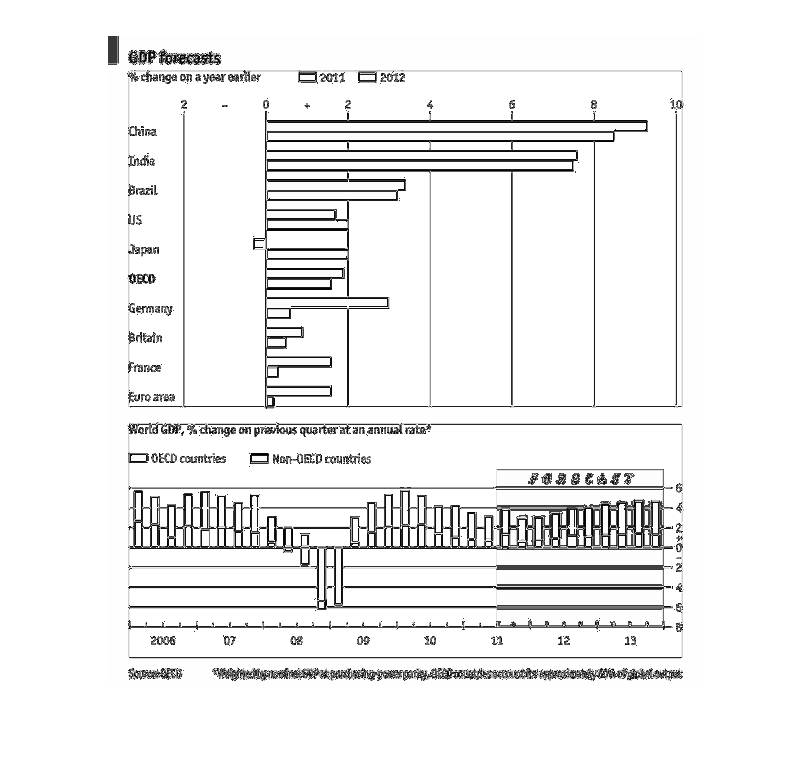
This graph shows GDP forecasts and percent change on year earlier. It shows 2011 and 2012.
There is also an additional graph that shows world GDP percent change on previous quarter
at an annual rate. This depicts OECD countries and non OECD countries.
Error using .*
Matrix dimensions must agree.

Error in plotSpotlight (line 30)
    output = repmat(a,[1 1 3]).*single(im)/255;

Error in plot_individual_user_maps (line 49)
        [heat] = plotSpotlight(im,heatmap,3);