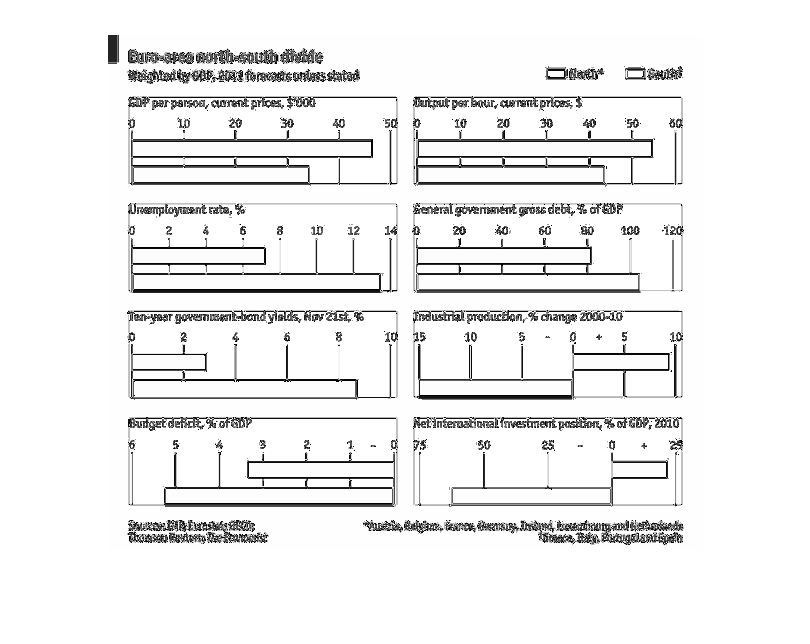
A picture with several smaller graphs titled "Euro-Area North South Divide". The graphs are
conveyed with blue bars, and each one tackles a different topic like debt or industrial production
change.
Error using .*
Matrix dimensions must agree.

Error in plotSpotlight (line 30)
    output = repmat(a,[1 1 3]).*single(im)/255;

Error in plot_individual_user_maps (line 49)
        [heat] = plotSpotlight(im,heatmap,3);