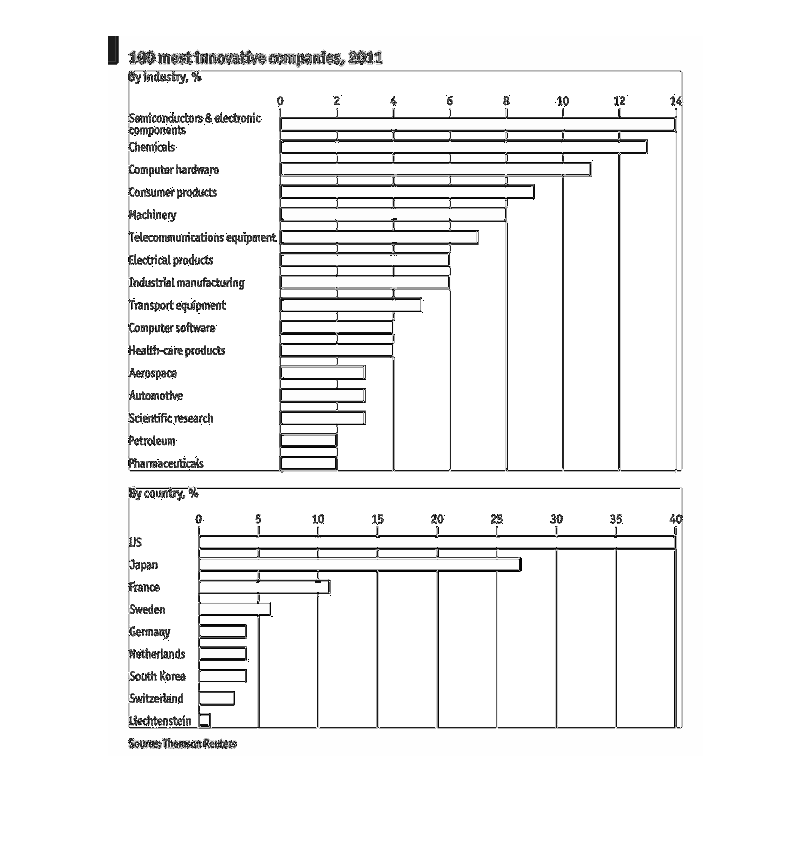
This chart depicts the one-hundred most innovative companies in the year two thousand and
eleven. It also show the percentage of several countries they belong to.
Error using .*
Matrix dimensions must agree.

Error in plotSpotlight (line 30)
    output = repmat(a,[1 1 3]).*single(im)/255;

Error in plot_individual_user_maps (line 49)
        [heat] = plotSpotlight(im,heatmap,3);