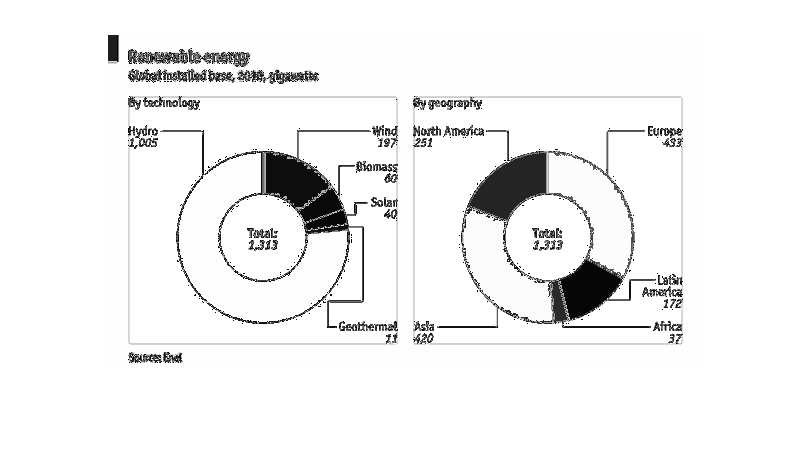
This chart shows the global renewable energy in gigawatts. There are two pie charts, one showing
the different types of renewable energy, the other one renewable energy used by geography.
Error using .*
Matrix dimensions must agree.

Error in plotSpotlight (line 30)
    output = repmat(a,[1 1 3]).*single(im)/255;

Error in plot_individual_user_maps (line 49)
        [heat] = plotSpotlight(im,heatmap,3);