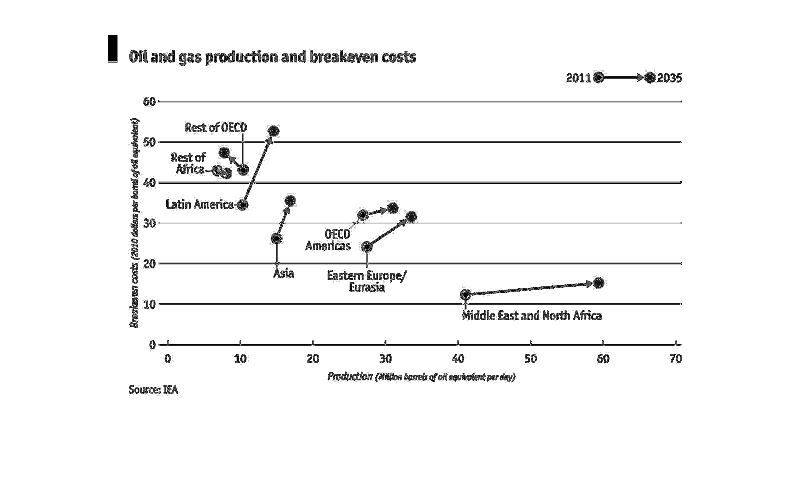
This image is describing oil and gas production break even costs from 2011 through 2035. This
includes, Africa, the Americas and the Middle East.  The numbers include the production of
oil per day at a million barrels (per day).
Error using .*
Matrix dimensions must agree.

Error in plotSpotlight (line 30)
    output = repmat(a,[1 1 3]).*single(im)/255;

Error in plot_individual_user_maps (line 49)
        [heat] = plotSpotlight(im,heatmap,3);